

Abstract
Insulin regulates ovarian phosphatidylinositol-3-kinase (PI3K) signaling, important for primordial follicle viability and growth activation. This study investigated diet-induced obesity impacts on: 1) insulin receptor (Insr) and insulin receptor substrate 1 (Irs1); 2) PI3K components (Kit ligand (Kitlg), kit (c-Kit), protein kinase B alpha (Akt1) and forkhead transcription factor subfamily 3 (Foxo3a)); 3) xenobiotic biotransformation (microsomal epoxide hydrolase (Ephx1), Cytochrome P450 isoform 2E1 (Cyp2e1), Glutathione S-transferase (Gst) isoforms mu (Gstm) and pi (Gstp)) and 4) microRNA’s 184, 205, 103 and 21 gene expression. INSR, GSTM and GSTP protein levels were also measured. Obese mouse ovaries had decreased Irs1, Foxo3a, Cyp2e1, MiR-103, and MiR-21 but increased Kitlg, Akt1, and miR-184 levels relative to lean littermates. These results support that diet-induced obesity potentially impairs ovarian function through aberrant gene expression.
Keywords: Obesity, phosphatidylinositol-3 kinase, ovary
1. Introduction
Globally, the prevalence of overweight and obesity is increasing, predisposing female to health hazards including diabetes, cardiovascular disease, cancer and compromised reproductive capacity [1-4]. 1.5 billion adults are overweight of whom 200 million men and 300 million women are obese. Further, approximately 43 million children (age 5-19) are overweight [5-10]. About 65% of the world’s population live in countries where being overweight is more responsible for morbidity than underweight, and currently about 2.8 million adults globally die every year as a result of being overweight or obese [1]. Formerly considered a problem of developed countries, this epidemic is now dramatically on the rise in low- and middle-income countries which have had a long incidence of food insecurity, now squaring them up for a binary affliction of disease. While toiling with infectious disease and under-nutrition, they are also paradoxically experiencing a rapid upsurge in non-communicable disease risk factors including obesity and overweight [11-13].
The mammalian ovary is the female gonad responsible for gamete production, as well as the female sex steroids, 17β-estradiol and progesterone. The ovary contains a finite number of primordial follicles at the time of birth, which serve as the follicular pool. Once depleted, primordial follicles cannot be replaced [14-22]. Though this theory has been to a certain extent challenged in recent years [23-25], it remains that the number of primordial follicles declines over the female lifetime. This is because the process of follicular growth is an irreversible process; once follicles are recruited from the resting pool into the growing pool they will undergo cell death if not selected for further growth to ovulation [26-33]. Unlike the cyclic recruitment of follicles to ovulation, initial follicular activation is independent of the pituitary gonadotropins [17, 18, 34, 35]. The intrinsic ovarian mechanism(s) triggering individual follicle activation are not yet fully known, however, several lines of evidence have identified potential candidate factors including phosphatidylinositol-3 kinase (PI3K). An overall balance among dormancy, activation and death of primordial follicles is believed to be the determining factor which decides the female reproductive lifespan [29, 31, 36-38]. Any external factor that could accelerate follicle activation could hasten the rate at which the ovary become devoid of the follicular pool, thus threatening the reproductive potential of the female.
Obesity has been demonstrated to have detrimental effects on female reproductive function. Obese women have an increased likelihood to display signs of polycystic ovarian syndrome (PCOS), ovulation defects, reduced fecundity and poor quality oocytes [4, 39, 40]. There is also an association between obesity and an increased risk of birth defects, premature and still-births, and gestational diabetes [4, 41], however, the molecular mechanisms involved are still lacking. Obesity is a contributing factor for development of type 2 diabetics, characterized by elevated blood glucose and impaired insulin signaling [42]. Diet-induced obesity with concomitant diabetes is a stimulus that provokes alterations in insulin level and its subsequent sensitivity on its target tissues. It has been long postulated that obesity not only compromises insulin sensitivity in classical tissues like muscle and liver but also in other insulin responsive tissues like the ovary [42-44]. This theory has recently been challenged in a diet-induced obesity model, where ovaries from female mice fed on 60 % kcal of fat for 12 weeks maintained insulin sensitivity, despite that other classical tissues like muscle and liver became insulin resistant [45].
The ovary possesses both insulin and insulin-like growth factor 1 (IGF-1) receptors which can be directly stimulated by their hormone ligands. Insulin not only controls critical energy functions such as glucose and lipid metabolism but also plays a crucial role in reproductive function. Insulin receptor (INSR) is a heterodimer comprised of two alpha subunits and two beta subunits [46, 47]. Insulin binds to the alpha subunits which activates the insulin receptor tyrosine kinase in the beta subunits, with subsequent auto phosphorylation and recruitment of different substrate adaptors such as the Insulin receptor substrate (IRS 1-4) family of proteins. Tyrosine phosphorylated IRS then display binding sites for numerous signaling partners including the PI3K/Protein kinase B (PKB/AKT) signaling pathway. Defects in IRS, more specifically IRS1 and IRS2, have been implicated in female infertility and rodent models with such defects have been found to display both ovarian and hypothalamic dysfunction [48-50].
Several lines of evidence have identified the importance of PI3K signaling in ovarian function [51]. Once PI3K is activated, AKT is recruited to the cell membrane where it becomes phosphorylated (pAKT), and mediates many downstream events [52-54]. PI3K/AKT has been implicated in regulating follicular activation [36, 38] recruitment, survival [29, 31], and development throughout the female reproductive lifespan [31, 51, 55-57]. PI3K also plays a role in proliferation and differentiation of granulosa cells (GC) in response to gonadotropins [29, 58] and it has been associated with ovarian carcinoma [31, 37, 38, 51, 55, 57-60]. In rodent models, Akt−/− mice were found to have reduced primordial follicle viability [57]. AKT has the ability to phosphorylate and inactivate several targets including forkhead transcription factors (FoxO). FoxO3 is critical for early stages of follicular growth [55] and it has been reported to trigger apoptosis through either up-regulation of genes necessary for cell death or down-regulation of anti-apoptotic genes [61-64]. FOXO3−/− mice had global primordial follicle activation by postnatal day 14, leading to oocyte death, early depletion of functional ovarian follicles and secondary infertility [55] while in FOXO3OE mice, no activation of primordial follicle pool was observed [65].
Insulin-mediated PI3K activation has been also suggested to regulate xenobiotic biotransformation genes [66]. Inhibition of ovarian PI3K increases both mRNA and protein levels of microsomal epoxide hydrolase (Ephx1)[67] Glutathione S-transferase Pi (Gstp) [68] and Glutathione S-transferase Mu 1 (Gstm) [69] suggesting that these enzymes could be downstream members of the PI3K signaling pathway. GSTP and GSTM are members of the GST protein family involved in phase II metabolism of xenobiotic compounds by converting a variety of electrophilic and hydrophobic compounds into more soluble, easily excretable compounds through catalyzing their conjunction with glutathione (GSH) [70]. EPHX1 and Cytochrome P450 isoform 2E1 (CYP 2E1) ensure the rapid detoxification of epoxides generated during the oxidative metabolism of xenobiotics, thus providing cellular protection against free radical and carcinogenic compounds [66, 71-73]. Any alteration in expression patterns of genes that encode for ovarian chemical biotranformation enzymes can pose a risk for the onset of ovarian dysfunction. This is because exposure to a number of chemical classes can destroy follicles of all types threatening the reproductive potential of exposed females through accelerated premature ovarian insufficiency, premature ovarian failure (menopause) and other associated health problems [22, 67, 74-77].
Several genes that are components of the PI3K pathway also are regulated by MicroRNAs (miR’s) [78-80]. MiR’s are small (19 – 25 bp) non-coding RNA that can positively or negatively regulate gene expression [81-85]. It is known that miR-21 inhibits phosphatase and tensin homolog (PTEN), an antagonist of PI3K [86, 87]. In vivo loss of miR-21 has been reported to increase ovarian apoptosis and as well compromise ovulation rates in rodent models [86, 88]. MiR-184 is believed to play a critical role in development as well as a mediator of apoptosis [79]. Up regulation of miR-184 can interfere with AKT action, repressing PI3K action [78, 85]. Also, miR-103 has been implicated in insulin sensitivity [89]. Thus, miR’s may mediate the response to insulin signaling, through the PI3K pathway.
In summary, obesity results in reproductive dysfunction and an increase in negative consequences for offspring, and insulin signaling is impaired in obesity. Additionally, insulin can activate PI3K signaling, which is critical for controlling the rate of activation of primordial follicles, and is an upstream regulator of xenobiotic metabolism gene expression. There remains a dearth of knowledge regarding whether obesity can influence ovarian xenobiotic metabolism, thus we hypothesized that obesity caused by a high fat diet would alter ovarian PI3 kinase signaling with subsequent effects on genes encoding xenobiotic metabolism enzymes in female mice.
2. Materials and Methods
2.1. Reagents
2-β-mercaptoethanol, 30% acrylamide/0.8% bis-acrylamide, ammonium persulfate, glycerol, N’,N’,N’,N’-Tetramethyl-ethylenediamine (TEMED), Tris base, Tris HCl, sodium chloride, Tween-20, bovine serum albumin (BSA), ascorbic acid (Vitamin C), phosphatase inhibitor, protease inhibitor and transferrin were purchased from Sigma-Aldrich Inc. (St. Louis, MO). Hanks’ Balanced Salt Solution (without CaCl2, MgCl2, or MgSO4), DAPI nuclear stain and superscript III one-step RT-PCR System were obtained from Invitrogen Co. (Carlsbad, CA). miRNeasy Mini Kit, miScrip Reverse Transcription Kit, miScrip SYBR Green PCR Kit, RNeasy Mini kit, QIAshredder kit, RNeasy MinElute kit, TaqMan® microRNA Reverse Transcription Kit and QuantitectTM SYBR Green PCR kit were purchased from Qiagen Inc. (Valencia, CA). Goat anti-rabbit and goat anti-mouse secondary antibodies were purchased from Pierce Biotechnology (Rockford, IL). Custom designed primers were obtained from the DNA facility of the Office of Biotechnology at Iowa State University. Ponceau S was purchased from Fisher Scientific (Waltham, MA, USA). ECL plus chemiluminescence detection kit was obtained from GE Healthcare, Amersham (Buckinghamshire, UK). Anti-GSTP and anti-GSTM antibodies were purchased from Millipore (Temecula, CA, USA). Anti-pAKTSer473 and β-Actin antibodies were from Cell Signaling Technology and anti-insulin receptor (INSR) antibody was purchased from Abcam (Cambridge, MA, USA). Secondary antibodies were obtained from EMD Millipore (Billerica, MA).
2.2. Animal and diets
Ovarian tissues were obtained from a study at the University of Missouri. The experimental protocols were approved and performed in accordance with the guidelines of the University of Missouri Institutional Animal Care and Use committee as previously described [90]. Briefly, twelve 6 weeks old C57Bl/6J female mice were randomized into two groups (n = 6 per group). The control group was fed a standard chow mice diet (Purina 5001; 4.5g/100g fat) while the treatment group was fed a high-fat diet (HFD; Research Diets D12492; 35g/100g fat) for approximately 7 months. The animals were housed at constant room temperature, 12h light:12h darkness cycle, diet and water were provided ad libitum. Body weight for the control and HFD mice were 24.8g ± 0.45 and 46.5g ± 2.0, respectively. Gonadal adipose tissue weight was 0.44g ± 0.05 and 3.74g ± 0.35 in the control and HFD mice, respectively [90]. After 7 months glucose tolerance testing confirmed that HFD-fed mice had elevated blood glucose, relative to their control-diet fed littermates [90]. There was no impact of HFD on plasma estradiol [90]. The HFD mice are subsequently referred to as obese, and their non-HFD fed littermates are referred to as lean.
2.3. Tissue collection
Animals were euthanized by CO2 asphyxiation. Ovaries were removed, trimmed of excess fat, weighed and snap frozen for gene expression analysis or fixed in 4% paraformaldehyde for histological analysis.
2.4. RNA Isolation
Total ovarian RNA was isolated using Qiagen RNeasy® Mini Kit (n = 6 per dietary treatment). Briefly, ovaries were lysed and homogenized using a hand held homogenizer. The homogenate was then applied to a QIAshredder column placed in a collection tube and centrifuged at 16100 RCF for 2 minutes at room temperature. The flow through was then applied to an RNeasy Mini column, allowing RNA to bind to the filter cartridge. Following washing, RNA was eluted from the filter and concentrated using an RNeasy MinElute kit. RNA was eluted using 14 μl of RNase-free water and quantified using an ND-1000 Spectrophotometer (λ = 260/280 nm; NanoDrop technologies, Inc., Wilmington, DE).
2.5. First Strand cDNA synthesis and quantitative Real-Time quantitative polymerase chain reaction (qRT-PCR)
Total RNA (0.5 μg) was reverse transcribed to cDNA using Invitrogen™ Superscript III Reverse Transcriptase according to the manufacturer’s protocol. Diluted cDNA (2 μl; 1:20 dilution) were amplified on an Eppendorf Mastercycler using Quantitect™ SYBR Green PCR kit and primers specific for mouse Actb, Insr, Irs1, Kit Ligand (Kitlg), c-Kit, Akt1, Foxo3a, Cyp2e1, Ephx1, Gstp, and Gstm (See table 1 for primer sequences). The PCR cycling program consisted of a 15 min hold at 95 °C and 40 cycles of: denaturing for 15 at 95 °C, annealing for 15s at 58 °C and extension at 72 °C for 20s. Product melt conditions were determined using a temperature gradient from 72 °C to 99 °C with a 1 °C increase at each step. Three replicates of each sample (n = 6 per dietary treatment) were included. Statistical analysis was performed on the cycle numbers at which each sample reached a threshold level. The relative mRNA expression for each of the above genes was normalized using mouse Actb as a housekeeping gene and relative fold change calculated using the 2−ΔΔCT method. The results are presented as mean fold change ± standard error relative to the control group.
Table 1.
Sequences of primers used
| Primer name | Sequence |
|---|---|
| Insr-for | ATGGGCTTCGGGAGAGGAT |
| Insr-rev | GGATGTCCATACCAGGGCAC |
| Irsl-for | GGATGTCCATACCAGGGCAC |
| Irsl-rev | CAGCCCGCTTGTTGATGTTG |
| Cyp2e1-for | CCCAAGTCTTTAACCAAGTTGGC |
| Cyp2e1-rev | CTTCCATGTGGGTCCATTATTGA |
| c-kit-for | GCCACGTCTCAGCCATCTG |
| c-kit-rev | GTCGGGATCAATGCACGTCA |
| Kitlg-for | GAATCTCCGAAGAGGCCAGAA |
| Kitlg-rev | GCTGCAACAGGGGGTAACAT |
| Akt1-for | CCACCTGTCTCTAGGGTCCA |
| Akt1-rev | CATGGGACACAGCAACAAAC |
| Gstp-for | CCCAAGTTTGAGGATGGAGA |
| Gstp-rev | CAGGGCCTTCACGTAGTCAT |
| Gstm-for | GAGAGGATCCGTGCAGACAT |
| Gstm-rev | ACTTGGGCTCAAACATACGG |
| Foxo3a-for | GGTACCAGGCTGAAGGATCA |
| Foxo3a-rev | CAGTCTCTGCTGGGTTAGGG |
2.6. mirScript miRNA PCR array
Purification of miRNA-enriched fractions was performed using a miRNeasy Mini Kit according to manufacturer’s protocol (n = 3 per dietary treatment). MiRNA-enriched fractions (250 ng) in a reverse-transcription reaction of 20 μl were converted to cDNA using miScrip Reverse Transcription Kit. cDNA was then diluted by adding 200 μl of RNase-free water, from which, 100 μl was used as template cDNA for real-time PCR quantification of multiple microRNAs using miScrip SYBR Green PCR Kit. Data analysis was performed using the web-based miScript miRNA PCR Array Data Analysis package. TaqMan® microRNA Reverse Transcription Kit was used to validate the expression of miR-21. The amount of target miRNA was normalized using RNU43 as a housekeeping miRNA.
2.7. Histological analysis of ovarian tissue
One ovary from each animal was fixed in 4% paraformaldehyde, embedded in paraffin, and serially sectioned (5 μM) at the Iowa State University Veterinary Medicine Histopathology laboratory. Sections were mounted (3-4 per animal), and one section was stained with hematoxylin and eosin (H&E). Digital images were acquired with a Leica DMI300B Fluorescent Microscope.
2.8. Protein Isolation and Immunoblot analysis
Total ovarian protein was isolated and immunoblots performed as previously described 75. Briefly, ovaries were homogenized in ~ 200 μl of iced-cold extraction buffer containing 50 mM Tris-HCl (pH 8), 150 mM NaCl, 1% NP40 and 1% Protease inhibitor, followed by centrifugation for 30 minutes at 9300 RCF at 4 °C. Protein concentration was determined using a standard BCA protocol. Emission absorbance values were detected with a λ = 560 nm excitation on a Synergy™ HT Multi-Detection Microplate Reader using KC4™ software (Bio-TekR Instruments Inc. Winooski, VT). Total protein (20 μg) was separated using 10% SDS-PAGE and electro-transfer of proteins from the gel to a nitrocellulose membrane was performed for 60 minutes at 100 V. The membranes were stained with Ponceau S to visualize the amount of total protein transferred in each lane. To reduce non-specific binding, membranes were pre-incubated overnight on a rocker at 4°C in a blocking buffer (5% non-fat dry milk, 5 M NaCl, 20 mM Tris-HCl, 0.15% Tween-20, pH 8). Membranes were probed using specific primary antibodies; Rabbit Anti-INSRα (1:500); Rabbit anti-GSTP (1:200); and mouse Anti-ACTB (1:2000) diluted in 5% non-fat dry milk in Tris-buffered saline with Tween-20 (TTBS) overnight at 4 °C. Following washing for three times (10 min each) in TTBS, membranes were incubated at room temperature for 1 hour with HRP-conjugated suitable secondary antibodies (1:2000) against the primary antibodies. Membranes were washed three times in TTBS followed by a single wash in Tris-Buffered Saline (TBS). Autoradiograms were visualized on X-ray films in a dark room following 5 min incubation of membranes in ECLplus chemiluminescence detecting reagent. Densitometry of the appropriate band was quantified using Image J software (NCBI). Equal loading was confirmed by Ponceau S staining of membranes and protein expression was normalized to ACTB densitometry values.
2.9. Immunoflourescence staining
Two slides per animal were deparaffinized in citrol buffer and rehydrated with subsequent washes in ethanol. Antigen retrieval was carried out by microwaving sections for 7 min in sodium citrate buffer (1M, pH 6.1). Sections were then blocked in 5% BSA for 1 h at room temperature. Sections were incubated with a primary antibody directed against pAKTSer473 (1:100) overnight at 4°C. After washing in 1% PBS, sections were incubated with a goat anti-rabbit secondary antibody conjugated to fluorescein for 1 h. Slides were counterstained with DAPI nuclear stain for 5 min. Images were taken using a Leica fluorescent microscope. Analysis of pAKTSer473 protein level in small oocytes (pre-antral follicles), large oocytes (antral follicles) and theca cells of antral follicles was performed using ImageJ software (NCBI). Mean densitometry value was divided by the cellular area measured.
2.10. Statistical analysis
Statistical analysis was performed using the unpaired t-test function of GraphPad Prism 5.5 software with a statistical significance level set at P < 0.05. P < 0.1 was considered a trend for a difference between treatments.
3. Results
3.1. Effect of obesity on ovarian size and weight
There was no impact of HFD on ovarian weight (P > 0.05) ovarian weight (Figure 1A) yet the ovaries appeared visually smaller relative to their lean littermates (Figure 1B and 1C).
Figure 1. Obesity does not alter ovarian weight in mice.

Six weeks old C57Bl/6J female mice (n = 6 per treatment group) were fed either a standard chow mice diet or a high-fat diet for approximately 7 months and were euthanized by CO2 asphyxiation. Ovaries were removed, trimmed of excess fat and weighed. (A) Ovarian weight; (B) lean and (C) obese ovarian sections stained with hematoxylin and eosin (H&E).
3.2. Effect of obesity on ovarian insulin signaling members
Obesity decreased mRNA level of the gene encoding the Irs1 (P < 0.05) with a trend for a decrease in Insr (P = 0.08; Figure 2A). Additionally there was a strong trend (P = 0.06) for decreased INSR protein levels in ovaries of obese female mice compared to lean mice (Figure 2B and 2C).
Figure 2. Obesity decreases ovarian Irs1 mRNA levels in mice.

Ovaries were removed from lean and obese mice (n = 6 per treatment group). (A) RNA was isolated and Insr and Irs1 mRNA levels were evaluated by quantitative RT-PCR. Values represent fold-change relative to a control value of 1 ± SE, normalized to Actb. (B) Total protein was isolated and Western blotting performed to measure INSR level. Values represent fold-change relative to a control value of 1 ± SE, normalized to ACTB. Different from control, *P < 0.05. (C) Representative Western blot for INSR and ACTB; Lean = L, Obese = O.
3.3. Effect of obesity on ovarian PI3K signaling
Relative to lean ovaries, obesity increased the mRNA levels of Kitlg by 0.6-fold (P < 0.05) and there was a trend for increased mRNA level of the KITLG receptor, c-Kit of 0.4-fold (P = 0.07; Figure 3). Obesity also induced a 1.1-fold increase (P < 0.05) in mRNA levels of Akt1, with a concomitant 0.6-fold decrease (P < 0.05) in mRNA levels of Foxo3a relative to lean ovaries (Figure 3). pAKTSer473 protein was localized to the oocyte of pre-antral and antral follicles and also to the theca cells (Figure 4A,B). Obese females had a strong trend (P = 0.056) for decreased pAKTSer473 protein in the oocytes of pre-antral follicles (Figure 4C), with no impact observed in the antral follicle oocytes (Figure 4D). Interestingly, there was a trend (P = 0.09) for increased pAKTSer473 protein in theca cells from obese females (Figure 4E).
Figure 3. Obesity enhances ovarian KITLG/KIT-PI3K/AKT1 signaling pathway in mice.
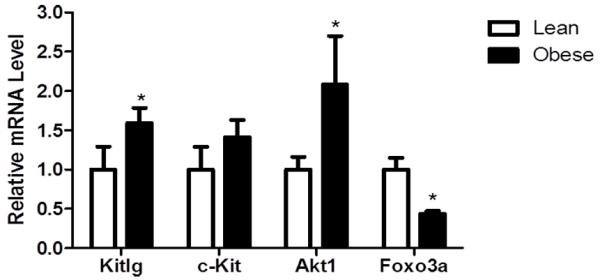
Ovaries were removed from lean and obese mice (n = 6 per treatment group). RNA was isolated and Kitlg, cKit, Akt1 and Foxo3a mRNA levels were evaluated by quantitative RT-PCR. Values represent fold-change relative to a control value of 1 ± SE, normalized to Actb. Different from control, *P < 0.05.
Figure 4. Altered pAKTSer473 levels are observed in the ovaries of obese mice.

Ovaries were removed from (A) lean and (B) obese mice, serially sectioned and mounted onto slides (n = 6 per treatment group). Immunoflourescence staining to detect pAKTSer473 was performed, with counterstaining to detect the nucleus. Image J software was used to quantify levels of pAKTSer473 in (C) small (pre-antral; indicated by arrowhead) and (D) large oocytes (antral; indicated by broken arrow) and (E) theca cells (indicated by unbroken arrow).
3.4. Effect of obesity on ovarian expressed xenobiotic metabolism genes
There was decreased mRNA level for the gene encoding Cyp2e1 (P < 0.05). In addition a trend (P < 0.1) for increased Ephx1 and decreased Gstp1 and Gstm1 mRNA levels was observed (Figure 5A). No impact of obesity on GSTM protein was observed, however, there was a trend for decreased GSTP protein level (P < 0.1).
Figure 5. Obesity down-regulates ovarian Cyp2e1 mRNA levels.

Ovaries were removed from lean and obese mice and RNA isolated (n = 6 per treatment group). (A) Cyp2e1, Ephx1, Gstp and Gstm mRNA levels were measured by quantitative RT-PCR. Values represent fold-change relative to a control value of 1 ± SE, normalized to Actb. Different from control, *P < 0.05. (B) Western blotting was performed to determine any impact of obesity on GSTP. (C) Representative Western blot for GSTP and ACTB; Lean = L, Obese = O.
3.5. Effect of obesity on ovarian expression of miR-103, miR-21, miR-184 and miR-205
Ovaries from obese mice had decreased (P < 0.05) miR-21, and miR-103 (P < 0.05), with a strong trend (P = 0.06) for increased miR-205. In contrast, obesity up-regulated (P < 0.05) miR-184 levels (Figure 6A). The obesity-induced decrease in miR-21 was validated using qRT-PCR (P < 0.05; Figure 6B).
Figure 6. Obesity alters levels of ovarian miR.
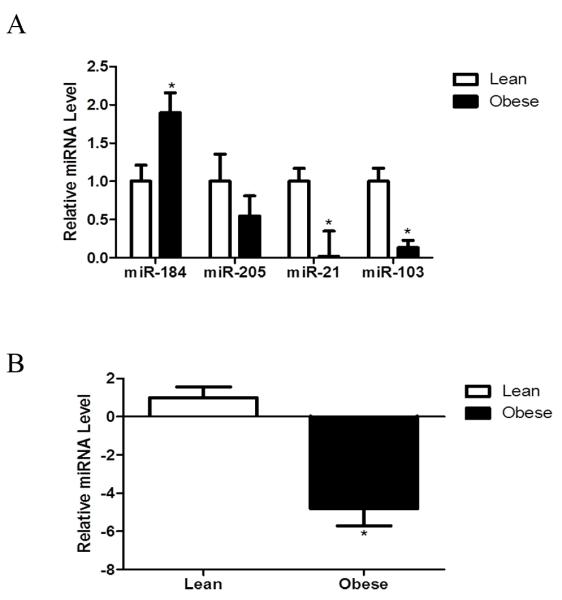
Ovaries were removed from lean and obese mice and RNA isolated (n = 3 per treatment group). (A) Enriched miR fractions were analyzed using a miR array. (B) qRT-PCR was performed on miR-21 to confirm the array data. Values represent fold-change relative to a control value of 1 ± SE, normalized to RAU43. Different from control, *P < 0.05.
4. Discussion
Several studies have highlighted a strong correlation between obesity, infertility and adverse reproductive health outcomes, however, the underlying mechanisms remain unclear [91-95], thus comprehension of the mechanisms by which obesity affects ovarian function is of significant relevance. We hypothesized that obesity could alter factors regulating both primordial follicular activation and xenobiotic biotransformation. The females in this study were approximately 8.5 months of age, and did not differ in levels of plasma estradiol [90].
Previous studies in humans and rat models have reported that hyperinsulinemia down-regulates ovarian Insr expression [96, 97]. Similar studies in insulin-resistant and hyperinsulinemic mice demonstrated altered duration of estrous cycles as well as aberrant distribution and morphology of ovarian follicles [42, 49, 98]. The metabolic effects of insulin mainly involve tissue-specific actions which result in changes in gene expression, protein phosphorylation and function of the INSR and its downstream adaptor proteins, IRS1-4 [99]. Phosphorylation of IRSs lead to activation of downstream mediators including the PI3K/AKT serine/threonine kinase [50]. There are several pathological effects associated with dysregulated PI3K pathway in the ovary. For instance, over activation of PI3K in oocytes has been associated with premature ovarian failure (POF), while, on the other hand, over activation of the pathway in granulosa cells is highly correlated with defects in follicle cyclic recruitment and ovulation and carcinogenesis derived from ovarian surface epithelium [29-31, 37, 58, 100].
In order to determine the molecular effects of obesity on ovarian function, we first investigated the effect of obesity on expression of genes encoding the insulin signaling members, INSR and IRS1, both of which are critical for the response to insulin. Obesity decreased the mRNA level of Irs1 concomitant with a trend for a reduction in total ovarian Insr mRNA and protein expression. The effect of obesity on expression of insulin signaling members in other tissues is well reported but most ovarian studies have reported inconsistent results. For instance consistent with our findings, reductions in expression of INSR and IRS1 during obesity [101-103] or hyperinsulinemia [96, 97] have been reported, while in contrast, increased phosphorylation of both IRS1 and IRS2 with obesity have been also observed in other cell types [45, 96, 104-107]. Additionally, other studies have observed no effect of obesity on INSR [3, 42] or IRS1 [3, 108, 109]. Taken together, these results implicate the effect of obesity on insulin signaling members to be a complex mechanism that may be species-, tissue- and/or time-specific.
Following these observations we postulated the insulin-mediated PI3K/AKT pathway could be compromised. To our surprise our results demonstrated that reduction in mRNA encoding insulin signaling factors did not inactivate the PI3K/AKT pathway in ovaries of obese mice. Obese mice had increased Akt1 mRNA levels with a concomitant decrease in Foxo3a mRNA compared to lean mice. Several other studies show that insulin could have a tissue-isoform and species specific differential effect on Akt isoforms [53, 110]. In obese rodent models, insulin-stimulated AKT1 activity was reported to decrease in muscle and adipose tissue but increased in liver, in contrast, AKT2 activity was decreased in muscle and liver but increased in adipose tissue [53]. Thus, our data indicate that ovarian AKT1 responds in a similar fashion to hepatic tissue in the face of changing insulin levels. Whether these changes are direct interactions between the IRS or involve other signaling mediators is difficult to surmise from the current data.
Since obesity mildly reduced expression of Insr and Irs1 in mice ovaries while the PI3K signaling pathway is markedly up-regulated compared to lean mice in our study, we asked what other insulin-independent pathways involved in activation of the ovarian PI3K/AKT pathway were altered in the obese mouse ovary. Stem cell growth factor receptor (c-KIT), a receptor protein tyrosine kinase is expressed by the oocyte [111, 112] and its ligand, Kit Ligand (KITLG; also called Stem cell factor or Steel factor), is expressed by granulosa cells [113]. Several lines of evidence have indicated that KITLG/c-KIT signaling is essential for oocyte viability and survival and that this pro-survival pathway also regulates follicle recruitment [114-116]. Once c-KIT is bound by KITLG the PI3K pathway is activated [36-38, 55, 56, 59]. Based on those previous reports and our data we asked if HFD-induced obesity affected the ovarian mRNA level of genes encoding c-KIT and KITLG. Our data shows that obesity increased Kitlg mRNA levels with a trend for increased mRNA encoding its receptor, c-Kit. To the best of our knowledge this is the first study to demonstrate that HFD-induced obesity can alter the expression of the c-Kit ligand in murine ovaries. In oocytes of cultured neonatal mouse and rat ovaries, it has been demonstrated that KITLG leads to phosphorylation of FOXO3a through the action of pAKT [36]. Based on the results presented herein hyperactivation of KITLG/c-KIT-PI3K/AKT could be a potential mechanism underlying obesity related infertility problems. It is known that hyperstimulation of primordial follicles into the growing follicular pool leads to their eventual destruction [55, 57, 59]. Over-activation of the KITLG/c-KIT dependent PI3K/AKT pathway could imply that in obese female mice, there is over stimulation of primordial follicles into the growing follicular pool; a scenario that could accelerate the rate at which mice become infertile, although it should be noted that follicle numbers were not classified in our study. Interestingly, we also noted a trend for increased theca cell pAKTSer473, and it is known that the interaction between KITLG and c-KIT has a regulatory role in steroidogenesis in rat granulosa cells [117].
Several studies have demonstrated that insulin and other growth factors regulate xenobiotic chemical metabolizing enzyme gene expression, including cytochromes p450, GSTs and EPHX1 through several kinases including PI3K/AKT signaling pathway [66, 118, 119]. The ovary has the capacity to metabolize ovotoxic compounds [60, 67, 68, 75, 76, 120-122], however to date, there is a dearth of literature examining potential effects of obesity on expression of xenobiotic metabolizing enzymes in the ovary. Since diet-induced obesity can alter insulin levels and/or sensitivity, we hypothesized that obesity may alter the ovarian expression of ovotoxicant metabolizing enzymes genes. Previous studies have demonstrated that diabetes is strongly associated with increased hepatic Cyp2e1 [123] and on the other hand decreased Ephx1 [124]. Also, Cyp2e1 mRNA expression is decreased in a dose dependent manner by insulin in rat cultured hepatocytes [123, 125, 126]. PI3K inhibitors such as wortmannin and LY294002 were shown to reverse the insulin-mediated down-regulation of Cyp2e1 mRNA levels [127]. Furthermore, in cultured neonatal ovaries, inhibition of PI3K signaling using LY294002 resulted in increased mRNA and protein levels of Ephx1, Gstp and Gstm [67-69]. In the present study decreased mRNA encoding Cyp2e1 was observed in ovaries of obese mice compared to the lean mice. In contrast to Cyp2e1, there was a trend for increased Ephx1 mRNA level. This differential effect of a physiological paradigm on ovarian Cyp2e1 and Ephx1 expression has been previously reported [76, 128]. Studies on the GSTs have reported both increased and decreased gene expression during diabetes [66]. In rat cultured hepatocytes, neither insulin nor glucagon affected the mRNA levels of Gstm while, on the other hand, glucagon reduced Gstp mRNA levels [129]. In the current study there was a trend for decreased Gstp mRNA and protein level in the obese ovary. These results suggest that obese females may have altered xenobiotic metabolism and therefore if such females are exposed to ovotoxicants, the rate at which they would approach premature ovarian insufficiency and failure would be accelerated. Further still, these results suggest that obese females may have increased risks from exposure to carcinogens and teratogens which could also potentially explain the increased rates of miscarriage and increased offspring birth defects in obese mothers.
PI3K signaling can be regulated through posttranscriptional gene silencing by the action of miRs [78, 80, 89, 130]. In order to evaluate if obesity had any effect on miR’s that could at least partially explain the effects observed on PI3K signaling, levels of miR-103, miR-21, miR-184 and miR-205 were measured. It was found that the ovaries from obese mice had decreased miR-21 and miR-103; however, miR-184 levels were increased. Recent reports have indicated that miR-21 expression is important for regulation of apoptosis [131, 132]. Decreased expression of miR-21 expression has been reported to increase cell apoptosis in a variety of cell culture systems including the granulosa cells from mouse pre-ovulatory follicles both in vivo and in vitro [86]. In addition, miR-21 has been identified as promoting follicular cell survival during ovulation and miR-21 inhibition also has been reported to reduce ovulatory rates [86]. Although many different cell types undergo apoptosis in response to inhibition of miR-21 action, the miR-21 targets implicated vary widely for different cells and the mechanism by which miR-21 suppresses apoptosis in GCs remain to be identified [133-135].
miR-184 has been shown to act as a physiological suppressor of general secretory activity of progesterone and estradiol [135, 136]. Additionally, miR-184 is believed to play a critical role in development as well as being a mediator of apoptosis. Up-regulation of miR-184 has been reported to interfere with the ability of miR-205 to lead to repression of AKT signaling [78]. Though in this study we observed an elevated level of miR-184 with a trend for a decrease in miR-205 level, there was an up-regulation of Akt1 mRNA levels together with a subsequent decrease in Foxo3a mRNA levels thus indicating that Akt1 activation is not being compromised by miR-205 action. Several studies from both human and rodent models have reported that miR-103 is up-regulated during obesity [89, 137, 138]. It has been further suggested that silencing miR-103 improves insulin sensitivity in adipocytes mainly through increased caveolin-1 expression, which in turn leads to stabilization of the INSR and thus enhancing insulin signaling [89]. In contrast to the above reports miR-103 expression has also been found to be down-regulated in the mouse model of genetic insulin resistance and obesity (ob/ob mice) [139]. This is consistent with our findings, where obesity decreased miR-103 levels in mice ovaries. These results further confirm miRNA cell and tissue specific actions [140].
5. Conclusions
In summary, the data presented herein, though preliminary in nature, demonstrate perturbations to ovarian PI3K signaling caused by obesity in females. Under basal conditions, AKT1 is positively regulated by both KITLG and IRS1. In addition, AKT1 is positively regulated by miR21 and negatively regulated by miR184. Our data collectively indicates that obesity decreases IRS1 levels but increases KITLG which can then result in increased AKT1 levels. Although miR21 is decreased, which should result in decreased AKT1, we propose that increased levels of miR184 may counteract decreased miR21 to result in AKT1 activation (summarized in Figure 7). One consequence of obesity-induced altered PI3K includes changes in the downstream components Akt1 and Foxo3a that may alter the rate of primordial follicle activation, leading to fertility problems. Another result of altered PI3K observed is that expression of major xenobiotic biotransformation enzymes that are important in the ovarian response to ovotoxicant exposure, are changed. Thus, obesity may have negative consequences for follicle activation and oocyte viability, as well as altering how the ovary responds to chemical exposures. All of these scenarios can lead to impairment of ovarian function, and may at least partially explain why reproduction is compromised in obese females.
Figure 7. Proposed model of obesity effects on AKT1 signalinga.
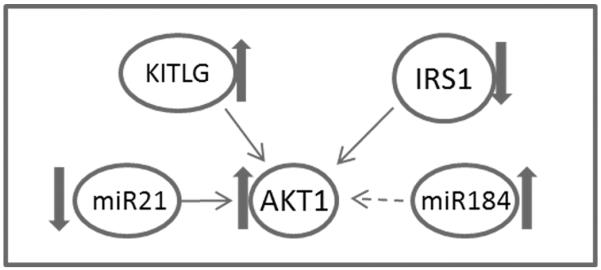
Under basal conditions, AKT1 is positively regulated by both KITLG and IRS1. In addition, AKT1 is positively regulated by miR21 and negatively regulated by miR184. Our data indicates that obesity decreases IRS1 levels but increases KITLG leading to increased AKT1 levels. The increased levels of miR184 may counteract the decreased miR21 in AKT1 activation. AKT regulates xenobiotic metabolism, primordial follicle activation and viability as well as ovarian steroidogenesis. Thin arrows indicate positive regulation, negative regulation is indicated by the broken arrow. Block arrows indicate the impact of obesity.
Highlights.
High fat feeding increased phosphatidylinositol-3 kinase signaling
Obese mice had altered xenobiotic metabolism gene expression
Obesity induced altered microRNA expression
Acknowledgements
The project described was supported by the National Institutes of Environmental Health Sciences [R00ES016818] to A.F.K. The content is solely the responsibility of the authors and does not necessarily represent the official views of the National Institute of Environmental Health Sciences or the National Institutes of Health.
Footnotes
Publisher's Disclaimer: This is a PDF file of an unedited manuscript that has been accepted for publication. As a service to our customers we are providing this early version of the manuscript. The manuscript will undergo copyediting, typesetting, and review of the resulting proof before it is published in its final citable form. Please note that during the production process errors may be discovered which could affect the content, and all legal disclaimers that apply to the journal pertain.
References
- [1].Finkelstein EA, Trogdon JG, Cohen JW, Dietz W. Annual medical spending attributable to obesity: payer- and service-specific estimates. Health Aff (Millwood) 2009;28:w822–831. doi: 10.1377/hlthaff.28.5.w822. [DOI] [PubMed] [Google Scholar]
- [2].Fatani S, Itua I, Clark P, Wong C, Naderali EK. The effects of diet-induced obesity on hepatocyte insulin signaling pathways and induction of non-alcoholic liver damage. Int J Gen Med. 2011;4:211–219. doi: 10.2147/IJGM.S17376. [DOI] [PMC free article] [PubMed] [Google Scholar]
- [3].Fatani S, Abubakari AR, Itua I, Wong C, Thomas C, Naderali EK. Effects of diet-induced obesity on protein expression in insulin signaling pathways of skeletal muscle in male Wistar rats. Int J Gen Med. 2012;5:573–582. doi: 10.2147/IJGM.S31819. [DOI] [PMC free article] [PubMed] [Google Scholar]
- [4].Maheshwari A, Stofberg L, Bhattacharya S. Effect of overweight and obesity on assisted reproductive technology--a systematic review. Hum Reprod Update. 2007;13:433–444. doi: 10.1093/humupd/dmm017. [DOI] [PubMed] [Google Scholar]
- [5].Devi S. Progress on childhood obesity patchy in the USA. Lancet. 2008;371:105–106. doi: 10.1016/S0140-6736(08)60088-4. [DOI] [PubMed] [Google Scholar]
- [6].Rubens CE, Gravett MG, Victora CG, Nunes TM, Group GR. Global report on preterm birth and stillbirth (7 of 7): mobilizing resources to accelerate innovative solutions (Global Action Agenda) BMC Pregnancy Childbirth. 2010;10(Suppl 1):S7. doi: 10.1186/1471-2393-10-S1-S7. [DOI] [PMC free article] [PubMed] [Google Scholar]
- [7].Carmichael SL, Rasmussen SA, Shaw GM. Prepregnancy obesity: a complex risk factor for selected birth defects. Birth Defects Res A Clin Mol Teratol. 2010;88:804–810. doi: 10.1002/bdra.20679. [DOI] [PubMed] [Google Scholar]
- [8].Blencowe H, Cousens S, Oestergaard MZ, et al. National, regional, and worldwide estimates of preterm birth rates in the year 2010 with time trends since 1990 for selected countries: a systematic analysis and implications. Lancet. 2012;379:2162–2172. doi: 10.1016/S0140-6736(12)60820-4. [DOI] [PubMed] [Google Scholar]
- [9].Lee WW. An overview of pediatric obesity. Pediatr Diabetes. 2007;8(Suppl 9):76–87. doi: 10.1111/j.1399-5448.2007.00337.x. [DOI] [PubMed] [Google Scholar]
- [10].Maclaren NK, Gujral S, Ten S, Motagheti R. Childhood obesity and insulin resistance. Cell Biochem Biophys. 2007;48:73–78. doi: 10.1007/s12013-007-0017-6. [DOI] [PubMed] [Google Scholar]
- [11].Baalwa J, Byarugaba BB, Kabagambe EK, Kabagambe KE, Otim AM. Prevalence of overweight and obesity in young adults in Uganda. Afr Health Sci. 2010;10:367–373. [PMC free article] [PubMed] [Google Scholar]
- [12].Hall V, Thomsen RW, Henriksen O, Lohse N. Diabetes in Sub Saharan Africa 1999-2011: epidemiology and public health implications. A systematic review. BMC Public Health. 2011;11:564. doi: 10.1186/1471-2458-11-564. [DOI] [PMC free article] [PubMed] [Google Scholar]
- [13].Peltzer K, Pengpid S. Overweight and obesity and associated factors among school-aged adolescents in Ghana and Uganda. Int J Environ Res Public Health. 2011;8:3859–3870. doi: 10.3390/ijerph8103859. [DOI] [PMC free article] [PubMed] [Google Scholar]
- [14].Hirshfield AN. Size-frequency analysis of atresia in cycling rats. Biol Reprod. 1988;38:1181–1188. doi: 10.1095/biolreprod38.5.1181. [DOI] [PubMed] [Google Scholar]
- [15].Hirshfield AN, Flickinger GL, Ben-Rafael Z. Flow cytofluorometric analysis of granulosa cell proliferation in rats. J Reprod Fertil. 1988;84:231–238. doi: 10.1530/jrf.0.0840231. [DOI] [PubMed] [Google Scholar]
- [16].Faddy MJ, Gosden RG. A model conforming the decline in follicle numbers to the age of menopause in women. Hum Reprod. 1996;11:1484–1486. doi: 10.1093/oxfordjournals.humrep.a019422. [DOI] [PubMed] [Google Scholar]
- [17].sueh AJ, McGee EA, Hayashi M, Hsu SY. Hormonal regulation of early follicle development in the rat ovary. Mol Cell Endocrinol. 2000;163:95–100. doi: 10.1016/s0303-7207(99)00245-2. [DOI] [PubMed] [Google Scholar]
- [18].McGee EA, Hsueh AJ. Initial and cyclic recruitment of ovarian follicles. Endocr Rev. 2000;21:200–214. doi: 10.1210/edrv.21.2.0394. [DOI] [PubMed] [Google Scholar]
- [19].Hansen KR, Knowlton NS, Thyer AC, Charleston JS, Soules MR, Klein NA. A new model of reproductive aging: the decline in ovarian non-growing follicle number from birth to menopause. Hum Reprod. 2008;23:699–708. doi: 10.1093/humrep/dem408. [DOI] [PubMed] [Google Scholar]
- [20].Hansen KR, Soules MR. Counting ovarian follicles is not without its challenges. Fertil Steril. 2008;89:1028–1029. doi: 10.1016/j.fertnstert.2008.01.023. author reply 1029. [DOI] [PubMed] [Google Scholar]
- [21].Coxworth JE, Hawkes K. Ovarian follicle loss in humans and mice: lessons from statistical model comparison. Hum Reprod. 2010;25:1796–1805. doi: 10.1093/humrep/deq136. [DOI] [PubMed] [Google Scholar]
- [22].Hoyer PB. Can the clock be turned back on ovarian aging? Sci Aging Knowledge Environ. 2004;2004:e11. doi: 10.1126/sageke.2004.10.pe11. [DOI] [PubMed] [Google Scholar]
- [23].Johnson J, Canning J, Kaneko T, Pru JK, Tilly JL. Germline stem cells and follicular renewal in the postnatal mammalian ovary. Nature. 2004;428:145–150. doi: 10.1038/nature02316. [DOI] [PubMed] [Google Scholar]
- [24].Johnson PA, Dickens MJ, Kent TR, Giles JR. Expression and function of growth differentiation factor-9 in an oviparous species, Gallus domesticus. Biol Reprod. 2005;72:1095–1100. doi: 10.1095/biolreprod.104.036822. [DOI] [PubMed] [Google Scholar]
- [25].Johnson JE, Higdon HL, Boone WR. Effect of human granulosa cell co-culture using standard culture media on the maturation and fertilization potential of immature human oocytes. Fertil Steril. 2008;90:1674–1679. doi: 10.1016/j.fertnstert.2007.06.017. [DOI] [PubMed] [Google Scholar]
- [26].Carabatsos MJ, Elvin J, Matzuk MM, Albertini DF. Characterization of oocyte and follicle development in growth differentiation factor-9-deficient mice. Dev Biol. 1998;204:373–384. doi: 10.1006/dbio.1998.9087. [DOI] [PubMed] [Google Scholar]
- [27].Elvin JA, Matzuk MM. Mouse models of ovarian failure. Rev Reprod. 1998;3:183–195. doi: 10.1530/ror.0.0030183. [DOI] [PubMed] [Google Scholar]
- [28].Adhikari D, Flohr G, Gorre N, et al. Disruption of Tsc2 in oocytes leads to overactivation of the entire pool of primordial follicles. Mol Hum Reprod. 2009;15:765–770. doi: 10.1093/molehr/gap092. [DOI] [PubMed] [Google Scholar]
- [29].Adhikari D, Liu K. Molecular mechanisms underlying the activation of mammalian primordial follicles. Endocr Rev. 2009;30:438–464. doi: 10.1210/er.2008-0048. [DOI] [PubMed] [Google Scholar]
- [30].Zheng W, Nagaraju G, Liu Z, Liu K. Functional roles of the phosphatidylinositol 3-kinases (PI3Ks) signaling in the mammalian ovary. Mol Cell Endocrinol. 2012;356:24–30. doi: 10.1016/j.mce.2011.05.027. [DOI] [PubMed] [Google Scholar]
- [31].Reddy P, Zheng W, Liu K. Mechanisms maintaining the dormancy and survival of mammalian primordial follicles. Trends Endocrinol Metab. 2010;21:96–103. doi: 10.1016/j.tem.2009.10.001. [DOI] [PubMed] [Google Scholar]
- [32].Jia L, Yi XF, Zhang ZB, et al. Prohibitin as a novel target protein of luteinizing hormone in ovarian epithelial carcinogenesis. Neoplasma. 2011;58:104–109. doi: 10.4149/neo_2011_02_104. [DOI] [PubMed] [Google Scholar]
- [33].Xu B, Hua J, Zhang Y, et al. Proliferating cell nuclear antigen (PCNA) regulates primordial follicle assembly by promoting apoptosis of oocytes in fetal and neonatal mouse ovaries. PLoS One. 2011;6:e16046. doi: 10.1371/journal.pone.0016046. [DOI] [PMC free article] [PubMed] [Google Scholar]
- [34].Peters H. Proceedings: Intra-uterine gonadal development. J Endocrinol. 1975;66:5P–6P. [PubMed] [Google Scholar]
- [35].Peters H, Byskov AG, Himelstein-Braw R, Faber M. Follicular growth: the basic event in the mouse and human ovary. J Reprod Fertil. 1975;45:559–566. doi: 10.1530/jrf.0.0450559. [DOI] [PubMed] [Google Scholar]
- [36].Reddy P, Shen L, Ren C, et al. Activation of Akt (PKB) and suppression of FKHRL1 in mouse and rat oocytes by stem cell factor during follicular activation and development. Dev Biol. 2005;281:160–170. doi: 10.1016/j.ydbio.2005.02.013. [DOI] [PubMed] [Google Scholar]
- [37].Reddy P, Liu L, Adhikari D, et al. Oocyte-specific deletion of Pten causes premature activation of the primordial follicle pool. Science. 2008;319:611–613. doi: 10.1126/science.1152257. [DOI] [PubMed] [Google Scholar]
- [38].Liu K, Rajareddy S, Liu L, et al. Control of mammalian oocyte growth and early follicular development by the oocyte PI3 kinase pathway: new roles for an old timer. Dev Biol. 2006;299:1–11. doi: 10.1016/j.ydbio.2006.07.038. [DOI] [PubMed] [Google Scholar]
- [39].Rachoń D, Teede H. Ovarian function and obesity--interrelationship, impact on women’s reproductive lifespan and treatment options. Mol Cell Endocrinol. 2010;316:172–179. doi: 10.1016/j.mce.2009.09.026. [DOI] [PubMed] [Google Scholar]
- [40].Brewer CJ, Balen AH. The adverse effects of obesity on conception and implantation. Reproduction. 2010;140:347–364. doi: 10.1530/REP-09-0568. [DOI] [PubMed] [Google Scholar]
- [41].Bellver J, Melo MA, Bosch E, Serra V, Remohí J, Pellicer A. Obesity and poor reproductive outcome: the potential role of the endometrium. Fertil Steril. 2007;88:446–451. doi: 10.1016/j.fertnstert.2006.11.162. [DOI] [PubMed] [Google Scholar]
- [42].Akamine EH, Marçal AC, Camporez JP, et al. Obesity induced by high-fat diet promotes insulin resistance in the ovary. J Endocrinol. 2010;206:65–74. doi: 10.1677/JOE-09-0461. [DOI] [PubMed] [Google Scholar]
- [43].Kalra A, Nair S, Rai L. Association of obesity and insulin resistance with dyslipidemia in Indian women with polycystic ovarian syndrome. Indian J Med Sci. 2006;60:447–453. [PubMed] [Google Scholar]
- [44].Kashyap SR, Defronzo RA. The insulin resistance syndrome: physiological considerations. Diab Vasc Dis Res. 2007;4:13–19. doi: 10.3132/dvdr.2007.001. [DOI] [PubMed] [Google Scholar]
- [45].Wu S, Divall S, Wondisford F, Wolfe A. Reproductive tissues maintain insulin sensitivity in diet-induced obesity. Diabetes. 2012;61:114–123. doi: 10.2337/db11-0956. [DOI] [PMC free article] [PubMed] [Google Scholar]
- [46].Kido Y, Nakae J, Accili D. The Insulin Receptor and Its Cellular Targets. Journal of Clinical Endocrinology & Metabolism. 2001;86:972–979. doi: 10.1210/jcem.86.3.7306. [DOI] [PubMed] [Google Scholar]
- [47].Sweet LJ, Morrison BD, Pessin JE. Isolation of functional alpha beta heterodimers from the purified human placental alpha 2 beta 2 heterotetrameric insulin receptor complex. A structural basis for insulin binding heterogeneity. Journal of Biological Chemistry. 1987;262:6939–6942. [PubMed] [Google Scholar]
- [48].Brüning JC, Gautam D, Burks DJ, et al. Role of brain insulin receptor in control of body weight and reproduction. Science. 2000;289:2122–2125. doi: 10.1126/science.289.5487.2122. [DOI] [PubMed] [Google Scholar]
- [49].Poretsky L, Cataldo NA, Rosenwaks Z, Giudice LC. The insulin-related ovarian regulatory system in health and disease. Endocr Rev. 1999;20:535–582. doi: 10.1210/edrv.20.4.0374. [DOI] [PubMed] [Google Scholar]
- [50].Choi K, Kim YB. Molecular mechanism of insulin resistance in obesity and type 2 diabetes. Korean J Intern Med. 2010;25:119–129. doi: 10.3904/kjim.2010.25.2.119. [DOI] [PMC free article] [PubMed] [Google Scholar]
- [51].Acosta-Martínez M. PI3K: An Attractive Candidate for the Central Integration of Metabolism and Reproduction. Front Endocrinol (Lausanne) 2011;2:110. doi: 10.3389/fendo.2011.00110. [DOI] [PMC free article] [PubMed] [Google Scholar]
- [52].Datta SR, Brunet A, Greenberg ME. Cellular survival: a play in three Akts. Genes Dev. 1999;13:2905–2927. doi: 10.1101/gad.13.22.2905. [DOI] [PubMed] [Google Scholar]
- [53].Kim YB, Peroni OD, Franke TF, Kahn BB. Divergent regulation of Akt1 and Akt2 isoforms in insulin target tissues of obese Zucker rats. Diabetes. 2000;49:847–856. doi: 10.2337/diabetes.49.5.847. [DOI] [PubMed] [Google Scholar]
- [54].Nicholson KM, Anderson NG. The protein kinase B/Akt signalling pathway in human malignancy. Cell Signal. 2002;14:381–395. doi: 10.1016/s0898-6568(01)00271-6. [DOI] [PubMed] [Google Scholar]
- [55].Castrillon DH, Miao L, Kollipara R, Horner JW, DePinho RA. Suppression of ovarian follicle activation in mice by the transcription factor Foxo3a. Science. 2003;301:215–218. doi: 10.1126/science.1086336. [DOI] [PubMed] [Google Scholar]
- [56].John GB, Gallardo TD, Shirley LJ, Castrillon DH. Foxo3 is a PI3K-dependent molecular switch controlling the initiation of oocyte growth. Dev Biol. 2008;321:197–204. doi: 10.1016/j.ydbio.2008.06.017. [DOI] [PMC free article] [PubMed] [Google Scholar]
- [57].Brown C, LaRocca J, Pietruska J, et al. Subfertility caused by altered follicular development and oocyte growth in female mice lacking PKB alpha/Akt1. Biol Reprod. 2010;82:246–256. doi: 10.1095/biolreprod.109.077925. [DOI] [PMC free article] [PubMed] [Google Scholar]
- [58].Jagarlamudi K, Liu L, Adhikari D, et al. Oocyte-specific deletion of Pten in mice reveals a stage-specific function of PTEN/PI3K signaling in oocytes in controlling follicular activation. PLoS One. 2009;4:e6186. doi: 10.1371/journal.pone.0006186. [DOI] [PMC free article] [PubMed] [Google Scholar]
- [59].Brenkman AB, Burgering BM. FoxO3a eggs on fertility and aging. Trends Mol Med. 2003;9:464–467. doi: 10.1016/j.molmed.2003.09.003. [DOI] [PubMed] [Google Scholar]
- [60].Keating AF, J Mark C, Sen N, Sipes IG, Hoyer PB. Effect of phosphatidylinositol-3 kinase inhibition on ovotoxicity caused by 4-vinylcyclohexene diepoxide and 7, 12-dimethylbenz[a]anthracene in neonatal rat ovaries. Toxicol Appl Pharmacol. 2009;241:127–134. doi: 10.1016/j.taap.2009.08.012. [DOI] [PMC free article] [PubMed] [Google Scholar]
- [61].Dijkers PF, Medema RH, Pals C, et al. Forkhead transcription factor FKHR-L1 modulates cytokine-dependent transcriptional regulation of p27(KIP1) Mol Cell Biol. 2000;20:9138–9148. doi: 10.1128/mcb.20.24.9138-9148.2000. [DOI] [PMC free article] [PubMed] [Google Scholar]
- [62].Gilley J, Coffer PJ, Ham J. FOXO transcription factors directly activate bim gene expression and promote apoptosis in sympathetic neurons. J Cell Biol. 2003;162:613–622. doi: 10.1083/jcb.200303026. [DOI] [PMC free article] [PubMed] [Google Scholar]
- [63].Yamamura Y, Lee WL, Inoue K, Ida H, Ito Y. RUNX3 cooperates with FoxO3a to induce apoptosis in gastric cancer cells. J Biol Chem. 2006;281:5267–5276. doi: 10.1074/jbc.M512151200. [DOI] [PubMed] [Google Scholar]
- [64].Smith GR, Shanley DP. Modelling the response of FOXO transcription factors to multiple post-translational modifications made by ageing-related signalling pathways. PLoS One. 2010;5:e11092. doi: 10.1371/journal.pone.0011092. [DOI] [PMC free article] [PubMed] [Google Scholar]
- [65].Liu L, Rajareddy S, Reddy P, et al. Infertility caused by retardation of follicular development in mice with oocyte-specific expression of Foxo3a. Development. 2007;134:199–209. doi: 10.1242/dev.02667. [DOI] [PubMed] [Google Scholar]
- [66].Kim SK, Novak RF. The role of intracellular signaling in insulin-mediated regulation of drug metabolizing enzyme gene and protein expression. Pharmacol Ther. 2007;113:88–120. doi: 10.1016/j.pharmthera.2006.07.004. [DOI] [PMC free article] [PubMed] [Google Scholar]
- [67].Bhattacharya P, Sen N, Hoyer PB, Keating AF. Ovarian expressed microsomal epoxide hydrolase: role in detoxification of 4-vinylcyclohexene diepoxide and regulation by phosphatidylinositol-3 kinase signaling. Toxicol Appl Pharmacol. 2012;258:118–123. doi: 10.1016/j.taap.2011.10.014. [DOI] [PMC free article] [PubMed] [Google Scholar]
- [68].Bhattacharya P, Keating AF. Protective role for ovarian glutathione S-transferase isoform pi during 7,12-dimethylbenz[a]anthracene-induced ovotoxicity. Toxicol Appl Pharmacol. 2012;260:201–208. doi: 10.1016/j.taap.2012.02.014. [DOI] [PMC free article] [PubMed] [Google Scholar]
- [69].Bhattacharya P, Madden JA, Sen N, Hoyer PB, Keating AF. Glutathione S-transferase class mu regulation of apoptosis signal-related kinase 1 protein during VCD-induced ovotoxicity in neonatal rat ovaries. Toxicol Appl Pharmacol. 2012 doi: 10.1016/j.taap.2012.12.013. [DOI] [PMC free article] [PubMed] [Google Scholar]
- [70].Sheehan D, Meade G, Foley VM, Dowd CA. Structure, function and evolution of glutathione transferases: implications for classification of non-mammalian members of an ancient enzyme superfamily. Biochem J. 2001;360:1–16. doi: 10.1042/0264-6021:3600001. [DOI] [PMC free article] [PubMed] [Google Scholar]
- [71].Hosagrahara VP, Rettie AE, Hassett C, Omiecinski CJ. Functional analysis of human microsomal epoxide hydrolase genetic variants. Chem Biol Interact. 2004;150:149–159. doi: 10.1016/j.cbi.2004.07.004. [DOI] [PMC free article] [PubMed] [Google Scholar]
- [72].Hennebold JD, Mah K, Perez W, et al. Identification and characterization of an ovary-selective isoform of epoxide hydrolase. Biol Reprod. 2005;72:968–975. doi: 10.1095/biolreprod.104.035899. [DOI] [PubMed] [Google Scholar]
- [73].Heck JE, Moore LE, Lee YC, et al. Xenobiotic metabolizing gene variants and renal cell cancer: a multicenter study. Front Oncol. 2012;2:16. doi: 10.3389/fonc.2012.00016. [DOI] [PMC free article] [PubMed] [Google Scholar]
- [74].Springer LN, Tilly JL, Sipes IG, Hoyer PB. Enhanced expression of bax in small preantral follicles during 4-vinylcyclohexene diepoxide-induced ovotoxicity in the rat. Toxicol Appl Pharmacol. 1996;139:402–410. doi: 10.1006/taap.1996.0181. [DOI] [PubMed] [Google Scholar]
- [75].Igawa Y, Keating AF, Rajapaksa KS, Sipes IG, Hoyer PB. Evaluation of ovotoxicity induced by 7, 12- dimethylbenz[a]anthracene and its 3,4-diol metabolite utilizing a rat in vitro ovarian culture system. Toxicol Appl Pharmacol. 2009;234:361–369. doi: 10.1016/j.taap.2008.10.009. [DOI] [PMC free article] [PubMed] [Google Scholar]
- [76].Keating AF, Rajapaksa KS, Sipes IG, Hoyer PB. Effect of CYP2E1 gene deletion in mice on expression of microsomal epoxide hydrolase in response to VCD exposure. Toxicol Sci. 2008;105:351–359. doi: 10.1093/toxsci/kfn136. [DOI] [PMC free article] [PubMed] [Google Scholar]
- [77].Rajapaksa KS, Sipes IG, Hoyer PB. involvement of microsomal epoxide hydrolase enzyme in ovotoxicity caused by 7,12-dimethylbenz[a]anthracene. Toxicol Sci. 2007;96:327–334. doi: 10.1093/toxsci/kfl202. [DOI] [PubMed] [Google Scholar]
- [78].Yu J, Ryan DG, Getsios S, Oliveira-Fernandes M, Fatima A, Lavker RM. MicroRNA-184 antagonizes microRNA-205 to maintain SHIP2 levels in epithelia. Proc Natl Acad Sci U S A. 2008;105:19300–19305. doi: 10.1073/pnas.0803992105. [DOI] [PMC free article] [PubMed] [Google Scholar]
- [79].Li P, Peng J, Hu J, Xu Z, Xie W, Yuan L. Localized expression pattern of miR-184 in Drosophila. Mol Biol Rep. 2011;38:355–358. doi: 10.1007/s11033-010-0115-1. [DOI] [PubMed] [Google Scholar]
- [80].Xu M, Mo YY. The Akt-associated microRNAs. Cell Mol Life Sci. 2012 doi: 10.1007/s00018-012-1129-8. [DOI] [PMC free article] [PubMed] [Google Scholar]
- [81].Fire A, Xu S, Montgomery MK, Kostas SA, Driver SE, Mello CC. Potent and specific genetic interference by double-stranded RNA in Caenorhabditis elegans. Nature. 1998;391:806–811. doi: 10.1038/35888. [DOI] [PubMed] [Google Scholar]
- [82].Bartel DP. MicroRNAs: genomics, biogenesis, mechanism, and function. Cell. 2004;116:281–297. doi: 10.1016/s0092-8674(04)00045-5. [DOI] [PubMed] [Google Scholar]
- [83].Hwang HW, Mendell JT. MicroRNAs in cell proliferation, cell death, and tumorigenesis. Br J Cancer. 2007;96Suppl:R40–44. [PubMed] [Google Scholar]
- [84].Williams AH, Liu N, van Rooij E, Olson EN. MicroRNA control of muscle development and disease. Curr Opin Cell Biol. 2009;21:461–469. doi: 10.1016/j.ceb.2009.01.029. [DOI] [PMC free article] [PubMed] [Google Scholar]
- [85].Baley J, Li J. MicroRNAs and ovarian function. J Ovarian Res. 2012;5:8. doi: 10.1186/1757-2215-5-8. [DOI] [PMC free article] [PubMed] [Google Scholar]
- [86].Carletti MZ, Fiedler SD, Christenson LK. MicroRNA 21 blocks apoptosis in mouse periovulatory granulosa cells. Biol Reprod. 2010;83:286–295. doi: 10.1095/biolreprod.109.081448. [DOI] [PMC free article] [PubMed] [Google Scholar]
- [87].Ling HY, Hu B, Hu XB, et al. MiRNA-21 Reverses High Glucose and High Insulin Induced Insulin Resistance in 3T3-L1 Adipocytes through Targeting Phosphatase and Tensin Homologue. Exp Clin Endocrinol Diabetes. 2012;120:553–559. doi: 10.1055/s-0032-1311644. [DOI] [PubMed] [Google Scholar]
- [88].Christenson LK. MicroRNA control of ovarian function. Anim Reprod. 2010;7:129–133. [PMC free article] [PubMed] [Google Scholar]
- [89].Trajkovski M, Hausser J, Soutschek J, et al. MicroRNAs 103 and 107 regulate insulin sensitivity. Nature. 2011;474:649–653. doi: 10.1038/nature10112. [DOI] [PubMed] [Google Scholar]
- [90].Nickelson KJ, Stromsdorfer KL, Pickering RT, et al. A comparison of inflammatory and oxidative stress markers in adipose tissue from weight-matched obese male and female mice. Exp Diabetes Res. 2012;2012:859395. doi: 10.1155/2012/859395. [DOI] [PMC free article] [PubMed] [Google Scholar]
- [91].Ogbuji QC. Obesity and reproductive performance in women. Afr J Reprod Health. 2010;14:143–151. [PubMed] [Google Scholar]
- [92].Nestler JE. Obesity, insulin, sex steroids and ovulation. Int J Obes Relat Metab Disord. 2000;24(Suppl 2):S71–73. doi: 10.1038/sj.ijo.0801282. [DOI] [PubMed] [Google Scholar]
- [93].Pasquali R, Pelusi C, Genghini S, Cacciari M, Gambineri A. Obesity and reproductive disorders in women. Hum Reprod Update. 2003;9:359–372. doi: 10.1093/humupd/dmg024. [DOI] [PubMed] [Google Scholar]
- [94].Pasquali R, Gambineri A. Metabolic effects of obesity on reproduction. Reprod Biomed Online. 2006;12:542–551. doi: 10.1016/s1472-6483(10)61179-0. [DOI] [PubMed] [Google Scholar]
- [95].Pettigrew R, Hamilton-Fairley D. Obesity and female reproductive function. Br Med Bull. 1997;53:341–358. doi: 10.1093/oxfordjournals.bmb.a011617. [DOI] [PubMed] [Google Scholar]
- [96].Poretsky L, Bhargava G, Kalin MF, Wolf SA. Regulation of insulin receptors in the human ovary: in vitro studies. J Clin Endocrinol Metab. 1988;67:774–778. doi: 10.1210/jcem-67-4-774. [DOI] [PubMed] [Google Scholar]
- [97].Poretsky L, Glover B, Laumas V, Kalin M, Dunaif A. The effects of experimental hyperinsulinemia on steroid secretion, ovarian [125I]insulin binding, and ovarian [125I]insuli n-like growth-factor I binding in the rat. Endocrinology. 1988;122:581–585. doi: 10.1210/endo-122-2-581. [DOI] [PubMed] [Google Scholar]
- [98].Nandi A, Wang X, Accili D, Wolgemuth DJ. The effect of insulin signaling on female reproductive function independent of adiposity and hyperglycemia. Endocrinology. 2010;151:1863–1871. doi: 10.1210/en.2009-0788. [DOI] [PMC free article] [PubMed] [Google Scholar]
- [99].Singla P, Bardoloi A, Parkash AA. Metabolic effects of obesity: A review. World J Diabetes. 2010;1:76–88. doi: 10.4239/wjd.v1.i3.76. [DOI] [PMC free article] [PubMed] [Google Scholar]
- [100].Fan HY, Liu Z, Cahill N, Richards JS. Targeted disruption of Pten in ovarian granulosa cells enhances ovulation and extends the life span of luteal cells. Mol Endocrinol. 2008;22:2128–2140. doi: 10.1210/me.2008-0095. [DOI] [PMC free article] [PubMed] [Google Scholar]
- [101].Catalano PM, Nizielski SE, Shao J, Preston L, Qiao L, Friedman JE. Downregulated IRS-1 and PPARgamma in obese women with gestational diabetes: relationship to FFA during pregnancy. Am J Physiol Endocrinol Metab. 2002;282:E522–533. doi: 10.1152/ajpendo.00124.2001. [DOI] [PubMed] [Google Scholar]
- [102].Shirakami A, Toyonaga T, Tsuruzoe K, et al. Heterozygous knockout of the IRS-1 gene in mice enhances obesity-linked insulin resistance: a possible model for the development of type 2 diabetes. J Endocrinol. 2002;174:309–319. doi: 10.1677/joe.0.1740309. [DOI] [PubMed] [Google Scholar]
- [103].Shao J, Catalano PM, Yamashita H, Ishizuka T, Friedman JE. Vanadate enhances but does not normalize glucose transport and insulin receptor phosphorylation in skeletal muscle from obese women with gestational diabetes mellitus. Am J Obstet Gynecol. 2000;183:1263–1270. doi: 10.1067/mob.2000.106816. [DOI] [PubMed] [Google Scholar]
- [104].Kim YB, Kotani K, Ciaraldi TP, Henry RR, Kahn BB. Insulin-stimulated protein kinase C lambda/zeta activity is reduced in skeletal muscle of humans with obesity and type 2 diabetes: reversal with weight reduction. Diabetes. 2003;52:1935–1942. doi: 10.2337/diabetes.52.8.1935. [DOI] [PubMed] [Google Scholar]
- [105].Kim SK, Woodcroft KJ, Kim SG, Novak RF. Insulin and glucagon signaling in regulation of microsomal epoxide hydrolase expression in primary cultured rat hepatocytes. Drug Metab Dispos. 2003;31:1260–1268. doi: 10.1124/dmd.31.10.1260. [DOI] [PubMed] [Google Scholar]
- [106].Farese RV, Sajan MP, Standaert ML. Insulin-sensitive protein kinases (atypical protein kinase C and protein kinase B/Akt): actions and defects in obesity and type II diabetes. Exp Biol Med (Maywood) 2005;230:593–605. doi: 10.1177/153537020523000901. [DOI] [PubMed] [Google Scholar]
- [107].Rondinone CM, Wang LM, Lonnroth P, Wesslau C, Pierce JH, Smith U. Insulin receptor substrate (IRS) 1 is reduced and IRS-2 is the main docking protein for phosphatidylinositol 3-kinase in adipocytes from subjects with non-insulin-dependent diabetes mellitus. Proc Natl Acad Sci U S A. 1997;94:4171–4175. doi: 10.1073/pnas.94.8.4171. [DOI] [PMC free article] [PubMed] [Google Scholar]
- [108].Kim YB, Zhu JS, Zierath JR, Shen HQ, Baron AD, Kahn BB. Glucosamine infusion in rats rapidly impairs insulin stimulation of phosphoinositide 3-kinase but does not alter activation of Akt/protein kinase B in skeletal muscle. Diabetes. 1999;48:310–320. doi: 10.2337/diabetes.48.2.310. [DOI] [PubMed] [Google Scholar]
- [109].Kim YB, Nikoulina SE, Ciaraldi TP, Henry RR, Kahn BB. Normal insulin-dependent activation of Akt/protein kinase B, with diminished activation of phosphoinositide 3-kinase, in muscle in type 2 diabetes. J Clin Invest. 1999;104:733–741. doi: 10.1172/JCI6928. [DOI] [PMC free article] [PubMed] [Google Scholar]
- [110].Walker KS, Deak M, Paterson A, Hudson K, Cohen P, Alessi DR. Activation of protein kinase B beta and gamma isoforms by insulin in vivo and by 3-phosphoinositide-dependent protein kinase-1 in vitro: comparison with protein kinase B alpha. Biochem J. 1998;331(Pt 1):299–308. doi: 10.1042/bj3310299. [DOI] [PMC free article] [PubMed] [Google Scholar]
- [111].Horie K, Takakura K, Taii S, et al. The expression of c-kit protein during oogenesis and early embryonic development. Biol Reprod. 1991;45:547–552. doi: 10.1095/biolreprod45.4.547. [DOI] [PubMed] [Google Scholar]
- [112].Manova K, Nocka K, Besmer P, Bachvarova RF. Gonadal expression of c-kit encoded at the W locus of the mouse. Development. 1990;110:1057–1069. doi: 10.1242/dev.110.4.1057. [DOI] [PubMed] [Google Scholar]
- [113].Ismail RS, Okawara Y, Fryer JN, Vanderhyden BC. Hormonal regulation of the ligand for c-kit in the rat ovary and its effects on spontaneous oocyte meiotic maturation. Mol Reprod Dev. 1996;43:458–469. doi: 10.1002/(SICI)1098-2795(199604)43:4<458::AID-MRD8>3.0.CO;2-O. [DOI] [PubMed] [Google Scholar]
- [114].Parrott JA, Skinner MK. Kit-ligand/stem cell factor induces primordial follicle development and initiates folliculogenesis. Endocrinology. 1999;140:4262–4271. doi: 10.1210/endo.140.9.6994. [DOI] [PubMed] [Google Scholar]
- [115].Parrott JA, Skinner MK. Kit ligand actions on ovarian stromal cells: effects on theca cell recruitment and steroid production. Mol Reprod Dev. 2000;55:55–64. doi: 10.1002/(SICI)1098-2795(200001)55:1<55::AID-MRD8>3.0.CO;2-L. [DOI] [PubMed] [Google Scholar]
- [116].Yoshida H, Takakura N, Kataoka H, Kunisada T, Okamura H, Nishikawa SI. Stepwise requirement of c-kit tyrosine kinase in mouse ovarian follicle development. Dev Biol. 1997;184:122–137. doi: 10.1006/dbio.1997.8503. [DOI] [PubMed] [Google Scholar]
- [117].Miyoshi T, Otsuka F, Nakamura E, et al. Regulatory role of kit ligand-c-kit interaction and oocyte factors in steroidogenesis by rat granulosa cells. Molecular and Cellular Endocrinology. 2012;358:18–26. doi: 10.1016/j.mce.2012.02.011. [DOI] [PubMed] [Google Scholar]
- [118].Zong H, Armoni M, Harel C, Karnieli E, Pessin JE. Cytochrome P-450 CYP2E1 knockout mice are protected against high-fat diet-induced obesity and insulin resistance. Am J Physiol Endocrinol Metab. 2012;302:E532–539. doi: 10.1152/ajpendo.00258.2011. [DOI] [PMC free article] [PubMed] [Google Scholar]
- [119].Thompson KJ, Swan RZ, Iannitti DA, McKillop IH, Sindram D. Diet-induced obesity and ethanol impair progression of hepatocellular carcinoma in a mouse mesenteric vein injection model. Surg Endosc. 2012 doi: 10.1007/s00464-012-2429-7. [DOI] [PubMed] [Google Scholar]
- [120].Bhattacharya P, Keating AF. Impact of environmental exposures on ovarian function and role of xenobiotic metabolism during ovotoxicity. Toxicol Appl Pharmacol. 2012;261:227–235. doi: 10.1016/j.taap.2012.04.009. [DOI] [PMC free article] [PubMed] [Google Scholar]
- [121].Keating AF, Sen N, Sipes IG, Hoyer PB. Dual protective role for glutathione S-transferase class pi against VCD-induced ovotoxicity in the rat ovary. Toxicol Appl Pharmacol. 2010;247:71–75. doi: 10.1016/j.taap.2010.06.002. [DOI] [PMC free article] [PubMed] [Google Scholar]
- [122].Fernandez SM, Keating AF, Christian PJ, et al. Involvement of the KIT/KITL signaling pathway in 4-vinylcyclohexene diepoxide-induced ovarian follicle loss in rats. Biol Reprod. 2008;79:318–327. doi: 10.1095/biolreprod.108.067744. [DOI] [PMC free article] [PubMed] [Google Scholar]
- [123].Woodcroft KJ, Novak RF. The role of phosphatidylinositol 3-kinase, Src kinase, and protein kinase A signaling pathways in insulin and glucagon regulation of CYP2E1 expression. Biochem Biophys Res Commun. 1999;266:304–307. doi: 10.1006/bbrc.1999.1817. [DOI] [PubMed] [Google Scholar]
- [124].Thomas H, Schladt L, Knehr M, Oesch F. Effect of diabetes and starvation on the activity of rat liver epoxide hydrolases, glutathione S-transferases and peroxisomal beta-oxidation. Biochem Pharmacol. 1989;38:4291–4297. doi: 10.1016/0006-2952(89)90528-5. [DOI] [PubMed] [Google Scholar]
- [125].Woodcroft KJ, Novak RF. Insulin effects on CYP2E1, 2B, 3A, and 4A expression in primary cultured rat hepatocytes. Chem Biol Interact. 1997;107:75–91. doi: 10.1016/s0009-2797(97)00075-6. [DOI] [PubMed] [Google Scholar]
- [126].Bellward GD, Chang T, Rodrigues B, et al. Hepatic cytochrome P-450j induction in the spontaneously diabetic BB rat. Mol Pharmacol. 1988;33:140–143. [PubMed] [Google Scholar]
- [127].Woodcroft KJ, Hafner MS, Novak RF. Insulin signaling in the transcriptional and posttranscriptional regulation of CYP2E1 expression. Hepatology. 2002;35:263–273. doi: 10.1053/jhep.2002.30691. [DOI] [PubMed] [Google Scholar]
- [128].Keating AF, Sipes IG, Hoyer PB. Expression of ovarian microsomal epoxide hydrolase and glutathione S-transferase during onset of VCD-induced ovotoxicity in B6C3F(1) mice. Toxicol Appl Pharmacol. 2008;230:109–116. doi: 10.1016/j.taap.2008.02.016. [DOI] [PMC free article] [PubMed] [Google Scholar]
- [129].Kim SK, Woodcroft KJ, Novak RF. Insulin and glucagon regulation of glutathione S-transferase expression in primary cultured rat hepatocytes. J Pharmacol Exp Ther. 2003;305:353–361. doi: 10.1124/jpet.102.045153. [DOI] [PubMed] [Google Scholar]
- [130].Näär AM. MiRs with a sweet tooth. Cell Metab. 2011;14:149–150. doi: 10.1016/j.cmet.2011.07.005. [DOI] [PMC free article] [PubMed] [Google Scholar]
- [131].Donadeu FX, Schauer S, Sontakke S. Involvement of miRNAs in ovarian follicular and luteal development. J Endocrinol. 2012 doi: 10.1530/JOE-12-0252. [DOI] [PubMed] [Google Scholar]
- [132].McBride D, Carré W, Sontakke SD, et al. Identification of miRNAs associated with the follicular-luteal transition in the ruminant ovary. Reproduction. 2012;144:221–233. doi: 10.1530/REP-12-0025. [DOI] [PubMed] [Google Scholar]
- [133].Yang H, Kong W, He L, et al. MicroRNA expression profiling in human ovarian cancer: miR-214 induces cell survival and cisplatin resistance by targeting PTEN. Cancer Res. 2008;68:425–433. doi: 10.1158/0008-5472.CAN-07-2488. [DOI] [PubMed] [Google Scholar]
- [134].Kim YJ, Hwang SH, Cho HH, Shin KK, Bae YC, Jung JS. MicroRNA 21 regulates the proliferation of human adipose tissue-derived mesenchymal stem cells and high-fat diet-induced obesity alters microRNA 21 expression in white adipose tissues. J Cell Physiol. 2012;227:183–193. doi: 10.1002/jcp.22716. [DOI] [PubMed] [Google Scholar]
- [135].Sirotkin AV, Lauková M, Ovcharenko D, Brenaut P, Mlyncek M. Identification of microRNAs controlling human ovarian cell proliferation and apoptosis. J Cell Physiol. 2010;223:49–56. doi: 10.1002/jcp.21999. [DOI] [PubMed] [Google Scholar]
- [136].Sirotkin AV, Ovcharenko D, Grossmann R, Lauková M, Mlyncek M. Identification of microRNAs controlling human ovarian cell steroidogenesis via a genome-scale screen. J Cell Physiol. 2009;219:415–420. doi: 10.1002/jcp.21689. [DOI] [PubMed] [Google Scholar]
- [137].Rottiers V, Näär AM. MicroRNAs in metabolism and metabolic disorders. Nat Rev Mol Cell Biol. 2012;13:239–250. doi: 10.1038/nrm3313. [DOI] [PMC free article] [PubMed] [Google Scholar]
- [138].Perri R, Nares S, Zhang S, Barros SP. Offenbacher S. MicroRNA modulation in obesity and periodontitis. J Dent Res. 2012;91:33–38. doi: 10.1177/0022034511425045. [DOI] [PMC free article] [PubMed] [Google Scholar]
- [139].Xie H, Lim B, Lodish HF. MicroRNAs induced during adipogenesis that accelerate fat cell development are downregulated in obesity. Diabetes. 2009;58:1050–1057. doi: 10.2337/db08-1299. [DOI] [PMC free article] [PubMed] [Google Scholar]
- [140].Sood P, Krek A, Zavolan M, Macino G, Rajewsky N. Cell-type-specific signatures of microRNAs on target mRNA expression. Proc Natl Acad Sci U S A. 2006;103:2746–2751. doi: 10.1073/pnas.0511045103. [DOI] [PMC free article] [PubMed] [Google Scholar]