

Abstract
Dissecting a protein unfolding process into individual steps can provide valuable information on the forces that maintain the integrity of the folded structure. Solvation of the protein core determines stability, but it is not clear when such solvation occurs during unfolding. In this study, far-UV circular dichroism measurements suggest a simplistic two-state view of the unfolding of barstar, but the use of multiple other probes brings out the complexity of the unfolding reaction. Near-UV circular dichroism measurements show that unfolding commences with the loosening of tertiary interactions in a native-like intermediate, N∗. Fluorescence resonance energy transfer measurements show that N∗ then expands rapidly but partially to form an early unfolding intermediate IE. Fluorescence spectral measurements indicate that both N∗ and IE have retained native-like solvent accessibility of the core, suggesting that they are dry molten globules. Dynamic quenching measurements at the single tryptophan buried in the core suggest that the core becomes solvated only later in a late wet molten globule, IL, which precedes the unfolded form. Fluorescence anisotropy decay measurements show that tight packing around the core tryptophan is lost when IL forms. Of importance, the slowest step is unfolding of the wet molten globule and involves a solvated transition state.
Introduction
An early theoretical study of the thermodynamics of protein unfolding had suggested that protein unfolding begins by the loss of tight packing interactions (1,2). It was proposed that the native state (N) expands initially into a dry molten globule (DMG), which, upon the penetration of water into its structure, transforms into a wet molten globule (WMG). Evidence for DMG intermediates have come from both experiments (3–6) and simulations (7), but several key questions remain unanswered (8). Is the DMG a uniformly or selectively expanded form of the N state? Have packing interactions in the DMG been lost only in some segments of the structure, or are they also lost in the hydrophobic core? Is the interior of a DMG liquid-like, unlike the interior of the N state, which is more solid-like (9,10) than liquid-like (11)? Packing interactions play a major role in determining the stability of the N state (10,12), but how important is their contribution, relative to that of hydrogen bonding, to the stability of the DMG? These questions are important to answer especially if the DMG turns out to be as ubiquitous a folding intermediate as the WMG turned out to be, and especially in the light of recent studies that suggest that molten globule conformations with perturbed internal packing may nevertheless retain function in some cases (13).
WMGs have been identified in equilibrium studies of the unfolding of many different proteins. The WMG possesses secondary structure, a perturbed and dynamic tertiary structure, solvated hydrophobic residues, as well as native-like dimensions and topology (14–17). The WMG is important to study because it appears as the first detectable structured intermediate early during folding, before the rate-limiting step (18–21). Its formation either accompanies or closely follows the chain collapse reaction that initiates folding (22). Surprisingly, the WMG has not been detected in kinetic unfolding studies, with one exception (23). An understanding of the placement of the WMG with respect to the rate-limiting step on the unfolding pathway is important because it will provide information on the structure, dynamics, and solvent-accessibility of the transition state of unfolding.
The DMG is particularly hard to identify in studies of protein folding because it appears to form after the rate-limiting step of folding (8,16). Intermediates that form after the rate-limiting step of folding, however, can be identified from studies of unfolding at high denaturant concentration, and for several proteins (24–28). In particular, it has been shown for barstar that the same mechanism for unfolding and folding in urea is applicable over the urea concentration range 0 to 7 M (29). Hence, in zero to high urea concentration, the folding and unfolding pathways of barstar are identical, and a DMG identified to form early during unfolding at high denaturant concentration can be expected to form late during folding at low denaturant concentration. A practical way to identify and characterize DMGs is therefore to study unfolding at high denaturant concentration (3–5). The characterization of unfolding intermediates identified in such studies has provided useful information on the transition state, and the characterization of DMGs is important because it is expected to provide insight into the nature of the physical forces that maintain the integrity of protein structure (8,30).
Several methodologies, some with single-residue resolution, enable the study of the packing, solvent-accessibility and dynamics of an equilibrium molten globule (MG) (16,17,31–34), but these methodologies are not easily applicable for the study of scarcely populated MGs. For identifying and characterizing a transiently populated DMG during protein folding or unfolding, it is necessary to have fast probes that can provide residue-level information on changes in solvent-accessibility, side-chain dynamics, and packing. Time-resolved fluorescence methods can monitor these changes when used in double-kinetic studies (23,35,36), and they are ideally suited to determine whether such changes occur in a sequential or concerted manner.
Here, time-resolved dynamic fluorescence quenching as well as fluorescence anisotropy decay measurement, have been used to dissect the unfolding of the small protein barstar into distinct structural events characterized by changes in solvent-accessibility and side-chain dynamics. These changes have been placed in the context of changes in secondary structure, tertiary structure and protein dimensions by concurrent measurements of far-UV and near-UV circular dichroism (CD) and two-site fluorescence resonance energy transfer (FRET). Barstar was chosen because previous unfolding studies using multiple structural probes had already indicated that its unfolding does not follow a simple N ↔ U model (29,30,37–41). In this study, dry and wet molten globules on the unfolding pathway have been delineated, and the rate-limiting step of unfolding has been characterized.
Materials and Methods
Protein expression and purification
The single-Trp and single-Cys containing mutant forms of barstar, Cys-82 and Cys-25 were purified as described earlier (20). All the experiments were done at 10°C.
Time-resolved fluorescence measurements
Fluorescence intensity decay traces during unfolding were collected using a double kinetic setup as described previously (23). In short, the setup consists of a ps laser system coupled to a stopped-flow device and a time-correlated single photon counting instrument. Details of the setup are given in the Supporting Material. Detailed data analysis is described in the Methods of the Supporting Material.
Stern-Volmer plot for equilibrium and kinetic experiments
Fluorescence lifetimes of the N and U states were measured at different acrylamide (or KI) concentrations and the mean lifetime values in the absence (τ0) and in presence (τ) of quencher were used to generate Stern-Volmer plots. In KI quenching experiments, to ensure that all solutions had the same ionic strength as that of 0.6 M KI, KCl was added to solutions containing lower concentrations of KI. The Stern-Volmer constant (Ksv) was obtained from the slope of fitting the data to a linear equation with an intercept of 1.0 as given by the Stern-Volmer equation:
| (1) |
The bimolecular fluorescence quenching constant (kq) was determined by dividing Ksv with the intensity averaged lifetime (τa) in the absence of quencher as given in Eq. 2:
| (2) |
To obtain values for KSV and kq for acrylamide at different times of unfolding, four separate unfolding kinetic experiments were done in the presence of 0.0, 0.1, 0.2, and 0.6 M acrylamide. In KI quenching experiments, kinetic unfolding traces were obtained at different concentrations of KI, with the ionic strength maintained at 0.6 M by the addition of appropriate concentrations of KCl. Fluorescence decay traces were collected at every 0.2 s of unfolding, and analyzed to obtain mean lifetimes. The mean lifetime values for different concentrations of quencher for the same time points of unfolding were further used to generate Stern-Volmer plots, using Eq. 1, during the kinetic process. The Stern-Volmer plots were further used to obtain values for kq at different times of unfolding, using Eq. 2.
Equilibrium and kinetic unfolding experiments monitored by steady-state fluorescence and CD
Steady-state fluorescence-monitored equilibrium unfolding experiments were done using the MOS450 optical system, and CD measurements done using a JASCO J-815 spectropolarimeter (Easton, MD), as described earlier (5). All the kinetic experiments were performed using the SFM400 stopped-flow mixing module from Biologic (Claix, France), as described earlier (5,42). For details, see the Methods of the Supporting Material.
Double Jump experiments
The experimental setup was similar to other steady-state fluorescence measurements (see above). 40 μl of native protein were mixed with 200 μl of 6.6 M urea buffer so that the protein commenced unfolding in 5.5 M urea. After different delay times ranging from 1.5 s to 4.5 s, 110 μl of partly unfolded protein solution were mixed with 110 μl of 5.5 M urea buffer containing 1.2 M acrylamide at an 1:1 mixing ratio to make the final acrylamide concentration equal to 0.6 M, without diluting the urea. Fluorescence was averaged for 50 ms after the addition of acrylamide. The dilution factor for the protein after the addition of the acrylamide solution was accounted to normalize the fluorescence signal.
Results and Discussion
In this study, the unfolding of a single tryptophan containing a mutant form of barstar (29) has been studied. This mutant form contains only the fully buried W53 in the core of the protein (Fig. 1), and not the other two Trp residues found partially buried in wild-type barstar, and its folding and unfolding mechanism have been shown to be similar to those of the wild-type protein.
Figure 1.
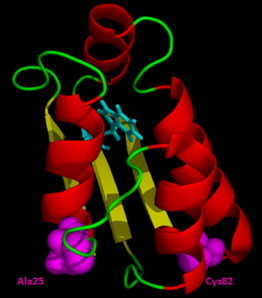
Structure of barstar. The Cys-25 and Cys-82 mutant variants both possess a single tryptophan residue (W53) and either C25 or C82. The indole ring of W53 is buried within the main core of the native protein. Of the two cysteine residues, C25 is present on the surface, whereas C82 is partially buried. All experiments were done with the Cys-82 protein; only the FRET experiments were also done with the Cys-25 protein. The structure was drawn from the PDB file 1bta using the program PyMOL. To see this figure in color, go online.
Multiple spectroscopic probes reveal early intermediates during unfolding
The unfolding of barstar was monitored by measurement of near-UV CD at 270 nm (Fig. 2 A), far-UV CD at 222 nm (Fig. 2 B), and fluorescence intensity of the core W53 (Fig. 2, C and D), in 5.5 M urea and 10°C. Near-UV and far-UV CD measurements probe tertiary packing interactions and secondary structure, respectively, whereas fluorescence measurement is used as an indicator of solvent polarity in the vicinity of the single Trp residue (W53) in Cys-82, the variant of barstar studied (Fig. 1). As expected, the kinetic curves measured by all three spectroscopic probes all end at the equilibrium signals determined for U (Fig. 2, A, B, and C). The near-UV CD signal does not, however, begin at the value expected for N: ∼15–20% of the near-UV CD signal is lost within 10 ms of the commencement of unfolding (Fig. 2 A), indicating the partial unlocking of packing interactions of side chains. The far-UV CD kinetic curve begins, however, at the signal expected for N in native buffer. The significant burst phase change in near-UV CD indicates that the native structure is perturbed significantly, very soon after transfer of the protein to unfolding conditions. Loosening of tight packing interactions in the burst phase is also inferred from the fluorescence anisotropy measurement (see later).
Figure 2.
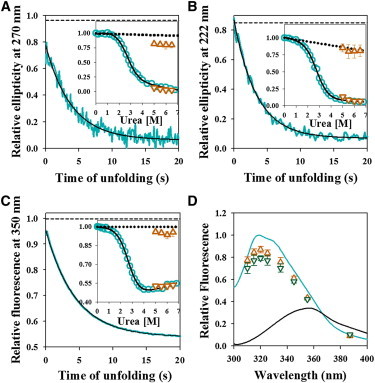
Dissolution of structure during unfolding monitored by multiple spectroscopic probes. (A–C) Representative kinetic traces of the unfolding of Cys-82 monitored by the change in near-UV CD signal at 270 nm (A), far-UV CD signal at 222 nm (B) and fluorescence intensity of W53 at 350 nm (C) are shown. In each panel, the solid cyan line represents the kinetic trace, the solid black line through the data is a fit to a single exponential equation, and the black dashed line represents the expected signal of native protein at 5.5 M urea, obtained from linear extrapolation of the native protein baseline of an equilibrium unfolding curve. In each panel, the inset shows the comparison between equilibrium and kinetic amplitudes. The cyan circles represent the equilibrium unfolding transition, and the solid black line is the fit to a two-state N ↔ U model. The brown triangles and inverted brown triangles represent t = 0 and t = ∞ signals, respectively, obtained from the fitting of the kinetic traces to a single exponential equation. The error bars represent the standard deviations of measurements from three separate experiments. The dotted line shows the native protein baseline. (D) Comparison of fluorescence spectra of barstar in equilibrium and kinetic measurements. Emission spectra in the N state (solid cyan line), the U state (solid black line), as well as the t = 0 (brown triangles) and t = 0.5 s (green inverted triangles) time points from the kinetic unfolding traces are shown, upon excitation of W53 at 295 nm. The spectra are normalized to the native signal of 1 at its emission maximum. The error bars for the t = 0 and t = 0.5 s fluorescence signals represent the standard deviations of measurements from three separate experiments. To see this figure in color, go online.
It appears therefore that a native-like unfolding intermediate, N∗, forms within 10 ms of the commencement of unfolding. N∗ is different from N in having some tertiary interactions perturbed, but it has native-like secondary structure. In the N state, W53 has its emission maximum around 320 nm, indicating that the core of the N state must be solvent inaccessible (the same inference was obtained from fluorescence quenching measurements, see later). In the U state, W53 has its emission maximum at 356 nm, indicating that it is fully solvent accessible. The fluorescence spectrum of N∗ (Fig. 2 D) shows that the quantum yield of fluorescence of W53 is lower in N∗ than in N. The fluorescence emission maximum is, however, the same (∼320 nm) in N and N∗, indicating that the local polarity of the environment in the vicinity of W53 has not changed. The conclusion that the core of N∗ is dry is also supported by fluorescence quenching measurements (see later).
The observable phase for the change in signal is well described by an exponential equation, for all the probes. It should be noted that although a two-state process will always show an exponential kinetic phase for the observable change in an optical signal, the converse need not be true. Apparently single exponential kinetics may arise, for example, from a transition involving multiple states. It is observed there is a dispersion of unfolding rate constants in the range 0.22–0.30 s−1 determined from single exponential fitting of the kinetic traces obtained using the different probes, which is beyond experimental error and persists at all urea concentrations (Fig. 3).
Figure 3.
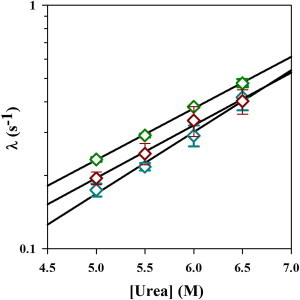
Comparison of the apparent rate constants of unfolding obtained from using different spectroscopic probes. The observed rates of unfolding of Cys-82 are shown as a function of urea concentration, as monitored by far-UV CD at 222 nm (⋄, green), near-UV CD at 270 nm (⋄, brown) and fluorescence intensity at 350 nm (⋄, cyan). The solid lines through the data represent fits to a linear equation. The error bars represent the standard deviations of measurements from three separate experiments. To see this figure in color, go online.
Protein expansion during unfolding
It was important to determine how different segments of the protein undergo expansion after the formation of N∗ during unfolding. Hence, FRET measurements were carried out to determine whether two intramolecular distances, one between W53 and a TNB moiety attached to C25 (in the Cys-25-TNB protein), and another between C53 and a TNB moiety attached to C82 (in the Cys-82-TNB protein) (Fig. 1). The W53-TNB FRET pair has been used extensively in FRET measurements of unfolding (36,41,42). It has been shown previously (41) that the proteins Cys-25, Cys-25-TNB, Cys-82, and Cys-82-TNB have similar stabilities, and Fig. S1 shows that their unfolding kinetics is similar when monitored by far-UV CD; hence, their FRET-monitored unfolding kinetics can be directly compared (see the Supporting Material Text).
FRET-monitored measurements of the unfolding of Cys-25-TNB and Cys-82-TNB were carried out by measurement of the increase in the fluorescence intensity of W53, the FRET donor, which is a measure of the decrease in FRET efficiency. In an earlier study, it was shown that the FRET efficiency decreases during unfolding because of an increase in intramolecular distance, and not because of a change in R0 (36,41). The fluorescence change for Cys-82-TNB is describable as an exponential process with a rate constant of ∼0.25 s−1 (Fig. 4 A), whereas that for Cys-25-TNB requires the sum of at least two exponentials with apparent rate constants of 3.7 s−1 and 0.31 s−1 having relative amplitudes of 0.2 and 0.8, respectively (Fig. 4 B). The apparent rates increase exponentially with an increase in urea concentration (Fig. 4 C), although the relative amplitudes of the two phases observed for Cys-25-TNB do not change with urea concentration (Fig. 4 D). The apparent rate of the slower expansion of the W53-Cys-25TNB distance is close to that of the expansion of the W53-Cys-82TNB distance (Fig. 4), and in the range of slow rates observed by other probes (Fig. 3), indicating that the observation of the faster expansion of the W53-Cys-25TNB distance is not because a different protein variant was used but because a different segment of structure was probed. The data indicate that an intermediate, IE, in which the W53-Cys-25TNB segment of the protein (Fig. 1) has partially expanded, has formed from N∗ during unfolding at a rate of 3.7 s−1. These observations describe the unfolding process as N → N∗ → IE → U (however, see later). The slowest step in unfolding, leading to the formation of U appears to occur at a probe-dependent rate in the range of 0.22 to 0.31 s−1 (Figs. 3 and 4). The significant probe-dependent dispersion in the unfolding rates suggests that the final step in unfolding leading to the formation of U may not be a two-state process even though each probe yields unfolding kinetics that appear describable as single exponential.
Figure 4.
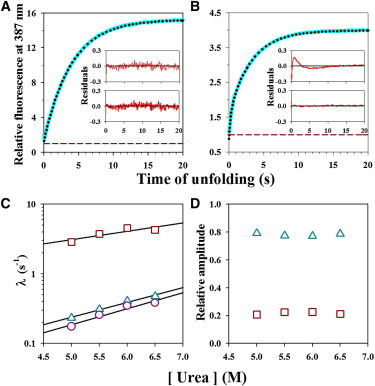
Two-site FRET monitored unfolding kinetics in 5.5 M urea and 10°C. (A and B) Representative kinetic unfolding traces (cyan lines) monitored by measurement of fluorescence intensity at 387 nm for Cys-82-TNB (panel A) and Cys-25-TNB (panel B). In each panel, the dotted black line through the data represents a fit to a single and two-exponential equation for Cys-82-TNB and Cys-25-TNB, respectively. The data are normalized to the native signal of 1 for each labeled protein. In each panel, the upper inset and the lower inset show the residuals of fitting of the kinetic traces to single and two-exponential equations, respectively. (C and D) Dependence on urea concentration of the FRET-monitored kinetics of unfolding. The rate constants of unfolding for Cys-82-TNB (o), and for the slow (Δ) and fast (□) phases of unfolding for Cys-25-TNB are shown at different urea concentrations (panel C). The black lines through the data represent fits to a linear equation. Relative amplitudes of the slow (Δ) and fast (□) phases of unfolding for Cys-25-TNB are shown as a function of urea concentration (panel D). To see this figure in color, go online.
The observation that the fluorescence spectrum of the Cys-82 protein at 500 ms of unfolding (when IE would be substantially populated) has not undergone any discernible red shift (Fig. 2 D) indicates that IE is still dry in the vicinity of W53 in the hydrophobic core. In the case of cytochrome c too, an equilibrium MG has been shown to possess a solvent-inaccessible hydrophobic core, which is much more loosely packed than that of the N state (43). In the case of apomyoglobin, an equilibrium MG with disrupted secondary structure appears, nevertheless, not hydrated to a larger extent than is the N state (44). Currently, it is not known whether the structural segment that has expanded in IE has also become hydrated.
Thus, the use of multiple probes has led to the identification of two intermediates, N∗ and IE, which retain a dry core, on the unfolding pathway of barstar. It is important to determine when the core of the protein becomes solvated during subsequent unfolding.
Identification of a WMG intermediate during unfolding
The solvent accessibility of W53 in the native state (N) in Cys-82 has been scored with respect to that in the unfolded state (U), by measurements of the dynamic quenching of its fluorescence, by two quenchers, the neutral acrylamide and the negatively charged iodide (in the form of KI). Dynamic quenching experiments provide a direct quantitative measure of the solvation of a fluorophore in a protein, but have been used only rarely in kinetic measurements of folding or unfolding (45–47).
Measurements of the mean fluorescence lifetime, τm (= Σ αi τi where αi is the amplitude of the lifetime component τi) made in the absence and presence of quencher at different concentrations yield Stern-Volmer plots for quenching by both acrylamide (Fig. 5 A) and iodide (Fig. S2 A). These plots yield values for kq, the bimolecular rate constant for the binding of quencher to W53 in its excited state (see Materials and Methods). For quenching by acrylamide, kq is seen to have values of 4 × 10⁷ M−1 s−1 and 1.9 × 10⁹ M−1 s−1 for N and U, respectively, whereas for quenching by iodide, the values are 3 × 10⁷ M−1 s−1 and 9.6 × 10⁸ M−1 s−1 for N and U, respectively. The values of kq obtained for U are similar to those reported for N-acetyl tryptophanamide in water (48,49), indicating that W53 is fully solvent-accessible in the unfolded protein. The values of kq obtained for N indicate that W53 is secluded from water in the core of the native protein. Similar values of kq for N, for quenchers of different size and polarity, indicate that the level of core solvation in native protein is correctly estimated through dynamic fluorescence quenching measurement. The value of kq for iodide quenching is lower than that for acrylamide quenching in the U state probably because the accessibility of iodide to W53 is hindered by electrostatic repulsion from the negatively charged side chain of E52. The values for kq for quenching by acrylamide and iodide are similar to those reported for other proteins (50,51). Fluorescence quenching in native proteins probably occurs through nanosecond structural fluctuations (50) that expose the fluorophore to the quencher. An alternative mechanism, namely, the migration of the quencher through the protein matrix (51) has been shown recently to be unlikely (52). HX-NMR experiments have shown that native barstar undergoes very rapid structural fluctuations, which allows it to sample even the fully unfolded state (39), and it is likely that quenching of W53 fluorescence in N by both quenchers occurs via such fluctuations. Of importance, the 50-fold and 30-fold dynamic ranges of kq for acrylamide (Fig. 5 A) and iodide (Fig. S2 A), respectively, have been used to infer changes in the solvent accessibility of W53 during unfolding with a high level of precision.
Figure 5.
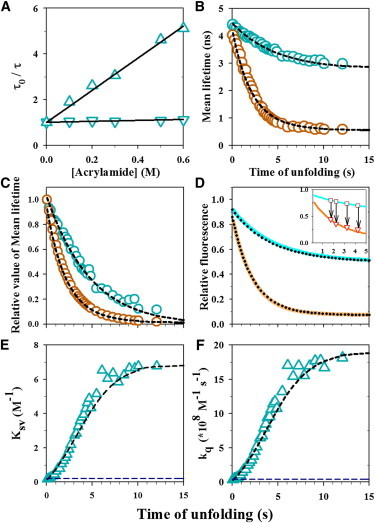
Quenching of W53 fluorescence by acrylamide. (A) Stern-Volmer plots for W53 quenching in the N (inverted triangles) and U states (triangles) of Cys-82. The mean fluorescence lifetime of W53 was measured in absence (τ0) and in presence of acrylamide (τ), and τ0/τ is plotted as a function of acrylamide concentration. The solid lines through the data are fits to a linear equation with an intercept of 1, and the slope is the Stern-Volmer constant (KSV) from which the kq values were calculated (see Materials and Methods). (B and C) Unfolding kinetics of barstar in 5.5 M urea and 10°C was monitored by measurement of the changes in the τm of W53 during unfolding in the absence (o, cyan) and presence (o, brown) of 0.6 M acrylamide (panel B). The kinetic traces have been normalized to between values of 1 for completely native protein and 0 for completely unfolded protein (panel C).The dashed black lines through the kinetic traces are fits to a N → IL → U model (Eq. S14 and Eq. S16, see the Supporting Material). The fits yield apparent rates for the N → IL and IL → U steps of 0.48 and 0.22 s−1, respectively. The mean lifetimes for N, IL, and U obtained from the fit were 4.20, 0.74, and 0.54 ns, respectively, in the presence of 0.6 M acrylamide, and 4.45, 3.75, and 2.80 ns, respectively, in its absence (panel B). (D) Unfolding kinetics of barstar monitored by fluorescence intensity measurement at 350 nm. Kinetic traces of the unfolding of barstar in the absence (solid cyan line) and presence (solid brown line) of 0.6 M acrylamide are shown. Each kinetic trace is normalized to the native signal of 1 in the absence of acrylamide. The solid lines through the data are fits to the three-state N → IL → U model (Eq. S13 and Eq. S15). The fits yield apparent rates for the N → IL and IL → U steps of 0.46 and 0.22 s−1, respectively. The fluorescence intensities for N, I and U obtained from the fits were 0.92, 0.70, and 0.50, respectively, in the absence of acrylamide, and 0.86, 0.10, and 0.07, respectively, in the presence of 0.6 M acrylamide. The inset in panel D shows the data from the interrupted unfolding experiment. The solid cyan and brown lines represent the unfolding kinetic traces in the absence and presence of 0.6 M acrylamide, respectively. The brown squares represent the fluorescence signals of protein unfolding in the absence of acrylamide, before the addition of 0.6 M acrylamide, and the red triangles represent the fluorescence signals immediately attained upon the jumps in acrylamide concentration to 0.6 M. The arrows connecting the fluorescence signals before and after the addition of acrylamide, indicate the times at which unfolding was interrupted. (E and F) Evolution of the Stern-Volmer constant (KSV) and bimolecular fluorescence quenching constant (kq) during unfolding. KSV (panel E) and kq (panel F) values (Δ) were calculated at each time point during unfolding from the τm values (see Materials and Methods of the Supporting Material), and are plotted as a function of unfolding time. The black dashed line through the data is a simulated fit (see Materials and Methods) to the N → IL → U model, using parameter values from the fits to the data in panel B. The dashed blue line represents the value for the N state. To see this figure in color, go online.
τm was determined at every 200 ms of the unfolding process initiated by dilution of barstar (Cys-82) into 5.5 M urea at 10°C, using the double-kinetic setup (see Materials and Methods) described elsewhere (23). The kinetic traces of unfolding in the absence and presence of acrylamide (0.6 M) appear to be single exponential by themselves, but the unfolding of Cys-82 is twofold faster in the presence of acrylamide than in its absence (Fig. 5 B). The twofold difference in rates becomes even more apparent when the kinetic traces are normalized between values of 1 and 0 for N and U, respectively (Fig. 5 C). When unfolding in the absence and presence of 0.6 M acrylamide was monitored by measurement of fluorescence intensity, the kinetic traces were coincident with those obtained using τm as the probe (Fig. 5 D), as expected. In both the time-resolved and steady-state experiments, no burst-phase intermediate is discernable from the quenching kinetics (Fig. 5 D). Similar results were obtained when 0.6 M KI was used instead of 0.6 M acrylamide as the quencher; again, unfolding appeared twofold faster in the presence of KI (Fig. S2, B, C, and D). In iodide quenching experiments, uniform ionic strength was maintained across all the solutions by adding KCl, wherever needed.
It was important to demonstrate that the twofold acceleration of unfolding in the presence of quenchers is real, and not a manifestation of the effect of the quencher on the unfolding rate constant or mechanism. It was not possible to use far-UV CD as the probe to monitor unfolding in the presence of 0.6 M of quenchers, because of the very high absorbance of the solution. Hence, to rule out any nonspecific effect of acrylamide, interrupted unfolding experiments (see Materials and Methods) were carried out in which unfolding was commenced in the absence of acrylamide, and acrylamide was added at a specific, variable time of unfolding. It was found that upon addition of acrylamide at any time of unfolding, the fluorescence was immediately quenched to a value predicted by the kinetic trace of unfolding started in the presence of acrylamide (Fig. 5 D, inset). Hence, the faster decrease in τm or fluorescence intensity during unfolding in the presence of quencher than in its absence, is real, and must reflect a stepwise unfolding process involving structures differing in the solvent-accessibility of the core.
Because unfolding is faster in the presence of quencher, a single rate constant cannot be used to describe the kinetic traces in the presence and absence of quencher. Hence, a two-state N→ U model with a single rate constant cannot be used to describe the data. It becomes necessary, minimally to fit the kinetic traces to a three-state N → IL → U model with IL representing an intermediate. The fits (Fig. 5, B, C, and D), yield apparent rates of 0.47 ± 0.01 s−1 and 0.21 ± 0.01 s−1 for the steps N → IL and IL → U, respectively, for acrylamide quenching. The time-evolution of the Stern-Volmer constant, KSV (Fig. 5 E) as well as of kq (Fig. 5 F), calculated from these rate constants (see the Supporting Material) agree well with the experimental data. The value of kq for the quenching of W53 fluorescence by acrylamide in IL is determined to be 1.8 × 10⁹ M−1 s−1, which is close to that for quenching in U (see the Supporting Material). These values for kq suggest that quencher binding is at or near the diffusion-controlled limit for a reaction in aqueous solution, making it unlikely that quenching in IL occurs by migration of the quencher through the protein matrix.
Because the size of acrylamide is different from that of water, it can be argued that the entrance of acrylamide into the core of IL may not mimic the entry of water. Hence, it was also necessary to check the rates of the N → IL and IL → U steps in the case of iodide quenching. To be able to do so, it was necessary to first understand the dependence of the unfolding rate on ionic strength. It was found that unfolding in the presence of 0.6 M KCl is ∼1.5-fold faster than in the absence of added KCl (Fig. S2), as expected from an earlier study that showed the unfolding rate of barstar is faster at higher ionic strength (53). Unfolding occurs at apparent rates of 0.31 s−1 and 0.68 s−1 in 0.6 M KCl and 0.6 M KI, respectively (Fig. S2, B and D). As in the case of acrylamide quenching (Fig. 5), the data in Fig. S2, B and D, were fit to the three-state N → IL → U model, and apparent rate constants of ∼0.71 s−1 and ∼0.31 s−1 were obtained for the N → IL and IL → U steps, respectively (Fig. S2, B and D). As expected from the ionic strength effect (53), the apparent rate constants for both steps are ∼1.5-fold faster than the corresponding rate constants obtained for acrylamide quenching (Fig. 5). When the data were fit to the three-state N → IL → U model, the value of kq obtained for IL was 8.5 × 10⁸ M−1 s−1, which is similar to the value of 9.6 × 10⁸ M−1 s−1 for U, indicating that W53 is as solvent-exposed in IL as it is in U. It should be noted that for unfolding in the presence of 0.6 M KCl, an additional (25%) kinetic phase with an apparent rate of 0.003 s−1 is also observed during unfolding, which is attributable to proline isomerization (41,53), but this slow phase is not seen for unfolding in the presence of 0.6 M KI, presumably because the W53 fluorescence gets fully quenched before proline isomerization occurs.
Interestingly, fitting to the three-state model (see figure legends of Fig. 5 and Fig. S2) shows that the fluorescence quantum yield of IL is ∼40% higher than that of U and ∼24% lower than that of N in the absence of quencher. Hence, considerable changes in fluorescence occur in both the kinetic steps, N → IL and IL → U; consequently, no lag phase is observed in the unfolding kinetic traces. It should be noted that a lag phase in the decrease in fluorescence would have been expected only if the fluorescence property of IL were N-like, because then most of the change in fluorescence would occur during the conversion of IL to U. Thus, the nonobservation of a lag phase cannot be used to rule out the three-state N → IL → U model for unfolding. On the contrary, additional support for the presence of IL comes from the kinetics of the time-evolution of the motional dynamics of W53 during unfolding (see below).
W53 resides in the core of the protein, where it is in contact with seven other residues. Hence, the U-like solvent-accessibility of W53 in IL suggests that much of the core of the protein becomes solvated in IL, before complete unfolding of the protein. Hence, the observation that W53 is nearly fully accessible to quencher in IL makes it very likely that it is also nearly fully accessible to water; consequently, W53 and the core in which it resides must be fully hydrated in IL. The fully hydrated core in IL qualifies it to be a WMG.
Evolution of core flexibility during unfolding
The side chain of W53 is held rigidly in the hydrophobic core of native barstar, by contacts with seven other residues (54). In fact, native barstar is a rare example of a single Trp-containing protein showing a single fluorescence lifetime due to conformational selection of a single rotamer (37,55). When the rotational dynamics of the W53 side chain is studied in Cys-82, no local dynamics of W53 is observed in the N state (17,37): only a single rotational correlation time of ∼6.5 ns corresponding to the global tumbling dynamics of barstar (MW = 10 kDa) is seen (Fig. 6 A). In contrast, the U state is characterized by a highly flexible W53 (17,37), and two correlation times, ∼0.7 ns and ∼2.9 ns observed (Fig. 6 A), having amplitudes of 0.6 and 0.4, respectively. These are ascribed to the local motion of the indole chromophore and a combination of segmental and global tumbling dynamics of the polypeptide chain, respectively (17,37). The shorter correlation time φlocal (∼0.7 ns) and its amplitude βlocal are used as indicators of core flexibility. Entry of solvent molecules into the core of IL requires loosening of tight packing interactions around W53 in the N state, and that must be reflected in an increased amplitude of anisotropy decay due to local rotational motion of W53 (increase in βlocal) in comparison to the N state. Thus, monitoring W53 dynamics is a robust indicator of the evolution of core flexibility during unfolding.
Figure 6.
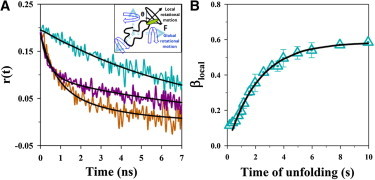
Evolution of the core dynamics during unfolding by time-resolved fluorescence anisotropy measurements. (A) Fluorescence anisotropy decay traces for native protein (cyan trace), unfolded protein (brown trace), and at 3.7 s of unfolding (purple trace) of Cys-82 in 5.5 M urea. The trace for the native protein was fitted to a single exponential equation and is described by: r(t) = 0.19[exp(−t/6.5)]. The trace for the unfolded protein was fitted to a two-exponential equation and is described by r(t) = 0.19[0.56 exp(−t/0.7) + 0.44 exp(−t/2.9)]. The trace at 3.7 s of unfolding was fitted to a two-exponential equation and is given by r(t) = 0.19[0.48 exp(−t/0.4) + 0.52 exp(−t/7.6)]. The inset shows the local and global rotational motions of the fluorophore attached to the polypeptide chain responsible for the depolarization of fluorescence in time-resolved anisotropy measurements. (B) Evolution of the amplitude of fast rotational correlation time (βlocal) during unfolding. The fluorescence anisotropy decay traces were collected for every 0.2 s of unfolding and fitted to a two-exponential equation. βlocal (cyan triangles) is plotted as a function of unfolding time. The solid black line through the data represents the fit to a single exponential equation. The error bars represent the standard deviations of measurements from two separate experiments. To see this figure in color, go online.
To monitor the development of the local motion of W53 during unfolding, the fluorescence anisotropy decay kinetics of W53 was collected every 200 ms, using the double kinetics setup (see Materials and Methods). Typical decay curves obtained at different times of unfolding are shown in Figs. 6 A and Fig. S3, which were analyzed for two rotational correlation times (see the Supporting Material for the model). In the analysis, the initial anisotropy r0 was constrained to a value between 0.19 and 0.21, because the value obtained for r0 from fluorescence anisotropy decay measurements of N-acetyl tryptophanamide in 75% glycerol is 0.2 ± 0.01, (data not shown). At any time point, the relative amplitude of the anisotropy lost by local motion, βlocal, represents the relative fraction of molecules that have unfolded sufficiently for the W53 side chain to be able to undergo very rapid (∼0.4–0.7 ns) local motion. βlocal is expected to rise from zero (as observed in the N state) to ∼0.6 (the value observed for the U state) during unfolding. Fig. 6 B shows this rise during unfolding, which occurs with an apparent rate constant of ∼0.45 s−1. This rate is very similar to that obtained for the N → IL unfolding step from the fluorescence quenching experiments (see above). Thus, it appears that the change in βlocal tracks the formation of IL, in which the core flexibility is very similar to that of U. This supports the identification of IL as a WMG. Furthermore, this also shows that the motional dynamics of W53 in IL is identical to that in U.
Thus, observations of both the time evolution of fluorescence quenching of the core W53 and the flexibility of W53 during unfolding lead to the conclusion that the early intermediates (N∗ and IE) get solvated via the formation of WMG intermediate during unfolding. Interestingly, inspection of Fig. 6 B (the data and the fitting) seems to suggest the presence of a burst phase increase in βlocal, whose amplitude is ∼10% of the total observed increase, suggesting that packing interactions in the core have started loosening with the formation of early unfolding intermediates whose core is partially liquid-like (see above).
Unfolding pathway of barstar
Both N∗ and IE possess characteristic features of a DMG. Near-UV CD (Fig. 2 A) and fluorescence anisotropy measurements (Fig. 6) show that tertiary interactions are perturbed in N∗, and hence in IE, but both N∗ and IE retain native-like secondary structure. Of importance, W53 in the hydrophobic core remains secluded from water (Fig. 2 D). The dryness of the core in N∗ and IE is confirmed from the fluorescence quenching measurements, which do not show any burst phase change for any of the quenchers (Fig. 5 and Fig. S2). N∗ and IE therefore resemble the DMGs observed during the unfolding of other proteins (3–6). IE is more perturbed structurally than N∗: FRET measurements show that the structural segment separating W53 and C25 has expanded in IE but not in N∗. Such expansion would necessarily have been accompanied by loosening of the tight packing present in this structural segment in N and N∗. In contrast, IL clearly possesses characteristic features of a WMG: a mobile (Fig. 6) and solvent-accessible hydrophobic core into which water has entered (Fig. 5 and Fig. S2), and having considerable secondary structure (Fig. 2).
Multistep unfolding of barstar
Earlier equilibrium unfolding studies of barstar (37,55) had suggested that it undergoes unfolding in incremental steps, but could not delineate the nature of these steps. In this kinetic study, it has been shown that unfolding is describable by the five-state mechanism shown in Fig. 7. In this five-state mechanism, the existence of N∗ was indicated by the observation of a very rapid (>500 s−1) perturbation of tertiary structure (Fig. 2, A and D); the existence of IL was indicated by the observation that Trp-53 becomes hydrated (Fig. 5, C and D), as well as rotationally mobile (Fig. 6 B) at a rate that is twofold faster than that (0.2 s−1) of the disappearance of overall structure (Fig. 2 C); and the existence of IE was indicated by the observation that the Trp-53-Cys-25 TNB segment undergoes fast expansion at a rate of 3.7 s−1 (Fig. 4 B).
Figure 7.
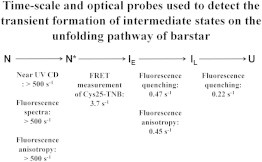
Mechanism of unfolding of barstar. The kinetic scheme of unfolding is shown, along with the probes used to interrogate the individual steps and the rates that these probes yield. The mechanism shown is a minimal mechanism and describes the sequence of structural events that occur during unfolding. It does not preclude more complex schemes that invoke multiple pathways or a continuum of intermediates.
It was important to confirm that the multistep mechanism (see above) satisfactorily describes all aspects of the experimental data, by carrying out kinetic simulations (Fig. S4), as well as by carrying out global fitting of the data (Fig. S5) to the five-state mechanism (Fig.7). In kinetic simulations to this mechanism shown in Fig. 7, it was found that the simulated kinetic curves are coincident with the experimental kinetic curves obtained with the different spectroscopic probes (Fig. S4). Global fitting of all the kinetic traces to the five-state mechanism shown in Fig. 7, but with all steps reversible under the constraint of the measured overall equilibrium constant, fit the data equally well (Fig. S5). The data were also globally fitted to a four-state mechanism (Fig. S6). A comparison of the residuals from the fits to the five-state and four-state mechanisms (Fig. S7) clearly shows that a four-state mechanism is unable to fit all the data as well as does the five-state mechanism. Hence, global fitting of the data validates the necessity of including three intermediates (N∗, IE, and IL) in the minimal model (Fig.7) that delineates the unfolding process of barstar.
Validation by global fitting of all the data obtained by many different probes was especially important because each probe by itself showed a change in only one kinetic phase describable by an exponential equation, and the complex unfolding mechanism (Fig. 7) was suggested by the rates measured by the different probes being significantly different, well beyond experimental error. Only the near-UV CD and fluorescence signals (including FRET) change in more than one step (kinetic phase) of unfolding. The observation that the other probes each report on only one kinetic phase, merely means that only one step in the reaction is reported on by that probe, with the other steps being silent to that probe.
The simple sequential mechanism (Fig. 7) is the minimal mechanism that accounts for all the data. Obviously, more complex mechanisms might also effectively describe the data. One possible complexity suggested by the relative small difference in unfolding rates for the last two steps in the unfolding mechanism (Fig. 7) is that unfolding is gradual, occurring through a continuum of transitions. Indeed, the observed exponential kinetics observed for each discrete step is also not incompatible with gradual structural change (23,42). But the current study does not provide any direct evidence for a continuum of unfolding transitions as seen for example for monellin (23). The other complexity suggested by the small dispersion in the unfolding rates measured by different probes for the IL → N step, and the differences in their dependences on denaturant concentration (Fig. 3), is that multiple pathways operate, even at the slowest stage of unfolding. Indeed, several previous studies have suggested that multiple pathways are available for some mutant variants of barstar to unfold in some but not all unfolding conditions (38,40,41). But the dispersion in the denaturant dependences of the probe-dependent rates of the slowest step is too small to warrant invoking multiple pathways for unfolding. Moreover, the absence of curvatures in the plots of the logarithm of the probe-dependent unfolding rate on denaturant concentration (Figs. 3 and 4), suggests that parallel pathways are not operative in the range of denaturant concentrations used to induce unfolding in this study. Hence, in the absence of any direct evidence in support of either gradual unfolding or multiple unfolding pathways, it is prudent at the present time to not look beyond the minimal kinetic mechanism (Fig. 7) that adequately describes all the data obtained in this study.
Nature of the rate-limiting step in unfolding: the IL to U transition
Much of the secondary and tertiary structure is lost during the IL → U transition, and the protein becomes completely solvated. The dispersion in unfolding rate constants observed for this transition (Fig. 3) for the same mutant variant (Cys-82) suggests that it occurs in multiple steps. It remains to be seen whether the IL → U transition occurs through a diffusive swelling process, as has been shown in the case of monellin (23). It is notable that the transition between U and the WMG that forms initially during the folding of barstar appears to be a continuous transition (22,42), and this may be the general case (56,57). Because it has been shown, in the case of barstar, that the unfolding pathway at high urea concentration is similar to the folding pathway at low urea concentration (29), it is likely that the last step in unfolding is also a continuous transition.
Because the IL → U transition is the rate-limiting step in unfolding, and since W53 and its vicinity appear to be about as hydrated in IL, as they are in U (see above), the transition state of the overall unfolding reaction, which lies between IL and U, must be at least as solvated as IL.
A fundamental issue is to locate the position of the transition state on the folding pathway with respect to U, the DMG and WMG, and N. During the folding of barstar, the WMG-like intermediate that is formed rapidly (20,42), folds further much more slowly (19), suggesting that the rate-limiting step is that between WMG and DMG-like intermediates. Hence, it would appear that the rate-limiting step switches from being between the WMG and U during unfolding, to being between the WMG and DMG intermediates during folding. In this scenario, it would be difficult to kinetically detect the DMG in a folding experiment because it would form after the rate-limiting step. Thus, in this case, an unfolding experiment is more useful than a folding experiment to detect such an intermediate, which lies toward the native basin of the major energy barrier. Understanding the energetics of these transitions (58), and how it and the structures of the WMG and DMG intermediates are modulated by changes in folding/unfolding conditions, forms the focus of ongoing studies.
Conclusion
In summary, this study characterizes the structure and dynamics of intermediate states populated during the unfolding of barstar. The use of multiple probes reveals the hidden complexity of the process. Solvation of the protein core has been observed to occur in incremental steps, through the sequential formation of dry and wet molten globules. The presence of dry and wet molten globules during the unfolding of a protein has been previously observed in theoretical studies (1,2), and it has been detected experimentally in this kinetic study. Specifically, this study has provided answers to the questions raised in the Introduction: i), DMG is a nonuniformly expanded form of N; ii), Tertiary interactions are loosened in DMG, although not in the hydrophobic core; iii), The interior of the DMG is partially liquid-like; and iv), The main transition state for unfolding lies between the WMG and U.
Acknowledgments
We thank Prof. N. Periasamy for the software used in the analysis of time-resolved fluorescence decays. We thank A. Jha, M. H. Kombrabail, and N. Aghera for their assistance.
This work was funded by the Tata Institute of Fundamental Research, India. G.K. and J.B.U. are recipients of J. C. Bose National Research Fellowships from the Government of India.
Contributor Information
Jayant B. Udgaonkar, Email: jayant@ncbs.res.in.
Guruswamy Krishnamoorthy, Email: gk@tifr.res.in.
Supporting Material
References
- 1.Shakhnovich E.I., Finkelstein A.V. Theory of cooperative transitions in protein molecules. I. Why denaturation of globular protein is a first-order phase transition. Biopolymers. 1989;28:1667–1680. doi: 10.1002/bip.360281003. [DOI] [PubMed] [Google Scholar]
- 2.Finkelstein A.V., Shakhnovich E.I. Theory of cooperative transitions in protein molecules. II. Phase diagram for a protein molecule in solution. Biopolymers. 1989;28:1681–1694. doi: 10.1002/bip.360281004. [DOI] [PubMed] [Google Scholar]
- 3.Kiefhaber T., Labhardt A.M., Baldwin R.L. Direct NMR evidence for an intermediate preceding the rate-limiting step in the unfolding of ribonuclease A. Nature. 1995;375:513–515. doi: 10.1038/375513a0. [DOI] [PubMed] [Google Scholar]
- 4.Hoeltzli S.D., Frieden C. Stopped-flow NMR spectroscopy: real-time unfolding studies of 6-19F-tryptophan-labeled Escherichia coli dihydrofolate reductase. Proc. Natl. Acad. Sci. USA. 1995;92:9318–9322. doi: 10.1073/pnas.92.20.9318. [DOI] [PMC free article] [PubMed] [Google Scholar]
- 5.Jha S.K., Udgaonkar J.B. Direct evidence for a dry molten globule intermediate during the unfolding of a small protein. Proc. Natl. Acad. Sci. USA. 2009;106:12289–12294. doi: 10.1073/pnas.0905744106. [DOI] [PMC free article] [PubMed] [Google Scholar]
- 6.Reiner A., Henklein P., Kiefhaber T. An unlocking/relocking barrier in conformational fluctuations of villin headpiece subdomain. Proc. Natl. Acad. Sci. USA. 2010;107:4955–4960. doi: 10.1073/pnas.0910001107. [DOI] [PMC free article] [PubMed] [Google Scholar]
- 7.Hua L., Zhou R., Berne B.J. Urea denaturation by stronger dispersion interactions with proteins than water implies a 2-stage unfolding. Proc. Natl. Acad. Sci. USA. 2008;105:16928–16933. doi: 10.1073/pnas.0808427105. [DOI] [PMC free article] [PubMed] [Google Scholar]
- 8.Baldwin R.L., Frieden C., Rose G.D. Dry molten globule intermediates and the mechanism of protein unfolding. Proteins. 2010;78:2725–2737. doi: 10.1002/prot.22803. [DOI] [PMC free article] [PubMed] [Google Scholar]
- 9.Chothia C. Principles that determine the structure of proteins. Annu. Rev. Biochem. 1984;53:537–572. doi: 10.1146/annurev.bi.53.070184.002541. [DOI] [PubMed] [Google Scholar]
- 10.Privalov P.L., Gill S.J. Stability of protein structure and hydrophobic interaction. Adv. Protein Chem. 1988;39:191–234. doi: 10.1016/s0065-3233(08)60377-0. [DOI] [PubMed] [Google Scholar]
- 11.Kauzmann W. Some factors in the interpretation of protein denaturation. Adv. Protein Chem. 1959;14:1–63. doi: 10.1016/s0065-3233(08)60608-7. [DOI] [PubMed] [Google Scholar]
- 12.Baldwin R.L. Energetics of protein folding. J. Mol. Biol. 2007;371:283–301. doi: 10.1016/j.jmb.2007.05.078. [DOI] [PubMed] [Google Scholar]
- 13.Baldwin R.L., Rose G.D. Molten globules, entropy-driven conformational change and protein folding. Curr. Opin. Struct. Biol. 2013;23:4–10. doi: 10.1016/j.sbi.2012.11.004. [DOI] [PubMed] [Google Scholar]
- 14.Kuwajima K., Hiraoka Y., Sugai S. Comparison of the transient folding intermediates in lysozyme and α-lactalbumin. Biochemistry. 1985;24:874–881. doi: 10.1021/bi00325a010. [DOI] [PubMed] [Google Scholar]
- 15.Arai M., Kuwajima K. Role of the molten globule state in protein folding. Adv. Protein Chem. 2000;53:209–282. doi: 10.1016/s0065-3233(00)53005-8. [DOI] [PubMed] [Google Scholar]
- 16.Rami B.R., Udgaonkar J.B. Mechanism of formation of a productive molten globule form of barstar. Biochemistry. 2002;41:1710–1716. doi: 10.1021/bi0120300. [DOI] [PubMed] [Google Scholar]
- 17.Rami B.R., Krishnamoorthy G., Udgaonkar J.B. Dynamics of the core tryptophan during the formation of a productive molten globule intermediate of barstar. Biochemistry. 2003;42:7986–8000. doi: 10.1021/bi030006b. [DOI] [PubMed] [Google Scholar]
- 18.Jennings P.A., Wright P.E. Formation of a molten globule intermediate early in the kinetic folding pathway of apomyoglobin. Science. 1993;262:892–896. doi: 10.1126/science.8235610. [DOI] [PubMed] [Google Scholar]
- 19.Shastry M.C.R., Udgaonkar J.B. The folding mechanism of barstar: evidence for multiple pathways and multiple intermediates. J. Mol. Biol. 1995;247:1013–1027. doi: 10.1006/jmbi.1994.0196. [DOI] [PubMed] [Google Scholar]
- 20.Agashe V.R., Shastry M.C.R., Udgaonkar J.B. Initial hydrophobic collapse in the folding of barstar. Nature. 1995;377:754–757. doi: 10.1038/377754a0. [DOI] [PubMed] [Google Scholar]
- 21.Raschke T.M., Marqusee S. The kinetic folding intermediate of ribonuclease H resembles the acid molten globule and partially unfolded molecules detected under native conditions. Nat. Struct. Biol. 1997;4:298–304. doi: 10.1038/nsb0497-298. [DOI] [PubMed] [Google Scholar]
- 22.Sinha K.K., Udgaonkar J.B. Early events in protein folding. Curr. Sci. 2009;96:1053–1070. [Google Scholar]
- 23.Jha S.K., Dhar D., Udgaonkar J.B. Continuous dissolution of structure during the unfolding of a small protein. Proc. Natl. Acad. Sci. USA. 2009;106:11113–11118. doi: 10.1073/pnas.0812564106. [DOI] [PMC free article] [PubMed] [Google Scholar]
- 24.Juneja J., Udgaonkar J.B. Characterization of the unfolding of ribonuclease a by a pulsed hydrogen exchange study: evidence for competing pathways for unfolding. Biochemistry. 2002;41:2641–2654. doi: 10.1021/bi011480p. [DOI] [PubMed] [Google Scholar]
- 25.Cellitti J., Bernstein R., Marqusee S. Exploring subdomain cooperativity in T4 lysozyme II: uncovering the C-terminal subdomain as a hidden intermediate in the kinetic folding pathway. Protein Sci. 2007;16:852–862. doi: 10.1110/ps.062632807. [DOI] [PMC free article] [PubMed] [Google Scholar]
- 26.Wani A.H., Udgaonkar J.B. Revealing a concealed intermediate that forms after the rate-limiting step of refolding of the SH3 domain of PI3 kinase. J. Mol. Biol. 2009;387:348–362. doi: 10.1016/j.jmb.2009.01.060. [DOI] [PubMed] [Google Scholar]
- 27.Wani A.H., Udgaonkar J.B. Native state dynamics drive the unfolding of the SH3 domain of PI3 kinase at high denaturant concentration. Proc. Natl. Acad. Sci. USA. 2009;106:20711–20716. doi: 10.1073/pnas.0908617106. [DOI] [PMC free article] [PubMed] [Google Scholar]
- 28.Dasgupta A., Udgaonkar J.B. Four-state folding of a SH3 domain: salt-induced modulation of the stabilities of the intermediates and native state. Biochemistry. 2012;51:4723–4734. doi: 10.1021/bi300223b. [DOI] [PubMed] [Google Scholar]
- 29.Sridevi K., Udgaonkar J.B. Unfolding rates of barstar determined in native and low denaturant conditions indicate the presence of intermediates. Biochemistry. 2002;41:1568–1578. doi: 10.1021/bi011494v. [DOI] [PubMed] [Google Scholar]
- 30.Agashe V.R., Schmid F.X., Udgaonkar J.B. Thermodynamics of the complex protein unfolding reaction of barstar. Biochemistry. 1997;36:12288–12295. doi: 10.1021/bi971062d. [DOI] [PubMed] [Google Scholar]
- 31.Hughson F.M., Wright P.E., Baldwin R.L. Structural characterization of a partly folded apomyoglobin intermediate. Science. 1990;249:1544–1548. doi: 10.1126/science.2218495. [DOI] [PubMed] [Google Scholar]
- 32.Swaminathan R., Periasamy N., Krishnamoorthy G. Molten globule-like conformation of barstar: a study by fluorescence dynamics. J. Phys. Chem. 1994;98:9270–9278. [Google Scholar]
- 33.Mok K.H., Nagashima T., Dobson C.M. Multiple subsets of side-chain packing in partially folded states of α-lactalbumins. Proc. Natl. Acad. Sci. USA. 2005;102:8899–8904. doi: 10.1073/pnas.0500661102. [DOI] [PMC free article] [PubMed] [Google Scholar]
- 34.Armstrong B.D., Choi J., Han S. Site-specific hydration dynamics in the nonpolar core of a molten globule by dynamic nuclear polarization of water. J. Am. Chem. Soc. 2011;133:5987–5995. doi: 10.1021/ja111515s. [DOI] [PMC free article] [PubMed] [Google Scholar]
- 35.Sridevi K., Juneja J., Udgaonkar J.B. The slow folding reaction of barstar: the core tryptophan region attains tight packing before substantial secondary and tertiary structure formation and final compaction of the polypeptide chain. J. Mol. Biol. 2000;302:479–495. doi: 10.1006/jmbi.2000.4060. [DOI] [PubMed] [Google Scholar]
- 36.Sridevi K., Lakshmikanth G.S., Udgaonkar J.B. Increasing stability reduces conformational heterogeneity in a protein folding intermediate ensemble. J. Mol. Biol. 2004;337:699–711. doi: 10.1016/j.jmb.2003.12.083. [DOI] [PubMed] [Google Scholar]
- 37.Swaminathan R., Nath U., Krishnamoorthy G. Motional dynamics of a buried tryptophan reveals the presence of partially structured forms during denaturation of barstar. Biochemistry. 1996;35:9150–9157. doi: 10.1021/bi9603478. [DOI] [PubMed] [Google Scholar]
- 38.Zaidi F.N., Nath U., Udgaonkar J.B. Multiple intermediates and transition states during protein unfolding. Nat. Struct. Biol. 1997;4:1016–1024. doi: 10.1038/nsb1297-1016. [DOI] [PubMed] [Google Scholar]
- 39.Bhuyan A.K., Udgaonkar J.B. Two structural subdomains of barstar detected by rapid mixing NMR measurement of amide hydrogen exchange. Proteins. 1998;30:295–308. [PubMed] [Google Scholar]
- 40.Ramachandran S., Rami B.R., Udgaonkar J.B. Measurements of cysteine reactivity during protein unfolding suggest the presence of competing pathways. J. Mol. Biol. 2000;297:733–745. doi: 10.1006/jmbi.2000.3605. [DOI] [PubMed] [Google Scholar]
- 41.Sridevi K., Udgaonkar J.B. Surface expansion is independent of and occurs faster than core solvation during the unfolding of barstar. Biochemistry. 2003;42:1551–1563. doi: 10.1021/bi0268697. [DOI] [PubMed] [Google Scholar]
- 42.Sinha K.K., Udgaonkar J.B. Barrierless evolution of structure during the submillisecond refolding reaction of a small protein. Proc. Natl. Acad. Sci. USA. 2008;105:7998–8003. doi: 10.1073/pnas.0803193105. [DOI] [PMC free article] [PubMed] [Google Scholar]
- 43.Chalikian T.V., Gindikin V.S., Breslauer K.J. Volumetric characterizations of the native, molten globule and unfolded states of cytochrome c at acidic pH. J. Mol. Biol. 1995;250:291–306. doi: 10.1006/jmbi.1995.0377. [DOI] [PubMed] [Google Scholar]
- 44.Kamei T., Oobatake M., Suzuki M. Hydration of apomyoglobin in native, molten globule, and unfolded states by using microwave dielectric spectroscopy. Biophys. J. 2002;82:418–425. doi: 10.1016/S0006-3495(02)75406-4. [DOI] [PMC free article] [PubMed] [Google Scholar]
- 45.Itzhaki L.S., Evans P.A., Radford S.E. Tertiary interactions in the folding pathway of hen lysozyme: kinetic studies using fluorescent probes. Biochemistry. 1994;33:5212–5220. doi: 10.1021/bi00183a026. [DOI] [PubMed] [Google Scholar]
- 46.Arai M., Kuwajima K. Rapid formation of a molten globule intermediate in refolding of α-lactalbumin. Fold. Des. 1996;1:275–287. doi: 10.1016/s1359-0278(96)00041-7. [DOI] [PubMed] [Google Scholar]
- 47.Kiefhaber T., Schmid F.X., Chaffotte A. Structure of a rapidly formed intermediate in ribonuclease T1 folding. Protein Sci. 1992;1:1162–1172. doi: 10.1002/pro.5560010910. [DOI] [PMC free article] [PubMed] [Google Scholar]
- 48.Lehrer S.S. Solute perturbation of protein fluorescence. The quenching of the tryptophyl fluorescence of model compounds and of lysozyme by iodide ion. Biochemistry. 1971;10:3254–3263. doi: 10.1021/bi00793a015. [DOI] [PubMed] [Google Scholar]
- 49.Eftink M.R., Ghiron C.A. Indole fluorescence quenching studies on proteins and model systems: use of the inefficient quencher succinimide. Biochemistry. 1984;23:3891–3899. [Google Scholar]
- 50.Eftink M.R., Ghiron C.A. Dynamics of a protein matrix revealed by fluorescence quenching. Proc. Natl. Acad. Sci. USA. 1975;72:3290–3294. doi: 10.1073/pnas.72.9.3290. [DOI] [PMC free article] [PubMed] [Google Scholar]
- 51.Eftink M.R., Hagaman K.A. Fluorescence quenching of the buried tryptophan residue of cod parvalbumin. Biophys. Chem. 1985;22:173–180. doi: 10.1016/0301-4622(85)80040-5. [DOI] [PubMed] [Google Scholar]
- 52.Strambini G.B., Gonnelli M. Fluorescence quenching of buried Trp residues by acrylamide does not require penetration of the protein fold. J. Phys. Chem. B. 2010;114:1089–1093. doi: 10.1021/jp909567q. [DOI] [PubMed] [Google Scholar]
- 53.Pradeep L., Udgaonkar J.B. Differential salt-induced stabilization of structure in the initial folding intermediate ensemble of barstar. J. Mol. Biol. 2002;324:331–347. doi: 10.1016/s0022-2836(02)01068-9. [DOI] [PubMed] [Google Scholar]
- 54.Nath U., Udgaonkar J.B. Folding of tryptophan mutants of barstar: evidence for an initial hydrophobic collapse on the folding pathway. Biochemistry. 1997;36:8602–8610. doi: 10.1021/bi970426z. [DOI] [PubMed] [Google Scholar]
- 55.Lakshmikanth G.S., Sridevi K., Udgaonkar J.B. Structure is lost incrementally during the unfolding of barstar. Nat. Struct. Biol. 2001;8:799–804. doi: 10.1038/nsb0901-799. [DOI] [PubMed] [Google Scholar]
- 56.Schulman B.A., Kim P.S., Redfield C. A residue-specific NMR view of the non-cooperative unfolding of a molten globule. Nat. Struct. Biol. 1997;4:630–634. doi: 10.1038/nsb0897-630. [DOI] [PubMed] [Google Scholar]
- 57.Dasgupta A., Udgaonkar J.B. Evidence for initial non-specific polypeptide chain collapse during the refolding of the SH3 domain of PI3 kinase. J. Mol. Biol. 2010;403:430–445. doi: 10.1016/j.jmb.2010.08.046. [DOI] [PubMed] [Google Scholar]
- 58.Jha S.K., Udgaonkar J.B. Free energy barriers in protein folding and unfolding. Curr. Sci. 2010;99:457–475. [Google Scholar]
- 59.Sinha K.K., Udgaonkar J.B. Dissecting the non-specific and specific components of the initial folding reaction of barstar by multi-site FRET measurements. J. Mol. Biol. 2007;370:385–405. doi: 10.1016/j.jmb.2007.04.061. [DOI] [PubMed] [Google Scholar]
- 60.Lakowicz J.R., Maliwal B.P., Balter A. Rotational freedom of tryptophan residues in proteins and peptides. Biochemistry. 1983;22:1741–1752. doi: 10.1021/bi00277a001. [DOI] [PMC free article] [PubMed] [Google Scholar]
- 61.Barshop B.A., Wrenn R.F., Frieden C. Analysis of numerical methods for computer simulation of kinetic processes: development of KINSIM—a flexible, portable system. Anal. Biochem. 1983;130:134–145. doi: 10.1016/0003-2697(83)90660-7. [DOI] [PubMed] [Google Scholar]
Associated Data
This section collects any data citations, data availability statements, or supplementary materials included in this article.