

Abstract
The mechanical properties of living cells are a label-free biophysical marker of cell viability and health; however, their use has been greatly limited by low measurement throughput. Although examining individual cells at high rates is now commonplace with fluorescence activated cell sorters, development of comparable techniques that nondestructively probe cell mechanics remains challenging. A fundamental hurdle is the signal response time. Where light scattering and fluorescence signatures are virtually instantaneous, the cell stress relaxation, typically occurring on the order of seconds, limits the potential speed of elastic property measurement. To overcome this intrinsic barrier to rapid analysis, we show here that cell viscoelastic properties measured at frequencies far higher than those associated with cell relaxation can be used as a means of identifying significant differences in cell phenotype. In these studies, we explore changes in erythrocyte mechanical properties caused by infection with Plasmodium falciparum and find that the elastic response alone fails to detect malaria at high frequencies. At timescales associated with rapid assays, however, we observe that the inelastic response shows significant changes and can be used as a reliable indicator of infection, establishing the dynamic viscoelasticity as a basis for nondestructive mechanical analogs of current high-throughput cell classification methods.
Introduction
Modern flow cytometers and fluorescence activated cell sorters have proven an indispensable tool to biomedical community laboratory researchers and clinicians. Avoiding the disadvantages of bulk methods where averaging can mask small subpopulations, these high-throughput instruments are capable of detecting and sorting individual cells at rates significantly higher than 1000 cells/s (1). Due to the potentially harmful effects of fluorescent labeling however, use of such techniques may impair investigations where postsorting cell viability is crucial. As a result but in an effort to retain the broad applicability of such cytometers, there has been increasing interest in label-free biomarkers that allow dependable and accurate cell classification. One such marker is the mechanical properties of individual cells, which have been shown to be a strong indicator of cell viability and health (2,3). These results have given rise to a variety of deformability targeted measurement techniques capable of probing the elastic properties of individual cells mechanically (4), in microchannel filters (5), employing electrical fields (6), dielectrophoresis (7), using inertial forces (8), by cell collisions (9), and by manipulation of attached beads (10). Investigating a variety of cellular systems including leukocytes (11), fibroblasts (12), and cancer cells (13,14), these methods have established wide applicability; however, due to the long measurement times associated with current nondestructive techniques, available methods have proven cumbersome and are limited to nonpopulation-based investigations.
To address these shortcomings, we employ a focused infrared laser trap to capture, align, and deform individual cells in an approach designed for high-throughput measurement. Optical tweezers (15) have proven a versatile tool for noncontact and sterile manipulation of microscopic and biological objects (16). In this, forces arising from the refraction of focused laser light have been used to determine cell elasticity via multiple traps directly (17,18) and indirectly (19,20) or with defocused counterpropagating laser beams (21,22), demonstrating its applicability to classification of biological systems at the individual cell level. Limiting broader utility, however, reported throughputs are still limited to ∼0.1 cells/s (23). As opposed to traditional approaches and using the intrinsic astigmatism of an inexpensive diode bar laser, we create instead a linear optical trap (24–26) that allows the translation of captured cells along the line while constricting motion in the perpendicular direction. Employing this technique, we have demonstrated the nondestructive stretching of cells in flowing environments (27) where we align the trap with flowing streamlines, efficiently elongating cells within a ravine-shaped potential landscape (28). In principle, feasible throughputs are limited only by the length of the trap and the speed of the detection scheme; however, as in all elasticity-based methods, this approach encounters a fundamental relaxation-based barrier that prevents implementation in high-throughput cytometry.
In addition to the practical challenges of probing individual cells at high throughput, any technique measuring cell mechanical properties must overcome the inherent fundamental limitation of mechanical cell relaxation to approach the utility of modern fluorescence activated cell sorters. When subjected to an external force, viscoelastic materials do not instantaneously respond and cell deformation measurements depend strongly on the frequency of the applied force. Elastic property measurements require a cell to equilibrate with the applied deforming force, setting an intrinsic speed limitation predefined by the cell characteristic relaxation dynamics. For red blood cells (RBCs), for example, the timescale of a Kelvin-Voigt model relaxation is of the order of ∼0.1 s (29) but stiffer cells can have relaxation times as high as 45 s (30), drastically constraining feasible sampling rates independent of the capabilities of the employed test method. To push potential throughputs of deformability-based techniques beyond this intrinsic barrier, an inherent physical and rapid mechanical biomarker is required that allows reliable cell classification at rates far faster than equilibrium timescales.
In pursuit of a mechanical biomarker that allows sampling rates beyond this physical limitation, we investigate the time-dependent mechanical properties of living cells, simulating a high-throughput scenario by employing high-frequency modulated deformation forces. Historically, due to their simplicity and lack of internal structure, the mechanical properties of RBCs have been extensively studied by micropipette aspiration (31), detecting a distinct increase in cell stiffness caused by an infection with malaria parasites (32–34). As a well-explored model system with substantial and well-quantified differences in cell deformability (35) we study the dynamic viscoelasticity of populations of 1800 of these individual cells, half malaria-infected and half uninfected erythrocytes. Although solution-based (36) and pharmacological (37,38) methods have also been shown to modify cell physical properties, we focus here on identifying biomarkers of infection by employing this well characterized disease. Our results show the previously observed stiffening of infected RBCs at equilibrium timescales, the failure of conventional techniques at high frequencies, and the utility of the cell viscosity as alternative, additional criteria for cell classification for nondestructive high-throughput measurements.
Materials and Methods
Blood samples
Blood samples were prepared by diluting 1.5 μl of fresh blood from anonymous donors in 500 μl of a 300 mOsm buffer solution, consisting of phosphate buffered saline solution, 1.47% sodium citrate, and 0.20% bovine serum albumin (BSA). Human erythrocytes were obtained from Interstate Blood Bank (Memphis, TN) and used for in vitro Plasmodium falciparum cultivation. Trophozoite-stage infected cells were enriched to >95% parasitemia by Percoll-sorbitol density gradient centrifugation (39) and frozen in glycerolyte 57 (Baxter Fenwal, Lake Zurich, IL). Cells were thawed using stepwise dilutions with hypertonic saline to reduce hemolysis. To exclude artifacts associated with freeze-thawing, we performed control measurements on frozen uninfected erythrocytes, showing no deviation from freshly drawn blood.
Microfluidic channels
We performed our experiments in straight microfluidic channels of dimensions 2 cm × 1000 μm × 10 μm, fabricated by common soft lithography methods (40,41). In this, a spin-coated layer of KMPR 1010 (Microchem, Newton, MA) was exposed through a mask by ultraviolet light, generating a template of the desired channel structure. Polydimethylsiloxane (PDMS, Dow Corning, Midland, MI) was poured over this template and polymerized, leaving the imprints of the channel relief in the cured polymer. Cured PDMS was then plasma-bonded to glass coverslips, sealing the channel structures. Inlets and outlets were punched through the PDMS layer and tubing attached to deliver blood sample solutions and control flow rates. Channels were rinsed with buffer solution ∼3 h before the experiments to allow the adhesion of BSA to channel walls to prevent cell adhesion.
Modulated linear optical traps
To create linear optical traps, we imaged the astigmatic beam of a laser diode (2495-Y-5.0 W, 810 nm, JDSU, Milpitas, CA) with an emitter of size 1 μm × 100 μm using a 20× objective (APlan 20×/0.45, Zeiss, Jena, Germany). As shown in Fig. 1, the beam is reflected at a dichroic mirror and refocused by a 40× microscope objective (UPlanApo 40×/0.85, Olympus, PA) into the sample plane, generating a linear optical trap of dimension 0.94 μm × 40 μm. Beam properties in the focus were measured employing a razor blade method for beam characterization and modeling (28). For illumination, we used a 12 W white light LED (430 Lumen Cool-White, Cree, NC) employing condenser lenses and a 10× microscope objective (10×/0.25, Edmund Optics, Barrington, NJ). The sample plane was imaged by the same objective focusing the laser to a digital camera through the dichroic mirror. We employed a high-speed CMOS camera system (Silicon Video 643 M, EPIX, Buffalo Grove, IL) to record the region of interest (100 × 100 pixels, 29 μm × 29 μm) at 1000 frames/s.
Figure 1.

(a) Illustration of linear optical tweezers: the astigmatic beam of a laser diode bar emitting infrared light at 810 nm from a 1 μm × 100 μm area is imaged using a 20× microscope objective and refocused using a 40× objective into a microfluidic channel containing a cell solution. The sample is illuminated using a 12 W LED and imaged to a high-speed CMOS camera system recording at 1000 fps. A frequency generator is employed to oscillate the laser intensity, while the original modulation signal and the cell response are recorded on a computer. (b) The anisotropy of optical forces exerted on a captured RBC by the linear optical trap generates directed cell deformation along the trap axis. To see this figure in color, go online.
The employed linear traps constrict the motion of captured microscopic objects in one dimension while allowing translation in the other. In general, when focused laser light hits a surface of higher refractive index than the surrounding medium, momentum is transferred, generating restoring forces directed toward the focus center. In trapping soft objects such as biological cells, however, this transfer of momentum leads to additional local stresses within the membrane surface. As demonstrated previously, the asymmetric distribution of laser light inherent to our linear traps generates anisotropic optical forces and induces axial, antipodal stretching forces and cell elongation along the trap long axis (28) (Fig. 1 b). For static measurements, we employed moderate laser powers of 95 mW distributed over the linear trap, limiting the exposure per cell to ∼20 mW and preventing radiation damage (42). To ensure viability, long-term measurements have been performed with continuous, repeated cell stretching over several minutes at different frequencies with no observable changes in elastic behavior.
Frequency sweep measurements
To obtain a comprehensive picture of the complex mechanical characteristics of probed cells, we investigated their viscoelastic behavior when exposed to oscillating optical force loading in the absence of external flow. Membrane viscosity is responsible for the characteristic retardation of the cell response; therefore, we expect a phase shift between stimulus and response (Fig. 2) depending on the frequency of oscillation. We modulated the laser intensity using an external frequency generator coupled to the laser diode power source and subjected cells to oscillating optical stretching forces while recording their time-dependent response to the external loading. Employed frequencies ω ranged from 0.5 Hz, where full equilibrium cell stretching is achieved, to 200 Hz where it is not achieved. The upper limit is defined by the speed of our current detection method, a high-speed camera running at 1000 fps. To detect the phase shift between applied force and cell response, the original modulation signal of the frequency generator was read using a sound card (SB0570L4, Creative Labs, Milpitas, CA) and encoded in the brightness value of a corner pixel within recorded videos.
Figure 2.

We observe the characteristic delayed viscoelastic behavior of erythrocytes in response to external loading. Employing applied optical forces over a broad range of modulation frequencies, we measure the phase-shifted cell response depending on the timescales of applied loading. To see this figure in color, go online.
Image detection and data analysis
Analyzing the videos of cells stretched within the linear optical trap, the brightness of the pixel encoding the original modulation signal was read and its time variation fit by a sine function to capture any deviation from frequency generator predefined values. To analyze the cell response to the modulated stimulus we employed custom image detection software. Video quality was improved by subtracting the previously recorded fixed-pattern noise, resulting in background corrected images. Each frame was converted into a binary b/w image using a preset threshold value, enabling the detection of cell contours. We fit ellipses to these contours, obtaining subpixel resolution of the cell dimensions and other parameters from the orientation and length of long and short axes of the ellipse.
Employing this method to measure the dimensions of rigid colloidal beads of well-known size indicated an inherent random noise with magnitudes of the order of ∼20 nm associated with the applied algorithms. To detect even smaller amplitudes of cell stretch, each video covered several 10 to 100 oscillations, allowing averaging over multiple data points with an identical phase of modulation, gaining one mean period of oscillation with significantly reduced noise, as shown in Fig. 3 a for a modulation frequency of 1 Hz. A sine function is fit to this averaged period to determine amplitude and phase of the cell response to the modulated external force. Fig. 3 b compares this fit to the mean deformation cycle and the raw data acquired in ∼20 s, illustrating the reduction of noise due to the applied averaging algorithm. Even higher sensitivity can be achieved by increasing the number of periods for averaging. At high modulation frequencies with averaging over several 100 deformation cycles we were able to resolve amplitudes down to ∼2 nm. The accuracy of the detection of such small deformations is supported by the consistency of the measured phase of the cell response with respect to the applied external stimulus as a control parameter.
Figure 3.

(a) Mean period of oscillation from averaging over all data points with identical phase. A sine function is fitted to the mean deformation to determine amplitude and phase shift of the cell response with respect to the external signal. (b) Raw data and fit function obtained from the mean cell deformation. To see this figure in color, go online.
High-throughput measurements
Based on the insights gained from the measured viscoelastic properties of cells in static systems over a frequency range of almost three orders of magnitude, we investigated cell behavior in flowing environments. To test the limits of our current configuration, samples containing 60 μl blood per ml BSA solution were flushed through the microfluidic channels at 500–750 μm/s driven by gravity. To minimize the probing time of an individual cell while acquiring sufficient video data per period, the optical trap was modulated at 100 Hz. To facilitate detection, laser intensity distributed over the entire trap was increased to 405 mW resulting in a larger cell deformation with <80 mW exposure per cell. With two full periods of oscillation required for our detection algorithm, the minimum passage time of an individual cell through the linear optical trap was 20 ms, well below typical relaxation timescales. Long-term studies to test the viability of cells at these increased laser intensities showed variations in cell deformability and appearance only after >30–60 s, orders of magnitude above actual exposure times used in our measurements.
Results and Discussion
In general, viscoelastic materials exhibit complex mechanical behavior, showing classic elastic and viscous characteristics when undergoing deformation. When subject to external loading, a viscoelastic sample does not instantaneously respond but gradually deforms as governed by its characteristic stress relaxation creep. The resulting degree of stretch when exposed to a defined external force of given magnitude strongly depends on the timescale of applied loading. Therefore, when investigating the mechanical properties of cells, measurements of elasticity alone may lead to ambiguous results when determined at timescales that do not allow the cell to equilibrate with the stretching force field. For slow techniques measuring only a few cells, this is negligible and not a concern; however, high-throughput applications with rapid measurement rates must move beyond a pure elasticity-based cell classification.
To investigate the time-dependent viscoelastic behavior of uninfected and malaria-infected erythrocytes, we subject individual cells to oscillating loading, covering a frequency range of nearly three orders of magnitude. In this, each cell is exposed to moderate laser powers of <20 mW for 10 s at high frequencies and up to 30 s at low frequencies and released after each measurement to prevent cell damage due to long-term laser radiation exposure. The observed distribution of relative stretching amplitudes of ∼100 cells per cell type and frequency is shown in Fig. 4 to quantify the spread, with the measured elongation and the long axis of the cell. We fit a Gaussian to each distribution and plot center value and one standard deviation as error bars in Fig. 5 a. In agreement with single-cell, zero-frequency methods, distinctly reduced infected-cell deformability is observed at timescales well above the typical reported relaxation times of (29). For this near-equilibrium cell stretching, we detect a reduction in cell deformability of a factor of ∼2.5, a value that agrees well with equilibrium measurements performed with other techniques including atomic force microscopy (43,44), bead-based (45), and optical manipulation (46).
Figure 4.

Measured distributions of cell deformation for ∼100 cells for each modulation frequencies and cell type. At near-equilibrium frequencies, a distinctly reduced deformability of infected erythrocytes is confirmed, whereas at higher frequencies samples become undistinguishable based on degree of stretching alone. To see this figure in color, go online.
Figure 5.

Frequency sweep of (a) relative cell deformation and (b) phase shift between stimulus and cell response, where error bars visualize one standard deviation of the observed experimental spread and lines are used to guide the eye. Although cell elasticity fails as a criterion for classification at high frequencies, cell viscosity manifesting in observed phase shift, allows identification of infected erythrocytes. To see this figure in color, go online.
At higher modulation frequencies, however, cells are unable to equilibrate with the external force field and viscous creep prevents them from reaching full extension. As a result, we observe a decreasing deformability with increasing modulation frequency for both populations and cells that appear stiffer. The measured stretch of uninfected cells decays more rapidly with increasing frequency when compared to infected erythrocytes, therefore leading to a crossover of detected deformation. The data show a distinct overlap of the measured elongation of both cell populations at timescales approaching the cell’s relaxation dynamics and below. At these high frequencies, identification of infection based on the measured degree of stretch fails, demonstrating a limit to the feasible throughputs of any deformability-based cytometer. From this it is clear that classification of cell behavior based on elasticity alone neglects the viscoelastic nature of their mechanical properties and confines applicability within the temporal limits imposed by near-equilibrium processes.
Our measurements show that malaria infection and the accompanying stiffening of the cell cytoskeleton (34) not only affects erythrocyte elasticity but also significantly alters viscous properties. The viscous contribution to the stretching behavior of viscoelastic materials such as the cell membrane manifests in a delay of the mechanical response to external loading. When subject to oscillating forces, the deformation of such materials follows the external stimulus with a characteristic phase lag. Fig. 5 b shows the measured phase shift δ between stimulus and response for both populations as the modulation frequency is varied. Although we observe a steep increase in phase difference for uninfected cells with increasing modulation frequency, reaching a plateau at δ = π/4 within the employed frequency range, infected erythrocytes demonstrate a distinctly reduced lag and a maximum of δ = π/8. Compared to uninfected RBCs, the behavior of infected erythrocytes can be described as more solid-like with a more immediate response to external loading. This difference in the reaction time of both populations explains the observed crossover in the frequency-dependent stretching in Fig. 5 a, where the stiffer malaria-infected cells are less affected by increasing modulation frequencies.
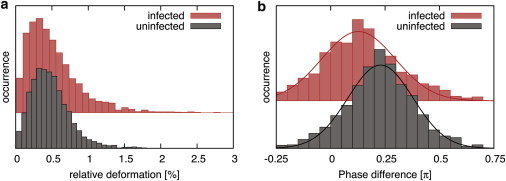
Measuring the viscous contribution to the stretching behavior provides an additional cell mechanical biomarker that can be employed to characterize and classify cellular systems at much faster timescales than the near-equilibrium elasticity measurements. To demonstrate this, we show the distributions of relative stretch and phase difference for nonequilibrium cell deformation at frequencies ≥5 Hz in Figs. 6, a and b. Note that there is significant overlap in the scatter in the elastic response in Fig. 6 a but clear domains of infected and uninfected cells apparent in the inelastic response in Fig. 6 b; employing these mechanical behavior differences as an additional signature of infection enables reliable cell classification beyond equilibrium timescales where purely elasticity-based methods fail.
Figure 6.

(a) Scatter plot of measured deformations and (b) phase differences at nonequilibrium frequencies ≥5 Hz (1200 cells) show the applicability of cell viscosity to identify a malaria infection at high frequencies where elasticity fails. Ellipses are used to guide the eye. To see this figure in color, go online.
The relevance of these findings is not limited to dynamic stretching with periodic loading but also impacts static cell deformation measurements with simple stretch-and-release protocols. Cell viscosity in general manifests in the delayed material response to external loading, the so-called creep, and therefore is seen not only in the phase-shifted oscillating stretching but also in the characteristic cell relaxation dynamics. Based on our measurements and other work (32), we anticipate significant differences in the deformation decay rate of infected and uninfected cells exposed to static forces. A measure of these time-dependent viscoelastic properties is given by the complex shear modulus with storage modulus and loss modulus with membrane stress , relative strain , and phase shift .
Although qualitative identification of subpopulations is sufficient for many applications, we estimate the inner-membrane stress σ generated by optical forces by employing ray-tracing simulations (47) to quantify the dynamic elastic modulus of cells. In our calculations, the laser is modeled as an array of individual light rays using experimentally measured geometrical parameters of the Gaussian beam profile. A model cell placed in the laser focus refracts incoming light according to Snell’s law. The gain of momentum and the change of light direction are balanced by an opposing momentum transferred to the cell membrane, inducing local deformation. With this, the distribution of optical forces over the cell surface can be calculated and the generated inner-membrane stress σ responsible for elongation along the linear trap axis determined (28).
Figs. 7, a and b, show the frequency dependence of the measured storage modulus and loss modulus for infected and uninfected RBC populations, where σ is determined using our simulations and ε and δ drawn from the experimental data of Fig. 5 a and b. Error bars are derived from the standard deviations of the deformability and phase difference distributions, providing a measure for the spread of population-based experiments. For uninfected erythrocytes the storage modulus of , normalized by the cell membrane thickness h, agrees well with results of conventional equilibrium techniques at low frequency (11). Malaria infection significantly stiffens the cell, leading to an increased equilibrium shear modulus of . At increasing frequencies, the storage moduli of both populations converge, eliminating elasticity alone as a mechanical property biomarker at those measurement timescales.
Figure 7.

(a) Storage and (b) loss moduli of infected and uninfected erythrocytes calculated from measured deformation parameters and ray-tracing simulations. The storage module of both cell types cross at moderate and overlap at high frequencies, whereas the loss modulus allows a clear identification of each type. Error bars indicate the spread of measured cell populations with lines provided to guide the eye. To see this figure in color, go online.
As shown in Fig. 7 b, the loss moduli of infected and uninfected erythrocytes converge at low frequencies for near-equilibrium cell stretching. Within the measured frequency range, the loss moduli of both cell types follows a power law , with coefficients α = 0.70 ± 0.01 for uninfected and 0.45 ± 0.04 for infected cells. This difference in power-law behavior leads to a full order of magnitude difference in at 200 Hz and a clear signal for infection at high frequencies.
Having studied and characterized the viscoelastic behavior of the probed cell populations over a broad frequency range, we investigate cells in a flowing environment to demonstrate its utility in mechanical property-based cytometry application. To maximize throughput here, dense blood solutions were flushed through the microfluidic channel at 500–750 μm/s, whereas the laser intensity was increased to 405 mW at 100 Hz to facilitate the detection. Fig. 8 shows the measured distributions of relative cell deformation and phase shift for a population of ∼3000 cells of infected and uninfected erythrocytes recorded at rates >20 cells/s. The detected spread of the data is broader than the static measurements due to the reduced timescales in the high-throughput measurements with standard deviations of for uninfected and for infected RBCs. The center values of the distributions at for uninfected and for infected erythrocytes, however, agree well with the values determined in the data sets recorded in the absence of flow. A two-sample t-test was performed for these distributions with the null hypothesis tested at a significance level of 0.1%. Throughputs in our experiments are currently limited primarily by the speed of our imaging and detection; in principle, significantly faster rates employing higher modulation frequencies are feasible with more rapid measurement methods.
Figure 8.
Distributions of the recorded deformation (a) and phase shift (b) measured at frequencies of 100 Hz at rates of >20 cells/s of infected and uninfected populations of ∼3000 cells. To see this figure in color, go online.
Conclusions
In this work, we have investigated the dynamic viscoelastic behavior of RBCs and their time-dependent mechanical response to applied oscillating external forces. Because the response of viscoelastic materials such as cells depend strongly on the timescales of applied forces, single cell measurements in full equilibrium can differ significantly from those of high-throughput measurements with correspondingly rapid probing. Therefore, investigating solely the low-frequency elasticity of cells as an indicator of infection or disease may be insufficient for a definitive classification based on abnormal mechanical behavior. We demonstrate this by probing the dynamic behavior of uninfected and malaria-infected RBCs as a well-explored model system with known variations in cell mechanical properties. Although there are numerous techniques that can detect the increased stiffness caused by infection in an individual cell in full equilibrium, our experiments indicate that those differences become undetectable at shorter timescales where cells are unable to equilibrate. This shows that a cell classification based on elasticity alone fails in a high-throughput scenario, limiting elastic-based techniques to slow equilibrium processes.
To extend the utility of mechanical property-based cell characterization to high-throughput applications and nonequilibrium individual cell probing, the complete viscoelastic behavior can be extremely useful. Our measurements of RBC properties indicate that the presence of infection not only influences the elasticity of the cell cytoskeleton but also alters viscous dissipation. No method to date has shown the potential for truly high throughput probing of cell mechanical properties without cell damage, and we demonstrate here that viscous signatures of infection can be employed as a broader biomarker, circumventing the limitation of purely deformability-based techniques. Testing the current capacities of our technique, we have probed cell viscoelasticity at rates of >20 cells/s, a throughput well below equilibrium relaxation timescales. With these and potentially much faster measurement rates, extension to other systems such as cancer where cell mechanical properties and function are tightly linked becomes a feasible goal.
Acknowledgments
We acknowledge support from the National Science Foundation grant No. DBI-0852868, the National Institutes of Health under grant No. 1R01 AI079347, and the Intramural Research Program of the National Institutes of Health, National Institute of Allergy and Infectious Diseases.
References
- 1.Bonner W.A., Hulett H.R., Herzenberg L.A. Fluorescence activated cell sorting. Rev. Sci. Instrum. 1972;43:404–409. doi: 10.1063/1.1685647. [DOI] [PubMed] [Google Scholar]
- 2.Suresh S., Spatz J., Seufferlein T. Connections between single-cell biomechanics and human disease states: gastrointestinal cancer and malaria. Acta Biomater. 2005;1:15–30. doi: 10.1016/j.actbio.2004.09.001. [DOI] [PubMed] [Google Scholar]
- 3.Suresh S. Biomechanics and biophysics of cancer cells. Acta Biomater. 2007;3:413–438. doi: 10.1016/j.actbio.2007.04.002. [DOI] [PMC free article] [PubMed] [Google Scholar]
- 4.Hochmuth R.M. Micropipette aspiration of living cells. J. Biomech. 2000;33:15–22. doi: 10.1016/s0021-9290(99)00175-x. [DOI] [PubMed] [Google Scholar]
- 5.Preira P., Grandné V., Theodoly O. Passive circulating cell sorting by deformability using a microfluidic gradual filter. Lab Chip. 2013;13:161–170. doi: 10.1039/c2lc40847c. [DOI] [PubMed] [Google Scholar]
- 6.Engelhardt H., Gaub H., Sackmann E. Viscoelastic properties of erythrocyte membranes in high-frequency electric fields. Nature. 1984;307:378–380. doi: 10.1038/307378a0. [DOI] [PubMed] [Google Scholar]
- 7.Guido I., Jaeger M.S., Duschl C. Dielectrophoretic stretching of cells allows for characterization of their mechanical properties. Eur. Biophys. J. 2011;40:281–288. doi: 10.1007/s00249-010-0646-3. [DOI] [PubMed] [Google Scholar]
- 8.Gossett D.R., Tse H.T.K., Di Carlo D. Hydrodynamic stretching of single cells for large population mechanical phenotyping. Proc. Natl. Acad. Sci. USA. 2012;109:7630–7635. doi: 10.1073/pnas.1200107109. [DOI] [PMC free article] [PubMed] [Google Scholar]
- 9.Roth K.B., Eggleton C.D., Marr D.W.M. Measuring cell mechanics by optical alignment compression cytometry. Lab Chip. 2013;13:1571–1577. doi: 10.1039/c3lc41253a. [DOI] [PMC free article] [PubMed] [Google Scholar]
- 10.Puig-de-Morales-Marinkovic M., Turner K.T., Suresh S. Viscoelasticity of the human red blood cell. Am. J. Physiol. Cell Physiol. 2007;293:C597–C605. doi: 10.1152/ajpcell.00562.2006. [DOI] [PubMed] [Google Scholar]
- 11.Hochmuth R.M. Measuring the mechanical properties of individual human blood cells. J. Biomech. Eng. 1993;115(4B):515–519. doi: 10.1115/1.2895533. [DOI] [PubMed] [Google Scholar]
- 12.Wottawah F., Schinkinger S., Käs J. Optical rheology of biological cells. Phys. Rev. Lett. 2005;94:098103. doi: 10.1103/PhysRevLett.94.098103. [DOI] [PubMed] [Google Scholar]
- 13.Guck J., Schinkinger S., Bilby C. Optical deformability as an inherent cell marker for testing malignant transformation and metastatic competence. Biophys. J. 2005;88:3689–3698. doi: 10.1529/biophysj.104.045476. [DOI] [PMC free article] [PubMed] [Google Scholar]
- 14.Jonietz E. Mechanics: the forces of cancer. Nature. 2012;491:S56–S57. doi: 10.1038/491s56a. [DOI] [PubMed] [Google Scholar]
- 15.Ashkin A., Dziedzic J.M., Chu S. Observation of a single-beam gradient force optical trap for dielectric particles. Opt. Lett. 1986;11:288–290. doi: 10.1364/ol.11.000288. [DOI] [PubMed] [Google Scholar]
- 16.Ashkin A., Dziedzic J.M. Optical trapping and manipulation of viruses and bacteria. Science. 1987;235:1517–1520. doi: 10.1126/science.3547653. [DOI] [PubMed] [Google Scholar]
- 17.Liao G.B., Bareil P.B., Chiou A. One-dimensional jumping optical tweezers for optical stretching of bi-concave human red blood cells. Opt. Express. 2008;16:1996–2004. doi: 10.1364/oe.16.001996. [DOI] [PubMed] [Google Scholar]
- 18.Rancourt-Grenier S., Wei M.T., Sheng Y.L. Dynamic deformation of red blood cell in dual-trap optical tweezers. Opt. Express. 2010;18:10462–10472. doi: 10.1364/OE.18.010462. [DOI] [PubMed] [Google Scholar]
- 19.Lim C.T., Dao M., Chew K.T. Large deformation of living cells using laser traps. Acta Mater. 2004;52:1837–1845. [Google Scholar]
- 20.Dao M., Lim C.T., Suresh S. Mechanics of the human red blood cell deformed by optical tweezers. J. Mech. Phys. Solids. 2005;53:493–494. [Google Scholar]
- 21.Guck J., Ananthakrishnan R., Käs J. Optical deformability of soft biological dielectrics. Phys. Rev. Lett. 2000;84:5451–5454. doi: 10.1103/PhysRevLett.84.5451. [DOI] [PubMed] [Google Scholar]
- 22.Guck J., Ananthakrishnan R., Käs J. The optical stretcher: a novel laser tool to micromanipulate cells. Biophys. J. 2001;81:767–784. doi: 10.1016/S0006-3495(01)75740-2. [DOI] [PMC free article] [PubMed] [Google Scholar]
- 23.Lincoln B., Wottawah F., Guck J. High-throughput rheological measurements with an optical stretcher. Methods Cell Biol. 2007;83:397–423. doi: 10.1016/S0091-679X(07)83017-2. [DOI] [PubMed] [Google Scholar]
- 24.Applegate R.W., Jr., Squier J., Marr D.W.M. Optical trapping, manipulation, and sorting of cells and colloids in microfluidic systems with diode laser bars. Opt. Express. 2004;12:4390–4398. doi: 10.1364/opex.12.004390. [DOI] [PubMed] [Google Scholar]
- 25.Applegate R.W., Jr., Squier J., Said A.A. Microfluidic sorting system based on optical waveguide integration and diode laser bar trapping. Lab Chip. 2006;6:422–426. doi: 10.1039/b512576f. [DOI] [PubMed] [Google Scholar]
- 26.Applegate R.W., Jr., Marr D.W.M., Graves S.W. Particle size limits when using optical trapping and deflection of particles for sorting using diode laser bars. Opt. Express. 2009;17:16731–16738. doi: 10.1364/OE.17.016731. [DOI] [PubMed] [Google Scholar]
- 27.Sraj I., Szatmary A.C., Eggleton C.D. Erythrocyte deformation in high-throughput optical stretchers. Phys. Rev. E Stat. Nonlin. Soft Matter Phys. 2012;85:041923. doi: 10.1103/PhysRevE.85.041923. [DOI] [PMC free article] [PubMed] [Google Scholar]
- 28.Sawetzki T., Eggleton C.D., Marr D.W.M. Cell elongation via intrinsic antipodal stretching forces. Phys. Rev. E Stat. Nonlin. Soft Matter Phys. 2012;86:061901. doi: 10.1103/PhysRevE.86.061901. [DOI] [PMC free article] [PubMed] [Google Scholar]
- 29.Hochmuth R.M., Worthy P.R., Evans E.A. Red cell extensional recovery and the determination of membrane viscosity. Biophys. J. 1979;26:101–114. doi: 10.1016/S0006-3495(79)85238-8. [DOI] [PMC free article] [PubMed] [Google Scholar]
- 30.Liu X.Y., Wang Y.F., Sun Y. Cell contour tracking and data synchronization for real-time, high-accuracy micropipette aspiration. IEEE Trans. Autom. Sci. Eng. 2009;6:536–543. [Google Scholar]
- 31.Evans E.A., Hochmuth R.M. Membrane viscoelasticity. Biophys. J. 1976;16:1–11. doi: 10.1016/S0006-3495(76)85658-5. [DOI] [PMC free article] [PubMed] [Google Scholar]
- 32.Nash G.B., O’Brien E., Dormandy J.A. Abnormalities in the mechanical properties of red blood cells caused by Plasmodium falciparum. Blood. 1989;74:855–861. [PubMed] [Google Scholar]
- 33.Ballas S.K., Smith E.D. Red blood cell changes during the evolution of the sickle cell painful crisis. Blood. 1992;79:2154–2163. [PubMed] [Google Scholar]
- 34.Glenister F.K., Coppel R.L., Cooke B.M. Contribution of parasite proteins to altered mechanical properties of malaria-infected red blood cells. Blood. 2002;99:1060–1063. doi: 10.1182/blood.v99.3.1060. [DOI] [PubMed] [Google Scholar]
- 35.Suresh S. Mechanical response of human red blood cells in health and disease: some structure-property-function relationships. J. Mater. Res. 2006;21:1871–1877. [Google Scholar]
- 36.Kim Y.R., Ornstein L. Isovolumetric sphering of erythrocytes for more accurate and precise cell volume measurement by flow cytometry. Cytometry. 1983;3:419–427. doi: 10.1002/cyto.990030606. [DOI] [PubMed] [Google Scholar]
- 37.Rotsch C., Radmacher M. Drug-induced changes of cytoskeletal structure and mechanics in fibroblasts: an atomic force microscopy study. Biophys. J. 2000;78:520–535. doi: 10.1016/S0006-3495(00)76614-8. [DOI] [PMC free article] [PubMed] [Google Scholar]
- 38.Hoffman B.D., Crocker J.C. Cell mechanics: dissecting the physical responses of cells to force. Annu. Rev. Biomed. Eng. 2009;11:259–288. doi: 10.1146/annurev.bioeng.10.061807.160511. [DOI] [PubMed] [Google Scholar]
- 39.Pillai A.D., Pain M., Desai S.A. A cell-based high-throughput screen validates the plasmodial surface anion channel as an antimalarial target. Mol. Pharmacol. 2010;77:724–733. doi: 10.1124/mol.109.062711. [DOI] [PMC free article] [PubMed] [Google Scholar]
- 40.Xia Y.N., Whitesides G.M. Soft lithography. Annu. Rev. Mater. Sci. 1998;28:153–184. [Google Scholar]
- 41.Duffy D.C., McDonald J.C., Whitesides G.M. Rapid prototyping of microfluidic systems in poly(dimethylsiloxane) Anal. Chem. 1998;70:4974–4984. doi: 10.1021/ac980656z. [DOI] [PubMed] [Google Scholar]
- 42.Ashkin A., Dziedzic J.M., Yamane T. Optical trapping and manipulation of single cells using infrared laser beams. Nature. 1987;330:769–771. doi: 10.1038/330769a0. [DOI] [PubMed] [Google Scholar]
- 43.Kuznetsova T.G., Starodubtseva M.N., Zhdanov R.I. Atomic force microscopy probing of cell elasticity. Micron. 2007;38:824–833. doi: 10.1016/j.micron.2007.06.011. [DOI] [PubMed] [Google Scholar]
- 44.Fletcher D.A., Mullins R.D. Cell mechanics and the cytoskeleton. Nature. 2010;463:485–492. doi: 10.1038/nature08908. [DOI] [PMC free article] [PubMed] [Google Scholar]
- 45.Marinkovic M., Diez-Silva M., Butler J.P. Febrile temperature leads to significant stiffening of Plasmodium falciparum parasitized erythrocytes. Am. J. Physiol. Cell Physiol. 2009;296:C59–C64. doi: 10.1152/ajpcell.00105.2008. [DOI] [PMC free article] [PubMed] [Google Scholar]
- 46.Mauritz J.M.A., Tiffert T., Kaminski C.F. Detection of Plasmodium falciparum-infected red blood cells by optical stretching. J. Biomed. Opt. 2010;15 doi: 10.1117/1.3458919. 030517-1–030517-3. [DOI] [PubMed] [Google Scholar]
- 47.Sraj I., Eggleton C.D., Marr D.W.M. Cell deformation cytometry using diode-bar optical stretchers. J. Biomed. Opt. 2010;15:047010. doi: 10.1117/1.3470124. [DOI] [PMC free article] [PubMed] [Google Scholar]