

Abstract
Controlled diffusion and release of soluble molecules is one of the key challenges in developing three-dimensional (3D) scaffolds for tissue engineering and drug delivery applications in part because current methods to measure dynamic transport properties are difficult to perform directly, are strongly affected by the experimental setup, and therefore can be a subject to various artifacts. In this work we present a method for direct measurement of translational diffusion of solutes, namely Fluorescence Correlation Spectroscopy (FCS), by characterizing the diffusion of model proteins through a 3D cross-linked poly(ethylene glycol) (PEG) hydrogel scaffold. We examined both the dynamics of hydrogel structure (e.g., cross-linking and swelling) as well as protein size and their effect on protein diffusivity. For example, we demonstrated that protein diffusivity was closely related to protein size as smaller proteins (e.g., lysozyme) diffused faster than larger proteins (e.g., γ-globulin or Ig). We validated the FCS protein diffusivity results by comparison to standard bulk diffusion assays. Additionally, due to the nature of FCS measurements, we were able to probe for hydrogel–protein interactions during cross-linking that may contribute to the obstructed protein diffusion in the 3D scaffold. We determined that such interactions in this system were not covalent (i.e., were independent of the cross-linking chemistry) but may be due to weaker hydrogen bonding or ionic interactions. Also, these interactions were protein specific and contributed up to 25% of the total decrease in protein diffusivity in the hydrogel as compared to diffusivity in water. Though interactions between various proteins and PEG have been reported, this is the first study that has explored these effects in detail in cross-linked PEG hydrogels using FCS; our findings question the assumption that PEG hydrogels are completely inert to protein interactions when applied as drug delivery matrices and tissue engineering scaffolds.
1. Introduction
Hydrogels are hydrophilic polymeric systems that form absorbent networks when cross-linked. Hydrogels can be composed of both natural and synthetic polymers and when fully swollen have more than 99% water content. Because of their excellent biocompatibility and their ability to improve the pharmacology of proteins without changing the protein structure and effectiveness, hydrogels have been used extensively as drug delivery carriers,1–3 as well as growth factor and protein delivery systems.4,5 Because of their high water content and physical similarity to many native soft tissues hydrogels are also especially promising for tissue engineering applications.6,7 The successful design of such delivery vehicles and tissue engineering scaffolds is critically dependent on the clear understanding of solute transport inside the hydrogel matrix.
In general, measurements of dynamic transport properties can be difficult to perform directly and can be prone to various experimental artifacts. For example, the diffusion of proteins in hydrogel matrices can be influenced by possible protein–matrix interactions (electrostatic, physical, chemical) and protein–protein interactions (aggregation, self-assembly). Additionally, the diffusionof solutes is affected by properties of the hydrogel such as elasticity, mesh size and swelling of the hydrogel matrix. To date measurements of diffusion in hydrogels have predominantly applied bulk diffusion experiments that are typically carried out on large samples.8 These experiments rely on solute loaded in the hydrogel, which diffuses through the pores of the hydrogel matrix due to a solute concentration gradient induced by matrix swelling or degradation. This bulk diffusion procedure can be cost prohibitive since it requires a large amount of solute; it is also lengthy and addresses exclusively the net macroscopic solute diffusivity and release.
To address the issues of time and cost, various methods for investigating local solute diffusion have been developed and applied.9–12 In particular, Fluorescence Correlation Spectroscopy (FCS) has been demonstrated to probe the diffusion of various solutes in polymeric systems.13 FCS can measure the diffusion of nanomolar solute concentrations allowing researchers to determine the diffusivity of rare and expensive solutes (e.g., growth factors), a cost-prohibitive investigation with other approaches. In principle, FCS is also capable of measuring the number concentration of fluorescent solutes in a sample, a measurement that is very challenging with other techniques. The length of FCS measurements is typically on the order of minutes as opposed to standard bulk diffusion techniques which require hours to days. Most importantly, FCS allows for direct measurement of solute–hydrogel and solute–solute interactions, hydrogel matrix heterogeneity, and hydrogel dynamics such as swelling behavior.
FCS measures fluctuations in the fluorescence intensity of a small illuminated sample volume to target solutes moving through this volume. The recorded fluctuations are then correlated in time by a time-delayed correlation function which is a measure of the concentration and translational diffusion coefficient of the fluorescent solute.14 To date most FCS applications have examined the dynamics of single solutes or interactions between solutes in solution,15,16 in sol–hydrogel films,17 on surfaces,18 or to probe cell membrane organization and dynamics.19,20 Yet there are many applications in which the solute of interest is suspended in a hydrogel or is a part of a more complex material such as living tissue. Only recent advances of FCS have allowed researchers to expand this technique for probing diffusion in living tissue and hydrogels.21 It has been used to determine anomalous diffusion in polymer solutions,22 normal diffusion in agarose hydrogels,23,24 controlled release from peptide hydrogel scaffolds,25 as well as to probe structural changes in polymer hydrogels.13 These studies have established the utility of FCS as a tool to measure solute diffusivity on the microscopic level in complex environments. However, despite its great potential, FCS has not yet been used to study solute diffusion in highly swellable synthetic cross-linked hydrogel matrices.
In this work we investigated the diffusivity of model solutes (Rhodamine 6G (R6G), enhanced green fluorescent protein (EGFP), bovine serum albumin (BSA), and γ-globulins (Ig)) in poly(ethylene glycol) (PEG) solutions and cross-linked PEG hydrogels using FCS; we further validated the results through bulk diffusion experiments and application of the free volume theory. We have chosen PEG as a model hydrogel matrix because of its many advantages: it is hydrophilic, non-toxic, biocompatible, inert to protein adhesion, and has been approved by Food and Drug Administration (FDA) for biological applications.26,27 This study focuses on a hydrogel formed by Michael-type addition between 4-arm PEG–vinyl sulfone (4-arm PEG–VS) and PEG–dithiol cross-linker. The chosen chemistry occurs at physiological conditions and is highly specific thus preserving the structure of the encapsulated proteins and potentially precluding covalent protein attachment to the hydrogel during cross-linking, an assumption which we proved correct through the use of FCS.
2. Experimental
2.1. Sample preparation
The cross-linked PEG hydrogels were formed by a Michael-type addition of PEG–dithiol onto 4-arm PEG–VS.28 To form hydrogels each precursor was dissolved in 0.3 M triethanolamine (TEA), pH 8. An equimolar ratio of vinyl sulfone to thiol (VS : SH) groups was used for all hydrogel densities. All solutes were added prior to gelation for both bulk diffusion studies and FCS. For bulk diffusion studies the hydrogel/solute solution was quickly vortexed immediately after mixing. Each hydrogel was then formed by placing 110 μl of solution on the center of a microscope glass slide treated with a hydrophobic solution in order to prevent attachment of the hydrogel to the glass surface (treated with RainX, Sopus Products, Houston, TX). Spacers 2 mm thick (cut from perfusion chambers, Grace Bio Inc., Bend, OR) were placed at the end of the glass slide, and a second hydrophobic slide was placed on top. The two slides were clamped together with binder clips. The slides were then transferred to a humidified incubator and allowed to gel for 1–2 h at 37 °C.
For FCS studies hydrogels were prepared in a chambered cover glass (Nalge Nunc International, Rochester, NY). The hydrogels were then soaked in a 1 μM solute solution (same as the solute concentration inside the hydrogel to avoid a concentration gradient) for 24 h before FCS measurements were performed. All hydrogel precursor solutions were prepared in a CoverWell perfusion chamber gasket (Invitrogen, Carlsbad, CA). The chambers were sealed to avoid evaporation. All hydrogels for FCS studies were 100 μl (prior to swelling) and all solutions were 50 μl in volume.
We used R6G and EGFP (Molecular Probes) as well as BSA and Ig (Sigma Aldrich, St Louis, MO) as model solutes for diffusion. Even though these solutes span a wide range of molecular weights and sizes (Table 1), they all have hydrodynamic diameter smaller than the theoretically calculated mesh size (ζ) of the PEG hydrogels.28 BSA and Ig were labeled with R6G according to standard chemical protocols (Molecular Probes, Carlsbad, CA). Unbound fluorophores were removed with Sephadex G-25M desalting columns (GE Healthcare, Piscataway, NJ) with 95% efficiency. The fluorophore R6G was chosen because of its high quantum yield (95%) and its resistance to photobleaching. The effective diffusivity of each solute in water (D0) was calculated by the Stokes–Einstein equation:
| (1) |
where η and R represent viscosity of the solvent (water, 1 cP) and radius of an isolated solute, kB is the Boltzmann constant and T is temperature in K. Stokes’ radii for all solutes were found in the literature.3,29–32
Table 1.
Properties of all solutes used in diffusion experiments
| Solute | Molecular weight/Da | R—Stokes’ radius/nm | τ0—Characteristic diffusion time in water at 22 °C/ms |
|---|---|---|---|
| R6G | 680 | 0.8 | 0.035 |
| EGFP | 27 000 | 2.8 | 0.096 |
| BSA | 65 000 | 3.5 | 0.268 |
| Ig | 150 000 | 4.7 | 0.31 |
2.2. FCS theory, measurements and data analysis
The basic principles of FCS have been described elsewhere.14 Briefly, FCS measures the fluorescence fluctuations emitted from a small confocal volume of a sample containing subnano- to nanomolar concentrations of fluorescent particles. The fluctuations are typically induced by either the motion of the particles moving in and out of the volume or intramolecular changes of the particles. The FCS analysis gives the average number of the fluorescent particles and characteristic diffusion time of particles passing through the illuminated volume.
Confocal geometry was used to obtain high sensitivity and to ensure that the excitation volume was small (~1 fl). The time sequence of the detected intensity, I(t), of fluorescence emitted by the fluorescent solutes in the excitation volume (V) at time t, is time-correlated to generate a correlation function defined as:
| (2) |
where δI(t) = I(t) − 〈 I(t) 〉 denotes the spontaneous deviation of the measured intensity from the average intensity, 〈 I(t) 〉. Analysis of G(τ) provides information about the underlying mechanisms for the intensity fluctuations. For an ideal case of freely diffusing monodisperse and uniformly bright fluorescent particles an expression for the correlation function can be derived as:33
| (3) |
where N denotes the average number of particles in the excitation volume, τ the delay time, τd the characteristic diffusion time, and p = (ro/zo)2 an instrumental constant. It is assumed that the fluorescent particles are excited by a 3D Gaussian beam, whose intensity profile is expressed as:
| (4) |
where ro and zo are the radius and axial length of the focused laser beam spot respectively. They are further used to define the excitation volume:
| (5) |
Thus, the characteristic time for fluorescent particles diffusing along the lateral width (ro) of the focused incident laser beam is defined as:
| (6) |
where D denotes the translational diffusion coefficient of the particles in the host medium. For particles diffusing in a homogeneous medium such as water, the Stokes–Einstein relation (eqn (1)) is applicable.
If there are two non-interacting, diffusing particles, the correlation function can be rewritten as:34
| (7) |
where m1 and m2 are related to the quantum yield and average number of each of the diffusing species and τ1 and τ2 are their respective diffusion times. This expression appears to better fit correlations measured from solution samples prepared with particles that were exogenously labeled (i.e., BSA and Ig) indicating the presence of both the non-reactive fluorophores and the labeled particles.
Several assumptions were made in order to obtain the correlation function for each solute. First, since ζ of the hydrogel was larger than R of the diffusing solutes, the case of freely diffusing monodisperse fluorescent solutes was applied.23 Second, because low laser intensity was used, the excitation of molecular triplet states was not taken into consideration.22 The low laser intensity minimized photobleaching and thus the error that would result from a potential decrease in the fluorophore quantum yield was also minimized.
The FCS instrument used in this work (Hamamatsu C9413, Hamamatsu, Iwata City, Japan) utilized simple confocal optics that minimized optical loss and allowed alignment of the optical axis. For fluorescence excitation a low-noise solid-state laser was used (470 nm wavelength). The fluorescence intensity was measured with a photodetector comprised of a photomultiplier tube with a GaAsP photocathode. Determination of the confocal volume was established via calibration against a phosphate buffered saline (PBS) solution of Rhodamine 6G assuming D = 280 μm2 s−1. All FCS measurements were performed at room temperature. For each sample 10–20 FCS correlation functions were acquired and the duration of each was about 215 s. Also, correlations were taken at various positions within the hydrogel sample to assess possible effects of spatial heterogeneities on diffusion.
2.3. Bulk diffusion studies
For comparison to FCS results, solute effective diffusion coefficients were also estimated from bulk diffusion experiments. Briefly, the hydrogels were cross-linked in the presence of the solute to achieve a final solute concentration in the hydrogel of 2% w/v. After cross-linking the hydrogels were placed in 15 ml tubes filled with 10 mM PBS of pH 7.4 and mixed end-over-end at 22°C. At specified sample collection times, 1 ml of solution was transferred to a microfuge tube and replaced in the 15 ml tube with fresh PBS. The solute content of each sample was analyzed with the Bio-Rad protein assay using the manufacturer’s microassay procedure.
The effective diffusion coefficients were calculated via a modified form of the Fick’s law for short release times:35
| (8) |
where Mi is the concentration of released solute at time i, Minf is the concentration of solute at infinite time, Mi/Minf is the fractional release, De is the effective diffusion coefficient, t is time, and δ is half of the hydrogel thickness.
From eqn (8), it follows that Mi/Minf is directly proportional to t1/2 and therefore a plot of Mi/Minf versus t1/2 was used to find De. A mass balance was performed to calculate Mi:
| (9) |
where Ci is the concentration of solute in the release solution at time i, V is the total volume of the release solution (15 ml) and Vs is the sample volume (1 ml).
All experiments were performed at room temperature. The measured De was normalized using D0, at 22°C (see Table 1). An average De/D0 was reported for each solute.
2.4. Swelling experiments and mesh size
To measure hydrogel swelling ratio, samples (50 μl) were soaked in 10 mM PBS, pH 7.4. The hydrogels were collected at regular intervals and their mass after swelling (MS) was measured. The hydrogels were then dried in an oven at 80°C for 24 h and their dry mass (MD) was measured. The swelling ratio based on hydrogel mass (QM) was calculated using eqn (10):36
| (10) |
Flory–Rehner calculations were used to determine the mesh size (ζ) of the hydrogel. First the molecular weight between cross-links (M̄c) was calculated using the following equation:37
| (11) |
where M̄n is the number-average molecular weight of the uncross-linked hydrogel, V1 is the molar volume of the solvent (18 cm3 mol−1 for water), ν2 is the polymer volume fraction in the equilibrium swollen hydrogel, ν̄ is the specific volume of the polymer, and χ1 is the polymer–solvent interaction parameter (0.426 for PEG–water36,37).
Mesh size was then determined as described by Canal and Peppas.38 The root-mean-square end to end distance of the polymer chain in the unperturbed state ( ) was calculated using eqn (12):
| (12) |
where l is the average bond length (0.146 nm39,40), Cn is the characteristic ratio of the polymer (typically 4.0 for PEG40,41) and n is the number of bonds in the crosslink:42
| (13) |
where Mr is the molecular weight of the repeat unit (44 g mol−1 for PEG). Mesh size was then calculated by:
| (14) |
2.5. Statistical analysis
The results of all experiments are the mean values ± standard deviation (±SD) of multiple samples. For FCS and bulk diffusion: studies were performed in triplicate samples in three independent experiments. For each sample for FCS, 10–20 measurements were taken at various positions within the hydrogel sample. Comparative analysis was performed with a two-tailed Student’s t-test. Differences between two data sets were considered significant when p < 0.05.
2.6. Free volume theory applied to hydrogels
Many theories have been proposed to explain solute diffusion in solute/polymer/solvent systems such as hydrogels. Such models consider hydrodynamic effects, obstruction effects or both.43,44 However, it is difficult to determine which aspects of the ternary system (solute, polymer, buffer) affect the solute diffusion especially when the solute size is similar to or smaller than the mesh size of the hydrogels.
One of the proposed models is the free volume theory which has been specifically adapted to model probe diffusion in homogeneous systems such as PEG hydrogels. The free volume theory was first developed to explain the diffusion of a solute in a pure liquid.45 According to this theory the solute diffuses by jumping into voids that are formed in the solvent when the volume within the liquid is redistributed. This redistribution occurs due to random thermal motion and does not require energy. Solute diffusion is dependent on the jumping distance, the thermal velocity of the solute and the probability that there is a free volume adjacent to the molecule. When this theory is applied to hydrogels, in addition to the free volume in the liquid, the solute needs to find an opening between the polymer chains. Thus, the solute diffusivity is also dependent on the structure of the polymer/solvent system.
Peppas and Reinhart46 proposed a model, in which the main mechanism of solute transport in hydrogels depends on number of structural parameters including the swelling ratio:
| (15) |
where R is the solute hydrodynamic radius, k is a constant that is related to the structure of a given polymer–solvent system, and f(M̄c) is a function of the molecular weight between cross-links. Eqn (15) predicts that the normalized diffusion coefficient increases when the swelling ratio increases and the solute size decreases. For a given solute/polymer/solvent system if the polymer concentration is altered, only QM will be affected and the normalized diffusivity will be directly proportional to QM. From eqn (15) it is expected that a plot of ln(De/D0) versus 1/(QM − 1) at constant temperature will give a straight line. For the same ternary system, when only the solute size is varied, the normalized solute diffusivity should be directly proportional to R2. For this case, it is expected that a plot of ln(De/D0) versus R2 will give a straight line.
3. Results and discussion
Diffusion in hydrogels is a complex phenomenon and is strongly dependent on a number of variables. Some of the most important variables include, but are not limited to the mesh size of the hydrogel, the solute size with respect to the mesh size, the amount of hydrogel swelling, solute–solute interactions such as aggregation inside the hydrogel, solute–hydrogel interactions such as covalent or ionic binding, and the hydrogel matrix microstructure.43,47 Thus, this work aimed to utilize the information obtained from FCS studies regarding the translational solute diffusivity to evaluate the influence and dynamics of these parameters on solute diffusion inside non-degradable cross-linked PEG hydrogels. Additionally, we sought to validate that the FCS obtained local diffusivities could be averaged over the entire volume of the hydrogel matrix and directly compared to bulk diffusivities obtained through bulk diffusion experiments. Finally, we have shown that the data obtained with FCS can be described by free volume theory applied to hydrogels.
Examples of the autocorrelation function of EGFP and BSA in 10% w/v PEG hydrogels are presented in Fig. 1. EGFP is an autofluorescent protein and therefore we assumed that only one solute was present in the hydrogel sample. The solid line represents the fit of the expression in eqn (3) to the data, indicating that the diffusion of EGFP in the PEG hydrogel could be described by a single characteristic time, τd. On the other hand, since BSA was labeled in-house with R6G the measured correlation functions appear to be well-fit with the expression for a two-component system. Here, the solid line is the fit with the expression in eqn (7), where τ1 of the R6G is known from separate measurements and τ2, m1 and m2 are the main fitting parameters. Fig. 1 confirmed that there was an excellent fit to the data obtained both with autofluorescent protein such as EGFP and labeled protein such as BSA.
Fig. 1.

Representative correlation functions for EGFP and BSA in 10% w/v PEG hydrogel. The solid lines are the fits of the data with the expression in eqn (3) for EGFP, a one component fit (R2 = 0.98), and eqn (7) for BSA, a two component fit (R2 = 0.98).
To interpret the data obtained from FCS we have assumed freely diffusing monodisperse particles. We have chosen to work in the regime where R ≪ ζ, where the theoretical ζ is calculated based on swelling experiments, in order to partially satisfy the underlying assumptions. The hydrodynamic radius of the largest protein Ig was 4.7 nm. The values of ζ for the 5% to 15% density hydrogels were in the range of 18.6 ± 0.7 to 14.3 ± 0.5 nm. However, our calculations of ζ assumed a homogeneous hydro-gel matrix and did not take into account possible physical entanglements of the polymer chains. Indeed, such entanglements were possible, could have lead to hydrogel matrix heterogeneity, and thus affect solute diffusivity. This effect, which was explicitly examined herein, would result in additional polydispersity in the FCS data and decreased solute diffusivity detected by both FCS and bulk diffusion experiments especially for the higher molecular weight solutes.
For the labeled proteins (BSA and Ig), we have also assumed that only one fluorophore was attached to each protein molecule. For our labeling technique, we have calculated that there were 0.9 fluorophore molecules per each protein molecule, which validated this initial assumption.
3.1. Comparison of FCS and bulk diffusion
Since FCS has not been used previously in systems comparable to ours, our first goal was to validate the diffusivity results obtained from the FCS experiments. We compared the translational local diffusivity (as measured by FCS) to bulk diffusivity (as measured by bulk diffusion experiments) of BSA under the same experimental conditions (2% w/v BSA, 22 °C). For this experiment we used PEG hydrogels of 3 polymer densities, namely 5%, 10%, and 15% w/v in order to investigate a range of mesh sizes. The Fig. 2 inset shows the decrease in mesh size from ~18 nm to 14 nm as the polymer density increased from 5% to 15% w/v. We hypothesized that the BSA diffusivity would decrease as the polymer density increased and the trend would be observed both with FCS and bulk diffusion experiments. Fig. 2 shows the normalized diffusivity of BSA as a function of polymer density. For bulk diffusion experiments the calculated De was normalized by the diffusivity of BSA in water, D0. For purposes of comparison, we also normalized the characteristic diffusion time. First, τd was divided by the characteristic diffusion time of BSA in water to give a scaled quantity. The inverse of this dimensionless quantity, τ0/τd, was equivalent to the dimensionless De/D0. The normalized diffusivities obtained by both methods were comparable in value and trend with no significant differences between them. Both methods showed that the solute diffusivity was linearly dependent on ζ in the studied range.
Fig. 2.

Normalized BSA diffusivity in PEG hydrogels as a function of polymer density as measured by FCS and bulk diffusion studies. Solid lines represent linear fits of the data (R2 = 0.99 and 0.97 for FCS and bulk measurements, respectively). The effective diffusivity of BSA in the hydrogel (De) was normalized to the diffusivity of BSA in water at 22 °C (D0). Inset: mesh size of PEG hydrogel as a function of polymer density. Symbols represent the average ± standard deviation for n = 9 samples for bulk diffusion experiments and mesh size calculations and n = 18 total measurements in 3 independent samples for FCS experiments.
We expected to see similar diffusivities obtained through FCS and bulk diffusion experiments for several reasons. First, with FCS we have taken diffusivity measurements at multiple locations throughout the hydrogel to obtain the equivalent of average bulk diffusivity. Second, the illuminated volume used in our FCS setup had a diameter in the range of μm, while the mesh size of the hydrogel was in the order of nm. Therefore, with the experimental FCS setup we were only testing the micro-diffusivities of a solute through a hydrogel that had a nano-structure. Thus, we did not expect polydispersity in the diffusivity data of BSA. Despite the similarities, however, we observed that the diffusivities obtained via FCS were insignificantly but consistently lower than those obtained by bulk diffusion experiments. This result could be explained by the relationship between the local and the bulk diffusivities:
| (16) |
where D* is the translational diffusivity (as measured by FCS), c is the solute concentration and a is the solute activity. The term ∂lnc/∂lna is usually greater than unity and therefore D* > De.
It is also important to note that local diffusivities are easier to measure than bulk diffusivities but bulk diffusivity is the parameter that more accurately describes how a real system such as a drug delivery device operates. Therefore, relating the local to the bulk diffusivities is a very practical concern for the system described in this work.
3.2. Effect of solute hydrodynamic radius on solute diffusivity
We further validated the results obtained via FCS by the modified free volume theory adapted to describe diffusion in hydrogels. Arguably, one of the most important parameters in diffusion in hydrogels is the solute size. Fig. 3 depicts ln(τ0/τd) (which is equivalent of ln(De/D0)) for R6G, EGFP, BSA, and Ig as a function of R2 for each solute. The data fit a straight line (R2 = 0.96) and demonstrate that the obtained solute diffusivities were well described by the free volume theory and also that diffusivity decreased with increase in solute size.
Fig. 3.

Dependence of solute diffusivity in 10% w/v PEG hydrogel on solute hydrodynamic radius. The solid line represents a fit of the data to the free volume theory modified for diffusion in hydrogels (R2 = 0.96).
3.3. Effect of polymer swelling on solute diffusivity
Another important parameter that impacts solute diffusion is hydrogel swelling, which is directly proportional to the hydrogel hydrophilicity and ζ. Fig. 4a shows that QM decreased for increased polymer density. Based on Fig. 2 and the free volume theory, we expected that the normalized diffusivity would decrease with increased polymer density and a plot of ln(τ0/τd) (which is equivalent of ln(De/D0)) versus 1/(QM − 1) would give a straight line. Indeed, our data for BSA normalized diffusivity fitted this trend (R2 = 0.99) which showed that it was well described by the free volume theory (Fig. 4b).
Fig. 4.
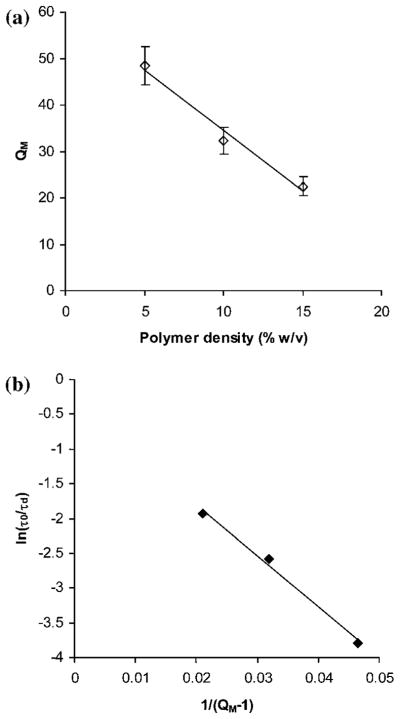
(a) Swelling ratio (QM) dependence on polymer density. The solid line represents linear dependence in the range studied (R2 = 0.98). (b) Influence of QM on BSA diffusivity, where QM was altered by manipulating the polymer density. The solid line represents a fit of the data to the free volume theory modified for diffusion in hydrogels (R2 = 0.99).
It was hard to predict a priori which of the two factors, QM or solute size, would have a greater impact on the overall solute diffusivity inside the hydrogel. However, based on our data, QM had a slightly greater impact on solute diffusivity than R of the solute. We observed an overall increase of 1.6% in solute diffusivity per each 1% increase in QM versus 1.1% decrease in solute diffusivity per each 1% increase in R. It is possible that when the solute R reaches or becomes higher than ζ of the hydrogel, R would become the limiting factor for diffusion.
A few comments on the data obtained from the measurement of Ig are necessary. When FCS data were taken, extremely high photon counts were recorded occasionally, indicating that clusters of particles were entering the excitation volume. This behavior was attributed to possible aggregation of the labeled Ig after 24 h in solution (as noted earlier, the hydrogels were swollen for 24 h before measurements). Also, polydispersity of the solute contributed to the scatter in the diffusion coefficient data. Therefore, only data without extreme photon counts were analyzed.
As mentioned above, FCS can be used to measure dynamic phenomena in the hydrogel such as gelation and swelling. Because we saw that the hydrogel swelling had such a profound effect on the solute diffusivity, we investigated this phenomenon in detail (Fig. 5). We monitored the temporal diffusivity of BSA in 3 separate hydrogels during swelling in PBS (Fig. 5a). Time 0 min is the time point when the fully cross-linked hydrogel was placed in PBS. Data were taken every 15 min until the diffusivity of BSA remained unchanged after the hydrogel reached a state of equilibrium swelling at ~2 h. The corresponding total change in BSA normalized diffusivity was 15%.
Fig. 5.

Swelling behavior of three PEG hydrogel samples unveiled via FCS monitoring of BSA diffusivity: (a) normalized diffusivity of BSA upon swelling as a function of time and (b) normalized diffusivity of BSA at equilibrium swelling. The lines of best fit are shown to guide the eye.
Fig. 5b shows the temporal normalized diffusivity of BSA when the hydrogels reached equilibrium swelling. The data show that the diffusivity did not change significantly even after 5 h of soaking the hydrogel in PBS. We have further confirmed that the diffusivity of BSA remained unchanged even after 24 h (data not shown).
3.4. Effect of cross-linking conditions on BSA diffusivity
It is well recognized that protein diffusion in hydrogels is influenced by phenomena such as solute–solute and solute–hydrogel interactions which are not taken into account in the free volume theory or bulk diffusion experiments as described by a Fickian diffusion model at short release times. The advantage of utilizing FCS to investigate protein diffusivity in hydrogels lies in its ability to probe such micro-scale interactions between individual molecules. Specifically, FCS allowed us to probe for covalent interactions between the solute and the hydrogel components during cross-linking. During the cross-linking reaction a Michael-type addition takes place between the VS group of the 4-arm PEG–VS polymer and the SH group of the PEG–dithiol cross-linker. All solutes were loaded into the hydrogels prior to cross-linking and consequently subjected to the cross-linking conditions. Therefore, a possibility existed for an interaction of the solute of interest with any of the hydrogel components during the cross-linking reaction.
We first measured the duration of the cross-linking reaction by monitoring the temporal diffusivity of BSA as a function of gelation time (Fig. 6a). We verified that under the experimental conditions (pH 8, 22°C, 10% w/v polymer solution), the hydrogel was fully cross-linked in 20 min. Next, we used FCS as a tool to test for possible interactions between the model protein BSA and the PEG reactive group VS. We chose BSA because it is one of the few proteins that has a free cysteine residue that may react with PEG–VS.48 However, the residue is situated in a protected crevice, so we did not expect interaction with the VS or the SH residue.
Fig. 6.

Gelation behavior of PEG hydrogel studied via BSA diffusivity: (a) normalized diffusivity of BSA upon gelation as a function of time and (b) normalized diffusivity of BSA as a function of the type of PEG solution. Bars represent the average ± standard deviation for n = 18 total measurements in 3 independent samples. The solid line is used to guide the eye.
We prepared 2 solutions of PEG with the same final concentration of 10% w/v: one of 4-arm PEG–VS and one of non-functionalized 4-arm PEG–OH. Fig. 6b shows the temporal dependence of the normalized diffusivity of BSA for the two PEG solutions—PEG–OH and PEG–VS. The data show that BSA exhibited a stable τ0/τd of ~0.33 at each time point for both solution types. These results lead us to the conclusion that no chemical interaction such as covalent bonding was taking place between BSA and VS group of the polymer solution during the first 20 min of interaction (corresponding to the cross-linking time determined in Fig. 6a) because a reaction between the two would have resulted in decreased diffusivities over time. These results agree with previous findings that side chemical reactions between the PEG polymer and solute proteins were unlikely at the chosen experimental conditions.2
With the experiment described above, we could only test for possible reactions with the VS but not the SH reactive group due to the instability of the PEG–dithiol solution. This instability could be explained by the chemical structure of the cross-linkers. In basic solution, the free thiols form disulfide bonds due to thiol deprotonation and conversion to a more reactive thiolate group.49,50 The formation of a disulfide bond with a different cross-linker or with itself leads to an increase in chain length of the polymer and cyclization, respectively. Because of this change in the polymer structure with time, a higher characteristic diffusion time in PEG–dithiol solution as opposed to the control PEG–OH solution could not be attributed strictly to interaction between the SH group and BSA.
3.5. Effect of solvent on solute diffusivity
There are several major components in the cross-linking reaction, including the reactive polymers and the TEA base that was used to facilitate the Michael-type addition reaction. Therefore, we attempted to identify possible effects that the TEA could have on the diffusivity of BSA. In order to pinpoint the influence of TEA, we prepared solutions of PEG–OH polymer in PBS and in TEA (Fig. 7). We observed that in hydrogel solutions the presence of TEA decreased the BSA diffusivity by 36% at BSA concentrations of 0.5% to 10% w/v. At higher BSA concentrations the effect of the TEA was masked and completely disappeared at 20% w/v BSA. This effect was not observed for EFGP which showed τo/τd of ~0.25 for both PEG–OH solutions, in PBS and TEA, respectively (data not shown).
Fig. 7.
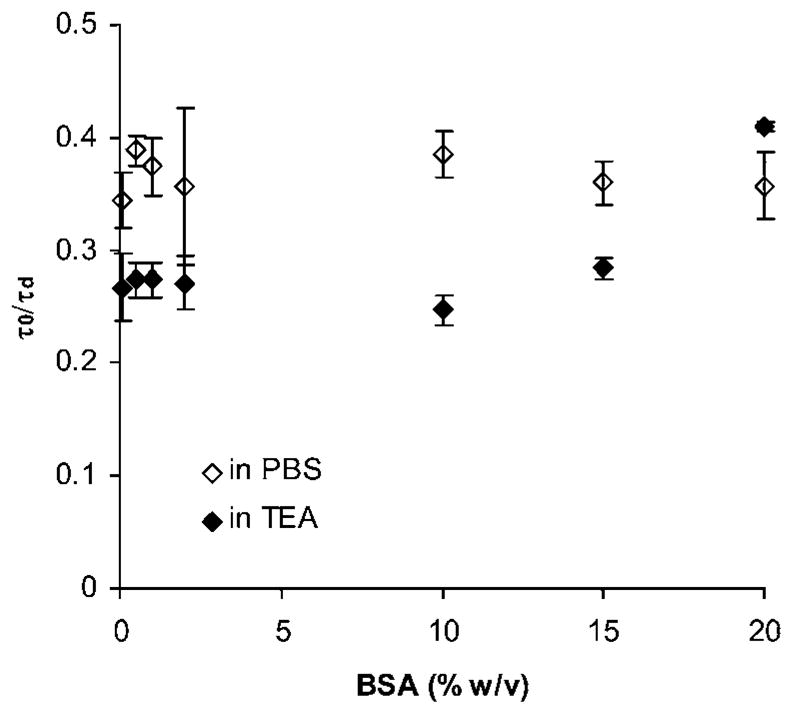
Influence of 0.3 M TEA on BSA normalized diffusivity in PEG–OH solution. Data points represent the average ± standard deviation for n = 18 total measurements in 3 independent samples.
The fact that BSA exhibited a higher diffusivity in PBS solution of PEG–OH as compared to that in TEA could be due to a formation of a water soluble complex between PEG and BSA in basic conditions. It has been shown that under similar conditions and pH 8, human serum albumin (HSA) and PEG form a water soluble complex.51 The formation of this complex has been attributed to the primary structure of HSA which contains approximately the same number of basic and acidic groups. Thus the basic protein groups become deprotonated at pH 8 enabling the formation of a hydrogen bond with the ether groups of the polymer. Because the primary structures of HSA and BSA are similar, we speculated that such complex could be forming between BSA and the PEG polymer during the cross-linking reaction.
3.6. Effect of solute concentration on BSA diffusivity
The results presented in the previous section suggest that TEA influences the BSA diffusion in PEG solution. However, upon gelation, the PEG hydrogel is soaked in large volumes of PBS which could reduce the potential effect of TEA on BSA diffusivity. Thus the next experiment aimed to test the effect of the cross-linking conditions on the diffusivity of BSA after gelation. If the diffusivity of BSA in the hydrogel was decreased due to an interaction with the PEG polymer, the effect of this interaction would be masked at high BSA concentrations in the hydrogel as well as in solution. To test this hypothesis, we prepared PEG hydrogels of 10% w/v polymer density with varying concentrations of BSA. We measured the diffusivity of BSA in the PEG hydrogels after 24 h of swelling. We tested a wide working range of 0.5% to 20% BSA w/v. For solutions above 20% w/v BSA showed signs of precipitation in the PEG hydrogels. To prepare the hydrogels, we used the same amount of BSA/R6G (50 nM, to maintain a stable, low photon count) but increased the amount of unlabeled BSA to achieve a desired final concentration inside the hydrogels.
Fig. 8 shows the normalized diffusivity of BSA inside the swollen PEG hydrogel as a function of BSA concentration. We observed that the diffusivity increased as the concentration of BSA increased suggesting that the effect of TEA (or any other interaction between the hydrogel and BSA) was masked at higher BSA concentrations (>10% w/v). Total increase in BSA diffusivity between 0.5% and 20% w/v concentration in the hydrogel amounted to 47%. This result indicated that there was an interaction on molecular scale between the PEG hydrogel and the solute and that such interactions could easily be overlooked. Therefore, care must be taken when reporting quantitative dynamic transport properties of hydrogels.
Fig. 8.
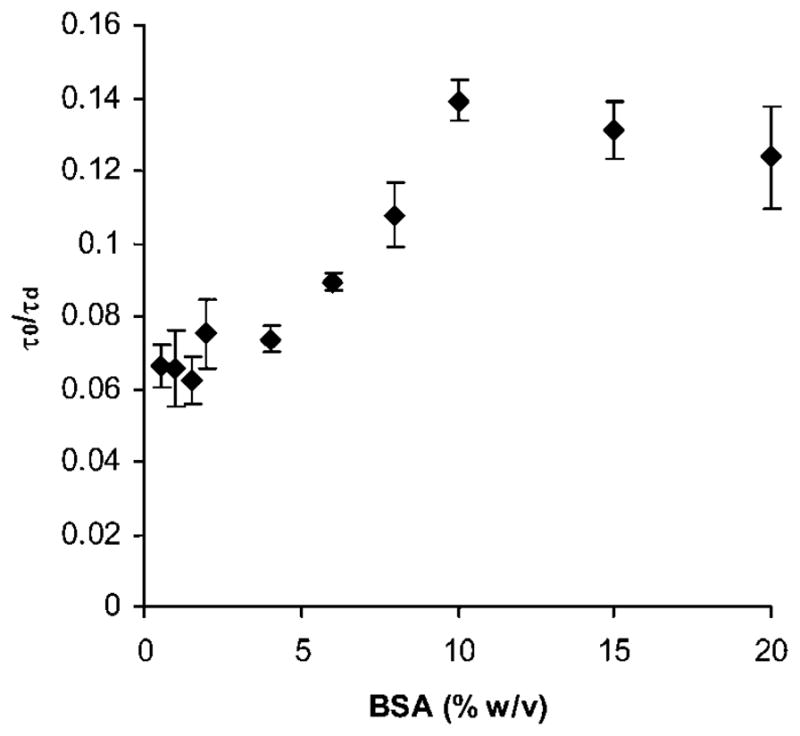
Normalized BSA diffusivity as a function of BSA concentration in PEG hydrogels. Bars represent the average ± standard deviation for n = 18 total measurements in 3 independent samples.
Additionally, we tested the diffusivity of BSA in hydrogels made with TEA solutions within the pH range of 7.4–10 (data not shown). However, there was not a significant difference between the various hydrogels which indicated that TEA had a more pronounced effect on the possible complex formation than pH alone.
The conclusion, that the decrease in BSA diffusivity is due to non-covalent interactions between BSA and PEG in the presence of TEA, was also supported by findings reported previously by our group.52 Using circular dichroism we have shown that there was no change in BSA secondary structure upon exposure to the PEG gel cross-linking conditions and using size exclusion chromatography we have shown that BSA did not aggregate in the presence of TEA. Therefore, changes in the BSA diffusivities in PEG gels or solutions (in the presence of TEA) observed via FCS could not be explained by protein unfolding or aggregation.
4. Conclusions
In summary, we applied FCS and bulk diffusion experiments to measure the diffusion of solutes in cross-linked PEG hydrogels. The measurements indicated that even though these two methods measure diffusion on disparate size scales, the obtained results were comparable in value and trend. Additionally, FCS proved useful in probing hydrogel cross-linking and swelling dynamics as well as solute–hydrogel interactions that impact measured solute diffusivity. As an example, we illustrated that a model protein BSA did not interact covalently with the hydrogel components during cross-linking. Also, we confirmed that the use of TEA as a facilitator of the cross-linking reaction promotes interaction of BSA with the PEG polymer possibly due to hydrogen bonding of the protonated basic protein groups with the ether oxygen of the PEG. Our experiments revealed that FCS provides a detailed insight into the underlying interactions responsible for the obstructed solute diffusivity in cross-linked hydrogels.
Acknowledgments
We thank Drs Ralph Nossal and Dan Sackett for access to the Fluorescence Correlation Spectroscopy equipment and for providing us with EGFP protein. We also thank Dr Douglas Frey for valuable technical discussions. This work was supported by NIH-NINDS (R01NS065205), the Henry Luce Foundation and UMBC.
References
- 1.Satish CS, Satish KP, Shivakumar HG. Hydrogels as controlled drug delivery systems: synthesis, crosslinking, water and drug transport mechanisms. Indian J Pharm Sci. 2006;68(2):133–140. [Google Scholar]
- 2.Elbert DL, Pratt AB, Lutolf MP, Halstenberg S, Hubbell JA. Protein delivery from materials formed by self-selective conjugate addition reactions. J Controlled Release. 2001;76(1–2):11–25. doi: 10.1016/s0168-3659(01)00398-4. [DOI] [PubMed] [Google Scholar]
- 3.Maeda M, Tani S, Sano A, Fujioka K. Microstructure and release characteristics of the minipellet, a collagen-based drug delivery system for controlled release of protein drugs. J Controlled Release. 1999;62(3):313–324. doi: 10.1016/s0168-3659(99)00156-x. [DOI] [PubMed] [Google Scholar]
- 4.Nie T, Baldwin A, Yamaguchi N, Kiick KL. Production of heparin-functionalized hydrogels for the development of responsive and controlled growth factor delivery systems. J Controlled Release. 2007;122(3):287–296. doi: 10.1016/j.jconrel.2007.04.019. [DOI] [PMC free article] [PubMed] [Google Scholar]
- 5.Saito N, Okada T, Horiuchi H, et al. A biodegradable polymer as a cytokine delivery system for inducing bone formation. Nat Biotechnol. 2001;19(4):332–335. doi: 10.1038/86715. [DOI] [PubMed] [Google Scholar]
- 6.Bryant SJ, Bender RJ, Durand KL, Anseth KS. Encapsulating chondrocytes in degrading PEG hydrogels with high modulus: engineering gel structural changes to facilitate cartilaginous tissue production. Biotechnol Bioeng. 2004;86(7):747–755. doi: 10.1002/bit.20160. [DOI] [PubMed] [Google Scholar]
- 7.Lee KY, Mooney DJ. Hydrogels for tissue engineering. Chem Rev. 2001;101(7):1869–1879. doi: 10.1021/cr000108x. [DOI] [PubMed] [Google Scholar]
- 8.Peppas NA, Keys KB, Torres-Lugo M, Lowman AM. Poly(ethylene glycol)-containing hydrogels in drug delivery. J Controlled Release. 1999;62(1–2):81–87. doi: 10.1016/s0168-3659(99)00027-9. [DOI] [PubMed] [Google Scholar]
- 9.Annunziata O, Buzatu D, Albright JG. Protein diffusion coefficients determined by macroscopic gradient Rayleigh interferometry and dynamic light scattering. Langmuir. 2005;21:12085–12089. doi: 10.1021/la052147f. [DOI] [PubMed] [Google Scholar]
- 10.Massaro L, Zhu XX. Self-diffusion of end-capped oligo(ethylene glycols) in poly(vinyl alcohol) aqueous solutions and gels. Macromolecules. 1999;32:5383–5390. [Google Scholar]
- 11.Ye X, Wu J, Oh JK, Winnik MA, Wu C. Effect of pluronic surfactants on the polymer diffusion rate in poly(butyl methacrylate) latex films. Macromolecules. 2003;36:8886–8889. [Google Scholar]
- 12.Berk DA, Yuan F, Leuning M, Jain RK. Fluorescence photobleaching with spatial Fourier analysis: measurement of diffusion in light scattering media. Biophysical Journal. 1993;65:2428–2436. doi: 10.1016/S0006-3495(93)81326-2. [DOI] [PMC free article] [PubMed] [Google Scholar]
- 13.Michelman-Ribeiro A, Boukari H, Nossal R, Horkay F. Structural changes in polymer gels probed by fluorescence correlation spectroscopy. Macromolecules. 2004;37:10212–10214. [Google Scholar]
- 14.Krichevsky O, Bonnet G. Fluorescence correlation spectroscopy: the technique and its applications. Rep Prog Phys. 2002;65:251–297. [Google Scholar]
- 15.Rompaey EV, Engelborgh Y, Sanders N, De Smedt SC, Demeester J. Interactions between oligonucleotides and cationic polymers investigated by fluorescence correlation spectroscopy. Pharm Res. 2001;18(7):928–937. doi: 10.1023/a:1010975908915. [DOI] [PubMed] [Google Scholar]
- 16.Bosco SJ, Zettl H, Crassous JJ, Ballauff M, Krausch G. Interactions between methyl cellulose and sodium dodecyl sulfate in aqueous solution studied by single molecule fluorescence correlation spectroscopy. Macromolecules. 2006;39:8793–8798. [Google Scholar]
- 17.Martin-Brown SA, Fu Y, Saroja G, Collinson MM, Higgins DA. Single-molecule studies of diffusion by oligomer-bound dyes in organically modified sol–gel-derived silicate films. Anal Chem. 2005;77(2):486–494. doi: 10.1021/ac0491511. [DOI] [PubMed] [Google Scholar]
- 18.Zhao J, Granick S. How polymer diffusion depends on surface coverage. Macromolecules. 2007;40:1243–1247. [Google Scholar]
- 19.Takahashi Y, Bark N, Kinjo M, Rigler R. Fluorescence correlation spectroscopy (FCS) analysis of human red blood cell system. Opt Rev. 2003;10(6):4029–4042. [Google Scholar]
- 20.Wawrezinieck L, Rigneault H, Marguet D, Lenne PF. Fluorescence correlation spectroscopy diffusion laws to probe the submicron cell membrane organization. Biophys J. 2005;89(6):4029–4042. doi: 10.1529/biophysj.105.067959. [DOI] [PMC free article] [PubMed] [Google Scholar]
- 21.Tatarkova SA, Kamra Verma A, Berk DA, Lloyd CJ. Quantitative fluorescence microscopy of macromolecules in gel and biological tissue. Phys Med Biol. 2005;50(23):5759–5768. doi: 10.1088/0031-9155/50/23/024. [DOI] [PubMed] [Google Scholar]
- 22.Masuda A, Ushida K, Okamoto T. New fluorescence correlation spectroscopy (FCS) suitable for the observation of anomalous diffusion in polymer solution: time and space dependences in diffusion coefficients. J Photochem Photobiol, A. 2006;183:304–308. [Google Scholar]
- 23.Fatin-Rouge N, Starchev K, Buffle J. Size effects on diffusion processes within agarose gels. Biophys J. 2004;86(5):2710–2719. doi: 10.1016/S0006-3495(04)74325-8. [DOI] [PMC free article] [PubMed] [Google Scholar]
- 24.Fatin-Rouge N, Wilkinson KJ, Buffle J. Combining small angle neutron scattering (SANS) and fluorescence correlation spectroscopy (FCS) measurements to relate diffusion in agarose gels to structure. J Phys Chem B. 2006;110(41):20133–20142. doi: 10.1021/jp060362e. [DOI] [PubMed] [Google Scholar]
- 25.Koutsopoulos S, Unsworth LD, Nagai Y, Zhang S. Controlled release of functional proteins through designer self-assembling peptide nanofiber hydrogel scaffold. Proc Natl Acad Sci U S A. 2009;106(12):4623–4628. doi: 10.1073/pnas.0807506106. [DOI] [PMC free article] [PubMed] [Google Scholar]
- 26.Krsko P, Libera M. Biointeractive hydrogels. Mater Today (Oxford, UK) 2005;8:38–44. [Google Scholar]
- 27.Merrill EW. Poly(ethylene oxide) star molecules: synthesis, characterization, and applications in medicine and biology. J Biomater Sci, Polym Ed. 1993;5(1–2):1–11. doi: 10.1163/156856294x00617. [DOI] [PubMed] [Google Scholar]
- 28.Zustiak SP, Leach JB. Hydrolytically degradable poly(ethylene glycol) hydrogel scaffolds with tunable degradation and mechanical properties. Biomacromolecules. 2010;11(5):1348–1357. doi: 10.1021/bm100137q. [DOI] [PMC free article] [PubMed] [Google Scholar]
- 29.Mason MN, Metters AT, Bowman CN, Anseth KS. Predicting controlled-release behavior of degradable PLA-b-PEG-b-PLA hydrogels. Macromolecules. 2001;62(3):313–324. [Google Scholar]
- 30.Seksek O, Biwersi J, Verkman AS. Translational diffusion of macromolecule-sized solutes in cytoplasm and nucleus. J Cell Biol. 1997;138(1):131–142. doi: 10.1083/jcb.138.1.131. [DOI] [PMC free article] [PubMed] [Google Scholar]
- 31.Terry BR, Matthews EK, Haseloff J. Molecular characterisation of recombinant green fluorescent protein by fluorescence correlation microscopy. Biochem Biophys Res Commun. 1995;217(1):21–27. doi: 10.1006/bbrc.1995.2740. [DOI] [PubMed] [Google Scholar]
- 32.Labille J, Fatin-Rouge N, Buffle J. Local and average diffusion of nanosolutes in agarose gel: the effect of the gel/solution interface structure. Langmuir. 2007;23(4):2083–2090. doi: 10.1021/la0611155. [DOI] [PubMed] [Google Scholar]
- 33.Boukari H, Nossal R, Sackett DL. Stability of drug-induced tubulin rings by fluorescence correlation spectroscopy. Biochemistry. 2003;42(5):1292–1300. doi: 10.1021/bi026751q. [DOI] [PubMed] [Google Scholar]
- 34.Michelman-Ribeiro A, Horkay F, Nossal R, Boukari H. Probe diffusion in aqueous poly(vinyl alcohol) solutions studied by fluorescence correlation spectroscopy. Biomacromolecules. 2007;8(5):1595–1600. doi: 10.1021/bm061195r. [DOI] [PubMed] [Google Scholar]
- 35.Ritger PL, Peppas NA. A simple equation for description of solute release: I. Fickian and non-Fickian release from non-swellable devices in the form of slabs, spheres, cylinders or disks. J Controlled Release. 1987;5:23–36. [PubMed] [Google Scholar]
- 36.Leach JB, Bivens KA, Patrick CW, Jr, Schmidt CE. Photocrosslinked hyaluronic acid hydrogels: natural, biodegradable tissue engineering scaffolds. Biotechnol Bioeng. 2003;82(5):578–589. doi: 10.1002/bit.10605. [DOI] [PubMed] [Google Scholar]
- 37.Lu S, Anseth KS. Release behavior of high molecular weight solutes from poly(ethylene-glycol)-based degradable networks. Macromolecules. 2000;33(7):2509–2515. [Google Scholar]
- 38.Canal T, Peppas NA. Correlation between mesh size and equilibrium degree of swelling of polymeric networks. J Biomed Mater Res. 1989;23(10):1183–1193. doi: 10.1002/jbm.820231007. [DOI] [PubMed] [Google Scholar]
- 39.Cruise GM, Scharp DS, Hubbell JA. Characterization of permeability and network structure of interfacially photopolymerized poly(ethylene glycol) diacrylate hydrogels. Biomaterials. 1998;19(14):1287–1294. doi: 10.1016/s0142-9612(98)00025-8. [DOI] [PubMed] [Google Scholar]
- 40.Mellott MB, Searcy K, Pishko MV. Release of protein from highly cross-linked hydrogels of poly(ethylene glycol) diacrylate fabricated by UV polymerization. Biomaterials. 2001;22(9):929–941. doi: 10.1016/s0142-9612(00)00258-1. [DOI] [PubMed] [Google Scholar]
- 41.Merrill EW, Dennison KA, Sung C. Partitioning and diffusion of solutes in hydrogels of poly(ethylene oxide) Biomaterials. 1993;14(15):1117–1126. doi: 10.1016/0142-9612(93)90154-t. [DOI] [PubMed] [Google Scholar]
- 42.Raeber GP, Lutolf MP, Hubbell JA. Molecularly engineered PEG hydrogels: a novel model system for proteolytically mediated cell migration. Biophys J. 2005;89(2):1374–1388. doi: 10.1529/biophysj.104.050682. [DOI] [PMC free article] [PubMed] [Google Scholar]
- 43.Amsden B. Solute diffusion within hydrogels. Mechanisms and models. Macromolecules. 1998;31(23):8382–8395. [Google Scholar]
- 44.Amsden B. An obstruction-scaling model for diffusion in homogeneous hydrogels. Macromolecules. 1999;32:874–879. [Google Scholar]
- 45.Kirkwood J. Theory of Solutions. Gordon & Breach Science Publishers; New York, NY: 1968. [Google Scholar]
- 46.Peppas NA, Reinhart CT. Solute diffusion in swollen membranes. I: a new theory. J Membr Sci. 1983;15:275–287. [Google Scholar]
- 47.Peppas NA, Bures P, Leobandung W, Ichikawa H. Hydrogels in pharmaceutical formulations. Eur J Pharm Biopharm. 2000;50(1):27–46. doi: 10.1016/s0939-6411(00)00090-4. [DOI] [PubMed] [Google Scholar]
- 48.Peters T. All about Albumin: Biochemistry, Genetics, and Medical Applications. Academic Press; San Diego, CA: 1996. [Google Scholar]
- 49.Cerritelli S, Velluto D, Hubbell JA. PEG–SS–PPS: reduction-sensitive disulfide block copolymer vesicles for intracellular drug delivery. Biomacromolecules. 2007;8(6):1966–1972. doi: 10.1021/bm070085x. [DOI] [PubMed] [Google Scholar]
- 50.Lee Y, Koo H, Jin GW, et al. Poly(ethylene oxide sulfide): new poly(ethylene glycol) derivatives degradable in reductive conditions. Biomacromolecules. 2005;6(1):24–26. doi: 10.1021/bm049658l. [DOI] [PubMed] [Google Scholar]
- 51.Azegami S, Tsuboi A, Izumi T, et al. Formation of an intrapolymer complex from human serum albumin and poly(ethylene glycol) Langmuir. 1999;15:940–947. [Google Scholar]
- 52.Zustiak SPDR, Leach JB. Protein release characterization from hydrolytically degradable poly(ethylene glycol) hydrogels. Biotechnol Bioeng. 2010 doi: 10.1002/bit.22911. in revision. [DOI] [PMC free article] [PubMed] [Google Scholar]