

Abstract
Polymeric materials can be used to deliver nucleic acids such as DNA plasmids and siRNA, but often have low efficacy in human cells. To improve gene delivery, we synthesized an array of over 70 hydrolytically degradable and bioreducible poly(beta-amino ester)s and evaluated properties of over 200 nanoparticle formulations fabricated from these biomaterials. We determined the effect of different polymer structures on the delivery of nucleic acids of different structures and sizes, including siRNA, linear DNA, and circular DNAs (1.8–26 kb). Significantly, leading hydrolytically degradable polymeric nanoparticles delivered DNA to 90±2% of primary human glioblastoma cells with <10% nonspecific cytotoxicity, better than leading commercially available reagents (p<0.01). Bioreducible polymeric nanoparticles optimized for siRNA delivery caused up to 85±0.6% knockdown in these cells as well while maintaining high viability. From a single dose, knockdown was higher than for Lipofectamine™ 2000 (p<0.01) and persisted one month. Polymer molecular weight was a driving factor of transfection efficacy for some polymer structures (correlation of r2=0.63) but had no influence on transfection for other structures (r2=0.01). Polymers with a reducible cystamine functional group dramatically improved siRNA delivery by facilitating quick release while generally decreasing DNA delivery compared with non-reducible counterparts (p<0.01). Other material properties facilitated DNA delivery compared to siRNA delivery or increased delivery of both DNA and siRNA.
Keywords: bionanotechnology, structure-function relationships, DNA, siRNA, intracellular drug delivery
1. Introduction
Gene delivery has become an attractive focus of research because of its ability to target normally undruggable pathways,[1] the potential to cure genetic diseases rather than only alleviate symptoms,[2] and the versatility of such systems.[3, 4] However, a number of apparently promising clinical studies have been halted, primarily by safety problems due to toxicity or mutagenic effects of the viral delivery vector used.[5] The use of synthetic, non-viral delivery agents, such as polymers, can avoid certain safety issues as well as increase the range of nucleic acid cargos that can be used, the design flexibility to target specific cells, and the ease-of-production,[6] though this comes often at the cost of decreased efficacy.[3] Efforts in the field to increase the efficacy of non-viral vectors have shown poly(beta-amino esters) (PBAEs) to be an important class of polymers with low cytotoxicity and high transfection efficacy.[7–10]
In designing polymers with properties optimal for gene delivery, it is necessary to consider not only the polymer properties but also the interaction between the polymer and its nucleic acid cargo. For example, the ability to deliver both DNA and siRNA allows both up- and downregulation of a gene of interest, widely expanding the range of potential applications of gene therapy. While some researchers have used DNA delivery materials for successful siRNA delivery as well, we have found that for PBAEs, siRNA delivery is not necessarily maximized using polymers that were optimized for DNA delivery.[11] Lipid-based formulations have been extensively studied, such as Lipofectamine™ 2000, used here for comparison, but these are also limited by high cytotoxicity and low stability in conditions of high salt or serum.[12] Other researchers have used PBAEs conjugated to solid particles or scaffolds in order to achieve siRNA-mediated knockdown.[13] Nucleic acids of varying sizes and structures can have different biophysical properties, and their mechanisms and locations of action are often distinct. There is a need to understand on a mechanistic level how polymer properties should be tuned for the successful delivery of different types of nucleic acids within polymeric nanoparticles.
For the studies described here, we used human glioblastoma (GB) cells isolated from patients undergoing treatment for this grade IV brain tumor. Here, we show nanoparticle formulations with very high non-viral transfection efficacies (90%) for the delivery of both DNA and siRNA to primary human brain cancer cells. This is important because technologies like these could lead to the development of novel treatments for patients of GB, which has a very poor prognosis and a less than 5% 5-year survival rate with the current gold standard of care.[14] Here, we introduce new polymer structures to broaden our previously-reported PBAE library[15] and demonstrate that through controllable chemical and biophysical parameters, high efficacy for both DNA and siRNA delivery to human primary glioblastoma can be obtained. We find that the optimal PBAE polymer structure for intracellular delivery is dependent on the nucleic acid structure to be delivered. By studying various mechanistic steps necessary for intracellular delivery, including particle formation, particle stability, cellular uptake, pH buffering, and final protein production, we elucidate polymer properties that can contribute to each step. We further study a new set of reducible PBAEs whose properties are very different for DNA delivery compared to siRNA delivery, which may lead in the future to new classes of biodegradable and bioreducible polymers that are specifically optimized for siRNA delivery.
2. Results
2.1. Polymer synthesis
Polymers of varying molecular weights were successfully synthesized (Supporting Table 1) using the monomers summarized in Figure 1. In this report, polymers are referred to by their constituent monomers: diacrylate backbone monomer “B,” side chain amine “S,” and end-group small molecule amine “E.” Polymers are also referred to by their B:S molar ratio, which determines polymer molecular weight. For example, polymer “457, 1.2:1” is composed of monomers B4, S5, and E7 and synthesized at a B4:S5 molar ratio of 1.2:1. The molecular weight increased as the B:S ratio approached unity, with 1.2:1 the shortest chains and 1.05:1 the longest. End-capping had minimal effect on chain length.
Figure 1.
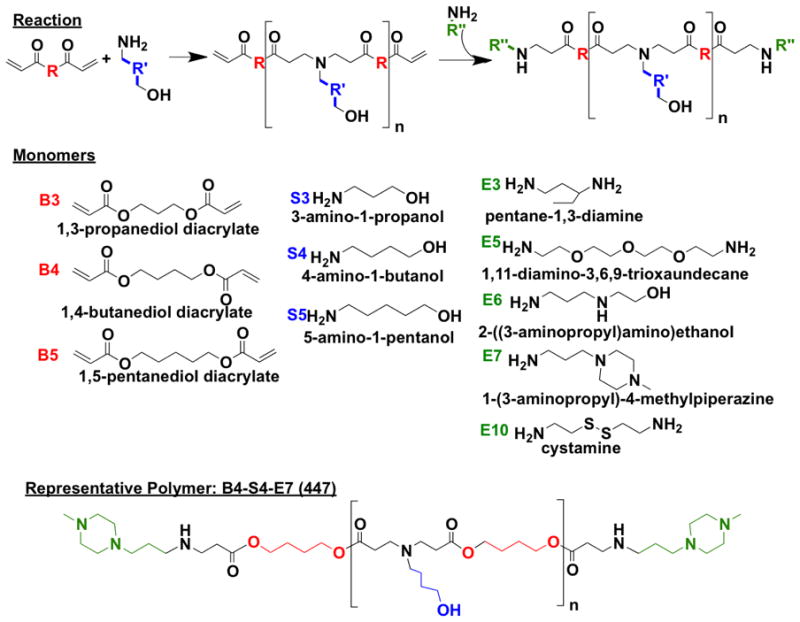
Monomers and reaction scheme used to synthesize PBAE library. One backbone monomer (B) was polymerized with one sidechain monomer (S). The diacrylate B-S base polymer was then terminated with one end-capping monomer (E).
2.2. Nanoparticle characterization: sizing (Nanoparticle Tracking Analysis, NTA)
The nucleic acids used in these studies were siRNA (linear, 21 bp), small circular DNA plasmid (1873 bp, “S-DNA”), medium circular DNA (4733 bp, “M-DNA”), medium linearized DNA (4733 bp, “lin-M-DNA”), long circular DNA (17522 bp, “L-DNA”), and long concatenated DNA (25704 bp, “con-DNA”). Henceforth, if the type of DNA is not specified, “DNA” refers to M-DNA, or pEGFP-N1 plasmid for enhanced green fluorescent protein (eGFP) expression.
Polymers used for nanoparticle characterization studies were selected to be structurally diverse, each containing a different end-cap and base polymer. Nanoparticle formation was driven by the electrostatic interaction and self-assembly between positively charged polymers and negatively charged nucleic acids. Three molecular weights were tested for each polymer type. Summarized in Figure 2A–B are nanoparticles that were subsequently found to have different DNA and siRNA delivery efficacies, with 453 representing a polymer somewhat effective for both, 356 effective for DNA but not siRNA, and 4310 more effective for siRNA than DNA. As seen in Figure 2A, the nanoparticles formed with DNA were typically 100–150 nm in diameter. There was relatively little variation in size among all 27 polymeric nanoparticle formulations tested. Generally, different lengths and structures of DNA showed similar particle formation patterns; siRNA-loaded particles were generally smaller (60–120 nm). The sizes of all of the formed nanoparticles (60–180 nm) are in the range conducive to cellular uptake.[16] The zeta potential of all tested polymers was positive but not excessive, with most formulations <+10 mV in 1X PBS buffer. E10-terminated PBAE 4310 showed the highest zeta potential with both DNA and siRNA (Figure 2C).
Figure 2.

Nanoparticle physicochemical characterization and uptake. A) DNA nanoparticles tend to have a mean diameter of approximately 100–180 nm, regardless of DNA size or structure, while (B) siRNA nanoparticles generally range from 60–120 nm. (C) Zeta potential of representative polymers showed positive but not excessive surface charge, with only E10-terminated PBAE 4310 having greater than +10 mV at some w/w ratios. (D) The difference in uptake between DNA and siRNA nanoparticles was statistically significant (Student’s t-test with Bonferroni correction; *p<0.05, **p<0.01) in many of the cases. (E) When grouped by base polymer, DNA uptake generally increases with molecular weight, a trend also visible for siRNA nanoparticles. (F) High uptake seems to require a mean particle diameter of 100–150 nm. Smaller (80–100 nm) siRNA nanoparticles were also amenable to high cell uptake.
2.3. DNA and siRNA uptake by GB cells
The DNAs and siRNA were labeled with Cy3 and used to form nanoparticles with PBAEs. Transfection in 10% serum showed high levels of cellular uptake (Figure 2D). To differentiate electrostatically bound particles on the cellular surface from true internalization, replicate cell wells were analyzed with and without washing with heparin. Cellular uptake was efficient, as almost all cells that were Cy3+ for cellular association were also Cy3+ for cellular uptake (Supporting Figure 4). Nanoparticles composed of longer molecular weight polymers caused higher uptake for certain nanoparticle types, with correlation coefficients of r2=0.79, 0.74, 0.53, 0.31, and 0.01 for base polymers 34, 43, 35, 44, and 45, respectively (Figure 2F). E10-terminated polymers were not included in this analysis, as most versions of these polymers tended to cause very high uptake and are examined as a separate class below. While siRNA uptake followed a similar profile to DNA uptake, there was generally lower uptake of siRNA compared to DNA when both types of nucleic acid were used at the same dose and weight ratio to polymer (Figure 2E). This trend was visible in all of the groups and was statistically significantly in half of them. Lipofectamine™ 2000 showed the reverse trend; uptake was higher when encapsulating siRNA rather than DNA. The composition of the base polymer (B-S) also had a much greater effect on uptake than the end-cap (E), as seen through the comparison between 357, 1.05:1, and the related 353, 355, and 356. The exception to this is the end-cap E10 (3510), which showed much higher uptake than other polymers with the same 35 base. High uptake required nanoparticles with an intermediate size range of 100–150 nm, although inclusion in this size range alone was not sufficient to cause high uptake (Figure 2G). siRNA-containing nanoparticles tended to have a smaller size requirement for high cellular uptake compared to DNA-containing nanoparticles. PBAEs were found to facilitate high DNA uptake of 98±0.3% and siRNA uptake of 98±2%, both in human GB cells; longer backbone (B) monomers, such as in the case of 44- and 45-based polymers, tend to be more effective and show a less significant discrepancy between DNA and siRNA delivery. As will be shown subsequently, both small particle size (60–150 nm) and high cellular uptake were necessary but insufficient requirements for effective transfection of DNA and siRNA. Differences in transfection efficacy between DNA and siRNA nanoparticles using the same polymer are not due to particle formation ability, as DNA- and siRNA-nanoparticles were generally measured to be at the same or similar concentrations (0.5–2.5 × 10⁸ nanoparticles/μg nucleic acid; Supporting Figure 1).
2.4. DNA delivery to GB 319 cells
In order to compare our materials to the optimal performance of commercially available reagents, two leading commercial agents, Lipofectamine™ 2000 and X-tremeGENE HP were screened for transfection efficacy and toxicity in GB 319 cells (Supporting Figure 2). Based on relatively low (<30%) cytotoxicity and high (>60%) transfection, Lipofectamine™ 2000 at 2.5 μg/mL final DNA concentration per well was used as the point of comparison for further studies. Higher dosages resulted in too high cytotoxicity (~60%), and Lipofectamine™ 2000 performed as well or better than X-tremeGENE HP with these cells. As seen in Figure 3A, transfection of up to ~90% were achievable with several PBAE formulations. This figure also shows trends relating the structure of the polymer to its transfection efficacy. Polymers are grouped on the x-axis by end-cap (E). Within each E, polymers increase in hydrophobicity (estimated here as the number of methylene units in each B-S subunit) from left to right. Within each of these groupings, molecular weight increases from left to right. When all polymer formulations that caused >10% toxicity are removed from the data set (Figure 3B), there are still eleven formulations that are significantly superior (α=0.01) to the transfection efficacy of the optimized Lipofectamine control and one more that is significant at a lower critical value (α=0.05). The top DNA nanoparticle formulations are 433, 1.1:1, 90 w/w; 455, 1.1:1, 60 w/w; and 436, 1.1:1, 90 w/w. This comparison allowed higher cytoxicity in the Lipofectamine positive control (30±20%) than in the PBAE-based samples <10%). If Lipofectamine is held to the same stringent criterion by using results from a dose that caused only 7±8% toxicity, then 78 of the polymeric nanoparticle formulations are significantly superior with p<0.05 (not shown in figure).
Figure 3.

DNA transfection of GB cells. (A) eGFP DNA was transfected into GB 319 cells in 10% serum-containing medium. Bars indicate transfection efficiency. Polymers are grouped first by end-cap (E); within each E, polymers increase in hydrophobicity (left to right) and increase in molecular weight (left to right) within each of those. The positive control on the right side of the graph is optimized Lipofectamine 2000 (2.5 μg/mL DNA dose, 5:2 formulation). (B) When considering only polymers with <10% toxicity, 12 formulations (black bars) are significantly superior to Lipofectamine 2000 positive control (*p<0.05, **p<0.01), even though this formulation of Lipofectamine causes 30% cytotoxicity.
Although it is apparent from the overview in Figure 3A that increasing hydrophobicity and molecular weight both increase the transfection efficacy of the polymers, when transfection efficacies of the entire polymer array at 60 w/w (mass polymer to mass DNA) are plotted against weight-averaged molecular weight (Mw), there is no clear correlation (Figure 4A), with r2=0.12. However, when molecular weight as a variable is isolated from confounding factors, the correlation becomes clearer. For example, for polymers based on B3-S4, transfection increases exponentially with increasing molecular weight within each of the end-caps, with a correlation coefficient of r2>0.98 in all cases (343, 345, 346, 347) except that of 3410 polymers (Figure 4B). The B3-S4 polymers generally did not have high transfection capability, however, so the range over which transfection increases is fairly small. A more interesting example is that of B3-S5 polymers, which show a linear correlation within each of the end-caps with similarly high correlation coefficients (r2>0.96 for all (353, 355, 356, 357) except 3510 polymers, which had r2=0.47 (Figure 4C). This trend spanned from 10–20% transfection with low Mw polymers to 60–70% transfection with high Mw polymers. Interestingly, certain base polymers showed a stronger correlation between MW and transfection than other polymers. When all polymers based on B3-S5, including all end-caps, are graphed together, a moderately high positive correlation of is still seen (r2=0.63 and r2=0.76 for all non E10 B3-S5 polymers) (Figure 4D). B4-S5, on the other hand, shows no apparent correlation, with r2=0.01 (Figure 4E), despite differing from B3-S5 by only one carbon in the backbone (B) monomer.
Figure 4.

MW dependence on transfection efficacy. (A) Transfection with PBAEs at 60 w/w is not strongly determined by molecular weight. However, within certain base polymers, transfection has a strong positive correlation with molecular weight (B–D), while other very similar base polymers show no correlation (E).
2.5. siRNA delivery to GFP-GB cells
GFP+ GB cells were transfected with siRNA against eGFP (siGFP) using PBAE nanoparticle methods. Based on previous results[11] and the physicochemical data gathered above, siRNA nanoparticles were formulated at higher polymer-to-nucleic acid (w/w) ratios. In the absence of serum, PBAE-siRNA nanoparticles showed a similar trend to that seen in DNA nanoparticles. In Figure 5A, polymers are arranged as in Figure 3 in blocks according to E group, with polymer B-S base increasing in hydrophobicity from left to right within each E and increasing in MW from left to right within each B-S base.
Figure 5.

PBAEs delivered siRNA to GB 319 cells in serum-free medium and caused high knockdown after 5 days. (A) E10-terminated polymers were the most effective of the end-caps tested. (B) Knockdown efficiency (no E10) is correlated with PBAE molecular weight for some base polymers but not (C) other closely related ones. (D–E) Viewing the data from all polymers together shows two subpopulations, with a nearly all-or-nothing knockdown response.
High GFP knockdown of >80% in human glioblastoma cells within 5 days of transfection is possible using PBAEs with a 60 nM siRNA concentration. Most of the polymers show increasing efficacy with increasing hydrophobicity and molecular weight, although polymers terminating in E10 are once again anomalous. In contrast to DNA transfections, for which E10 polymers were less effective than expected in causing gene expression compared to their uptake efficiency, they are strikingly the most effective group for siRNA delivery.
As with DNA delivery, there are some base polymers for which increasing molecular weight has a moderate positive correlation with siRNA delivery efficacy, such as B3-S5; others, like B4-S5, have little to no apparent correlation (Figure 5B–C). Interestingly, when all polymers tested are plotted together, there appear to be two sub-populations within the PBAEs, one of which tends to have very high siRNA delivery efficacy while the other has little or no efficacy (Figure 5D). Removing E10 polymers from consideration shows that B4-S4 and B4-S5 are more effective in general than the less hydrophobic polymers (Figure 5E). Under the best conditions, the high knockdown of 90–100% persisted from approximately the 5th until the 12th day after transfection, 60% knockdown was still seen after 20 days, and knockdown remained significant for over a month (Figure 6A–B).
Figure 6.

siRNA delivery to GB cells. (A) Top PBAEs such as 4310, 1.2:1, are significantly better than Lipofectamine 2000 in delivering siRNA, with knockdown duration spanning over one month (no serum). (B) Fluorescence microscopy 8 days after the 4310 transfection without serum showed a decrease in the GFP signal from GFP siRNA-treated cells (bottom) compared to scrRNA-treated cells (top). In both sets of images, brightfield and GFP are merged on the left; GFP only is shown on the right. Scale bar: 200 μm. (C) siRNA Transfection in 10% serum resulted in lower knockdown, with only the E10-terminated polymers able to cause above 50% knockdown.
While some formulations still retained high efficacy in 10% serum with up to 70±1% knockdown after 5 days, many others showed insignificant knockdown (Figure 6C). Moreover, in serum-free conditions, high siRNA knockdown (90–100%) was achievable by doses as low as 5 nM, albeit with the much higher polymer-to-DNA ratio of 1200 w/w (Supporting Figure 5). With the same polymer and siRNA conditions in complete medium containing 10% serum, only 60 nM transfections showed high efficacy (70% knockdown), with very little efficacy seen in 30 nM transfections (up to 12% knockdown).
Similar to analyses of uptake efficiency based on particle size (Figure 2), highly effective polymers for DNA transfection fell within the range of 100–150 nm mean hydrodynamic diameter (Figure 7A). As with uptake, this size was necessary but not sufficient for high transfection. In contrast to DNA delivery, siRNA efficacy did not always follow nanoparticle uptake efficiency. In particular, sub-100 nm nanoparticles were poorer at knockdown compared to larger 110–150 nm siRNA-containing nanoparticles. Nanoparticles formed with 4310, one of the top polymers for siRNA delivery, tended to form larger particles that were similar in size to DNA nanoparticles (Figure 2), with mean and mode diameter between 110–150 nm and 100–130 nm, respectively. In comparison, the smallest nanoparticles seen in this study were those with siRNA and 453, 1.2:1, with mean and mode diameters of 66 nm and 61 nm, respectively, with approximately 20% knockdown efficiency in serum-free medium despite high uptake. Figure 7B suggests that, as with DNA, the best siRNA-containing nanoparticles were those with 100–150 nm mean diameter. A difference between nucleic acid-containing particles seems to be the size of the less effective nanoparticles, with less effective DNA particles tending to form into larger clusters and less effective siRNA particles tending to form very small nanoparticles. It may be that not all mechanisms of nanoparticle uptake are equal, and the partitioning of uptake mechanisms is dependent on nanoparticle size, with 100–150 nm nanoparticles having a preferable uptake pathway.
Figure 7.

Dependence of transfection efficiency on size. Plots of transfection efficiency vs. mean diameter show that optimal polymers form particles of 100–150 nm in mean diameter for both (A) DNA and (B) siRNA.
Based on siRNA transfections carried out in serum-free medium, similar experiments were performed with DNA particles (Supporting Figure 6). In particular, a lower dose was sufficient for effective transfection with no toxicity, with 457 variants at 60 w/w causing 30–55% transfection even with only one-fifth of the standard DNA dose, or 1 μg/mL final DNA concentration. As with the previous experiments in serum, little dependence on molecular weight was seen in transfection efficacy. Interestingly, the shortest chain of 457, 1.2:1, showed higher transfection at half (0.5X) dose compared to the others, as well as less toxicity at that dose. Therefore, while 45-based polymers are normally very effective at transfection in 10% serum, increased toxicity in serum-free medium caused differences in transfection based on molecular weight. 357 was also more effective in the absence of serum, with 75–80% transfection at the standard dose for 1.05:1 and 1.1:1 formulations compared to 25–45% with serum. Similar to transfections in serum, 357’s efficacy was dependent on molecular weight, with much lower transfection (19±7%) caused by the shorter chain 357, 1.2:1, though this was still an improvement over transfection in serum (3.7±0.9%). This is consistent with the literature that reports serum proteins are able to non-specifically coat and/or destabilize nanoparticles, preventing them from effectively interacting with cells.[17] The nanoparticles described here can be used at low dose for effective and safe transfection in the presence of serum, as well as at even lower dose in the absence of serum for in vitro transfection applications.
2.6. Characterization of bioreducible polymers: cystamine (E10)-terminated
For both DNA and siRNA delivery, E10-terminated polymers did not follow the trends seen with the majority of the other polymers. Paired comparisons between E3- and E10-terminated polymers showed E3-polymers to be more effective in DNA transfection, particularly in all cases with transfection efficiencies above 40% (Figure 8). This comparison is most clear with polymers used at 60 and 90 w/w, among which E3-polymers but not E10-polymers were able to achieve approximately 90% transfection. Interestingly, some polymers showed moderate transfection with an E10-polymer and little to no transfection with the E3-analog. This trend generally applied to base polymers with either low hydrophobicity, low molecular weight, or both. Gel retardation assays showed that addition of 5 mM of the reducing agent glutathione (GSH) to fully complexed nanoparticles causes near-immediate release of siRNA via reduction of the disulfide bridge in the E10 monomer, as we have recently described,[11] suggesting a major mechanism by which E10-polymers are most effective for siRNA delivery (Figure 8E); notably, 5 mM GSH is not sufficient to cause release of DNA.
Figure 8.

Comparisons between E10- and E3-terminated polymers for DNA delivery. E10-polymers show significant differences in DNA transfection ability compared to other end-caps like E3. (A–C) For moderately to highly effective polymers, the E3 end-cap was much more effective; for otherwise very ineffective polymers, the E10 end-cap was more- effective. Significance was calculated with a paired t-test with a Bonferroni correction to account for 15 different comparisons (*p<0.05, **p<0.01). (D) By microscopy, this difference in GFP DNA delivery was also striking. (E) E10-polymers like 4510, 1.1:1, bound both DNA and siRNA efficiently in buffer alone (PBS) but show different profiles upon addition of glutathione (GSH). Numbers above lanes refer to polymer-to-nucleic acid w/w ratio.
In addition to causing quick release via its bioreducible disulfide bridge, E10-polymers may also improve the initial binding to siRNA. As seen in Figure 9, fluorescence quenching assays with the DNA intercalating dye Yo-Pro-1® Iodide (Yo-Pro) show tighter binding between 4510 and all nucleic acids tested, compared with 453 of similar molecular weight, based on the minimum polymer concentration needed for >95% Yo-Pro quenching (Supporting Table 2). This remains consistent after increasing the salt concentration as well.
Figure 9.

Binding-strength assays for E10- and E3-polymer comparisons. Yo-Pro studies showed that E10-terminated polymers bind more tightly in general than polymers with other end-caps like E3. (A, C) This occurs both immediately after complexation and (B, D) after addition of salt.
3. Discussion
Optimal DNA delivery to primary human GB cells was 90% of cells in 10% serum, with similar efficacy using lower DNA dose in the absence of serum (>50% transfection with 1 μg/mL dosage). siRNA delivery was effective at 60 nM dose in 10% serum (up to 70% knockdown) and in the absence of serum (80–90% knockdown). Significantly, knockdown persisted for weeks, with 30–40% knockdown still seen after 30 days, and approximately 90% knockdown was also achieved with a 5 nM dose by using higher polymer concentration without a significant increase in cytotoxicity. This compares favorably to other reported methods of non-viral siRNA delivery, which often require extensive synthesis or chemical modification and conjugation processes,[18–20] need higher siRNA dosage for effectiveness,[21] use serum-free or reduced-serum medium,[20, 22] or use easier-to-transfect model cells like HEK293T or HeLa cells.[18, 23] Transfection of a high a percentage of cells is particularly essential in GB cells because recurrence is very common and a major reason for the poor prognosis associated with GB.[24].
Physicochemical characterization of nanoparticles suggests that the same polymers will be useful for delivery of different DNA sequences without regard to nucleic acid size (1.9 kb-26 kb), sequence, or structure (linear vs. plasmid). This is a wider range of nucleic acid sizes than previously tested for PBAEs[7] and demonstrates that the only limitation to carrying capacity may be a fixed number of total base pairs of nucleic acid per particle in the range of 140–560 kbp per particle.[25] PBAE-siRNA nanoparticles had a different size distribution compared to PBAE-DNA particles (Figure 2B), suggesting a significant difference in the two types of nanoparticles. For example, 453, representing a polymer moderately effective for delivery of both types of nucleic acid, forms siRNA nanoparticles as small as 60–70 nm in mean hydrodynamic diameter, while the smallest DNA nanoparticles formed with 453 are over 110 nm in diameter. Interestingly, some smaller siRNA nanoparticles showed efficient uptake but not necessarily higher transfection. Both siRNA and DNA PBAE nanoparticles must be within the same approximate size range (100–150 nm diameter) for successful transfection. Washing with heparin to dislodge nanoparticles from the cell surface showed that internalization after cell surface binding is not a major barrier in our delivery system. Although detailed surface characterization is outside the scope of this study, the positive zeta potential found in all formulations (Figure 2C) suggests that the nanoparticle surface was largely comprised of cationic polymer, which was in all cases present in greater amounts than nucleic acid. The positive surface charge facilitates interactions with the cell surface, while the relatively low charge (<+10 mV) in most cases) is not excessive and, as transfection studies showed, does not prevent transfection in serum-containing medium.
Increasing molecular weight generally correlated with increased DNA and siRNA delivery. This is in agreement with other researchers’ previous work on DNA delivery in serum-free conditions, with the current study broadening these findings to different PBAE structures, different nucleic acids, and serum-containing medium.[26] An important difference from the earlier studies with PBAEs[26], is that in the current work, the structure of the terminal polymer end-group is specifically designed and controlled independently of the base polymer due to an additional synthesis step, whereas in the earlier work, the end-group was the monomer used in excess during the base polymer synthesis. The correlation with molecular weight, however, was not seen in B4-S5-based polymers for either nucleic acid. This may be due to B4-S5-based polymers approaching a maximum possible transfection efficiency: little further enhancement can be made by varying MW. This further demonstrates how significant a single carbon’s difference in the backbone can be to the polymer structure. Critically, this single carbon difference affects transfection independently of other polymer structure, polymer molecular weight, and polymeric nanoparticle size, as these parameters are the same between B3-S5-based and B4-S5-based polymers for both DNA and siRNA delivery. There was relatively little variation in particle size among all polymeric nanoparticle formulations tested within any type of nucleic acid, making it unlikely that particle size is a significant factor in determining transfection efficacy for these nanoparticles.
In addition to correlation with molecular weight, siRNA nanoparticles based on B4-S4 and B4-S5 were the only base polymers to be generally highly effective in knockdown, resulting in two broad populations of polymers seen in Figure 5D–E and suggesting that hydrophobicity is an even more important requirement for siRNA delivery than for DNA delivery in the range of polymers studied here. Unlike DNA nanoparticles, which often show gradually increasing efficacy among PBAEs of varying molecular weights or end-groups, the siRNA nanoparticles tested had a nearly all-or-nothing data set; certain nanoparticles had almost no measurable effect when added to cells. While PBAE nanoparticles can be highly effective for siRNA delivery, the particles formed may be less stable. However, PBAEs that are largely ineffective for siRNA delivery can be tuned using certain chemical moieties like E10, making them into highly effective polymers for siRNA delivery. Our results are in agreement with recent work by Eltoukhy et al., which studied the effect of chain length on DNA delivery using a small subset of PBAEs from their library.[27] Here, we present data on PBAEs with different chemical moieties (such as E6, E7, and E10) and examine several other factors that must be taken into account when selecting or tuning polymers for DNA as well as siRNA delivery.
For both DNA and siRNA, addition of the E10 (cystamine) end-cap compensated for deficits in delivery capacity for certain base polymers. In the case of DNA, for base polymers effective with the E3 end-cap, replacing the end-cap with E10 decreased DNA delivery efficacy. E10-terminated polymers were more effective than E3-terminated polymers only in the cases where E3-terminated polymers had particularly low efficacy. These cases occurred with polymers that were more hydrophilic, had lower molecular weight, and/or were used at lower polymer-to-DNA w/w ratio, implying that E10, with its stronger binding to nucleic acids in non-reducing conditions (Figure 9), may have a role in stabilizing certain nanoparticles that would otherwise be less-effective. Similarly, measuring the release of DNA and siRNA from PBAE nanoparticles such as 447 in buffers of 150 mM salt and physiologically relevant pH show that the binding strength between PBAE and siRNA is not sufficient to prevent some immediate release of siRNA (Supporting Figure 7). In non-reducing environments, through the addition of a primary and secondary amine to each end of a linear polymer, E10-polymers may cause an increase in binding affinity that is necessary for successful nucleic acid delivery in certain cases. When these polymers subsequently enter a reducing environment, there is then environmentally triggered release and decreased binding affinity due to the reducible disulfide linkages that separate the primary amines from the ends of the linear polymers.
The primary difference in transfection efficacy with E10-polymers between DNA and siRNA delivery is likely due to the reducible group in the E10 (cystamine) molecule, which facilitates rapid partial polymer degradation and cleavage of primary amines from the polymer upon encountering GSH in the cytoplasm for triggered release of nucleic acid cargo. DNA remains bound despite this partial degradation, likely because of increased avidity from the more highly multivalent binding interaction with DNA. However, the smaller siRNA molecule, while initially more tightly bound, is readily released intracellularly. The release property of E10-terminated polymers is particularly useful for siRNA delivery, as siRNA acts primarily in the cytoplasm, where triggered release occurs. It may be that for the case of siRNA delivery, knockdown is maximized when siRNA is released to the cytoplasm all at once. E10-terminated polymers enable environmentally triggered release of siRNA in this binary fashion. For DNA delivery, release that is more continuous and driven by hydrolytic degradation of the base polymers over time may be preferable. The ability to synthesize, characterize, and identify polymers highly effective for non-viral DNA delivery, siRNA delivery, or both to primary brain cancer cells provides a potential enabling tool to treat glioblastoma.
4. Conclusion
Nucleic acids of various sizes and structures require different polymer characteristics for effective delivery. DNAs tend to have similar binding and particle formation capacity within the range 1.9–26 kb, which is likely due to the size discrepancy between DNA (1–17 MDa), and the much smaller polymers (5–50 kDa) used to complex with them. Molecular weight and hydrophobicity can be important parameters for optimization of DNA transfection, with longer polymers tending to cause better transfection, although this trend does not hold true for polymers that are more hydrophobic or very effective even at low molecular weight. Importantly for potential use as a GB therapy, this nanotechnology allows us to deliver DNA successfully into 90±2% of human cancer cells with low non-specific toxicity using 433 synthesized at a 1.1:1 ratio of B4:S3. The correlation with molecular weight is also seen with siRNA. Studies of the physical properties of different types of nanoparticles suggest that siRNA delivery requires a polymer that can release it efficiently once inside the cytoplasm. Polymeric nanoparticles such as 4310 synthesized at 1.2:1 or 1.1:1 base monomer ratio resulted in up to 85±0.6% knockdown after 5 days with >90% knockdown up to 15 days. The bioreducible E10 end-cap affords this capability for siRNA delivery, causing nearly complete gene knockdown to human brain cancer cells even at very low dosages (5 nM), while still remaining somewhat effective for DNA delivery. This encourages further studies of disulfide-containing PBAEs for siRNA delivery. Other polymer structural properties, such as the use of the B4-S5 base and the E7 end-cap, allow effective delivery of both siRNA and DNA. The high transfection efficiencies seen here, as well as the ability to design materials optimal for delivery of different nucleic acid cargos based on polymer properties, may prove useful for a potential future brain cancer therapy.
5. Experimental
5.1. Materials
Small molecule monomers used for synthesizing polymers (Figure 1) were obtained as follows: 1,3-propanediol diacrylate (B3; Monomer-Polymer and Dajac Labs, Trevose, PA); 1,4-butanediol diacrylate (B4; Alfa Aesar, Ward Hill, MA); 1,5-pentanediol diacrylate (B5, Monomer-Polymer and Dajac Labs); 3-amino-1-propanol (S3, Alfa Aesar); 4-amino-1-butanol (S4, Alfa Aesar); 5-amino-1-pentanol (S5, Alfa Aesar); 1,3-diaminopentane (E3; TCI America, Portland, OR); 1,11-diamino-3,6,9-trioxaundecane (E5, TCI America); 2-(3-aminopropylamino)ethanol (E6, Sigma Aldrich); 1-(3-aminopropyl)-4-methylpiperazine (E7, Alfa Aesar); and cystamine dihydrochloride (E10, Alfa Aesar). Lipofectamine™ 2000 and Opti-MEM I were from Invitrogen (Carlsbad, CA), and X-tremeGENE HP from Roche (Indianapolis, IN) and optimized according to manufacturer instructions. For gel electrophoresis, UltraPure™ agarose was purchased from Invitrogen. siRNA against eGFP (siGFP) with 5′-CAAGCUGACCCUGAAGUUCTT (sense) and 3′-GAACUUCAGGGUCAGCUUGCC (antisense) (Silencer® positive control) and a scrambled siRNA sequence (scrRNA) with 5′-AGUACUGCUUACGAUACGGTT (sense) and 3′-CCGUAUCGUAAGCAGUACUTT (anti-sense) (Silencer® negative control #1) were designed by and purchased from Ambion, Inc. (Carlsbad, CA). pEGFP-N1 (eGFP) DNA plasmid was amplified by Aldevron (Fargo, ND) and used for screening purposes. Heparin was purchased from Sigma (St. Louis, MO). Other materials were reagent grade.
5.2. Polymer synthesis
Polymers were synthesized using a modification of previously-reported protocols.[9, 10] One backbone diacrylate monomer (B3, B4, or B5) was mixed with one sidechain monomer (S3, S4, or S5) at a 2:1, 1.5:1, 1.2:1, 1.1:1, or 1.05:1 molar ratio of B:S. The reaction was carried out with stirring for 24 hr at 90°C to allow formation of the base polymer (B-S). The base polymer was dissolved in DMSO (167 mg/mL), and B-S in DMSO (480 μL) was mixed with a solution of one end-capping monomer (E3, E5, E6, E7, or E10) in DMSO (320 μL, 0.5 M) and vortexed for 20 sec at room temperature. The resulting polymer (B-S-E) in DMSO (100 mg/mL concentration of B-S) was kept at room temperature for 1 hr without shaking to allow completion of the reaction while minimizing chain cleavage as a side reaction, then stored at −20°C unless otherwise indicated. 1H-NMR showed that end-capping was complete after 1 hr at room temperature for all end-caps except E10, which required an additional 4 days for acrylate groups to react completely. E10-terminated polymers were incubated at room temperature for 5 days to allow completion of the end-capping reaction as determined by 1H-NMR (Supporting Figure 3), then stored at −20°C to avoid further reaction during storage.
5.3. Chemical analysis of polymers
All polymers used in this study, including base polymers (B-S) as well as end-capped polymers (B-S-E) were dissolved in BHT-stabilized tetrahydrofuran with DMSO (5%) and piperidine (1%), filtered through a 0.2-μm PTFE filter, and measured with gel permeation chromatography (GPC; Waters, Milford, MA) to determine molecular weight distribution. Polymer degradation rate was measured by diluting free polymer in solution or polymer-nucleic acid nanoparticles in 150-mM buffers of pH 5, 6, or 7 (final polymer concentration 0.25 mg/mL). Samples were incubated at 37°C with shaking. At various time points, samples containing polymer (5 mg) were removed, snap-frozen with liquid nitrogen, and lyophilized 48 hr before being dissolved in GPC buffer (above) and analyzed.
For 1H-NMR analysis, the E3, E7, and E10 end-caps alone, B4-S3 base polymer on its own at 1.2:1 and 1.1:1 acrylate:amine ratio, and fully end-capped 433, 437, and 4310 at both acrylate:amine ratios were dissolved in deuterated DMSO (10 mg/mL) with tetramethylsilane (TMS, 0.03% v/v) as an internal standard. NMR spectrum acquisition was done using a 400 MHz Bruker and TopSpin 2.0 software. Spectral analysis was done using NMR Processor v.12 (ACD Labs, Toronto, Canada).
5.4. Nanoparticle uptake by GB 319 cells
Plasmid eGFP DNA or scrRNA was labeled with Cy3 using Label IT Tracker kit (Mirus Bio) according to the manufacturer’s instructions and was diluted with unlabeled nucleic acid to a final dye-to-nucleotide molar ratio of 1:350. Transfections were then carried out on GB 319 cells (previously isolated as described[9]). Cells were cultured in complete GB medium [DMEM/F12 (1:1) with 10% fetal bovine serum (FBS) and 1% Antibiotic-Antimycotic (AB/AM)]. Before transfections, they were trypsinized and seeded into flat-bottom, tissue culture-treated 96-well plates (1.5*104 cells/well, 100 μL medium/well). Cells were allowed to adhere overnight at 37°C and 5% CO2. Twenty-four hr after cell seeding, Cy3-eGFP plasmid DNA or Cy3-siGFP was diluted in sodium acetate buffer (25 mM buffer, pH 5, 0.06 mg/mL nucleic acid). Polymer was diluted in sodium acetate (3.6 mg/mL) and added to DNA solution in a 1:1 volume ratio, for a final polymer-to-DNA weight ratio (w/w) of 60. This solution was mixed by pipetting, then incubated at room temperature for 10 min for complexation and self-assembly to occur between the positively charged polymer and the negatively charged nucleic acid. The resulting nanoparticles were added to cells in complete medium (final dose 5μg/mL) with n=4 replicates. Note that the siRNA concentration used here for uptake is higher than that used in knockdown experiments (see below) in order to be able to directly compare DNA and siRNA uptake. Cells were incubated with the particles for 2 hr before the media were changed and replaced with complete GB medium. Immediately after the incubation period, media were aspirated, and the cells were washed with PBS. In a duplicate set of plates, cells were then incubated with heparin in water (50 μg/mL) at room temperature for 15 min before aspirating the heparin and washing the cells once more with PBS. All cells were then trypsinized and analyzed using high-throughput flow cytometry. The percentage of cells with uptake was calculated using Cy3 signal from the FL2 detector (emission: 580/40 nm).
5.5. Nanoparticle characterization: Nanoparticle Tracking Analysis (NTA)
DNA or siRNA was diluted in sodium acetate buffer (25 mM, pH 5). Polymer was diluted in sodium acetate and added to DNA or siRNA solution in a 1:1 volume ratio, for a final polymer-to-DNA weight ratio (w/w) of 30–150 and final nucleic acid concentration of 5 μg/mL. This was mixed by pipetting, then incubated at room temperature for 10 min for complexation to occur. The resulting nanoparticle suspension was diluted 1:100 in 1xPBS, then measured using a NanoSight NS500 and analyzed with NanoSight NTA 2.2 software. Reported values are number-weighted.
5.6. Polymer-nucleic acid binding assay: fluorescence quenching
The fluorescent dye Yo-Pro®-1 Iodide (Molecular Probes®, Invitrogen) (Yo-Pro) was used to quantitatively measure the strength of polymer-to-nucleic acid binding. Stock DNA or siRNA was diluted in sodium acetate buffer (25 mM, pH 5) to a final concentration of nucleic acid bases of 1.33*10−6 M. Yo-Pro was then diluted the same way to the same final molar concentration. The nucleic acid solution was aliquoted to each well of a black opaque 96-well plate (50 μL/well) and mixed with Yo-Pro solution (50 μL). The polymer was then diluted in sodium acetate at a range of repeat unit concentrations (from 0–512 times the concentration of Yo-Pro). Polymer solution (50 μL) was then added to the nucleic acid/Yo-Pro complexes. After 10 minutes, a fluorescence multiplate reader was used to measure the Yo-Pro fluorescence from each well. Fluorescence quenching correlates with polymer binding to nucleic acid through the displacement of Yo-Pro and was used to assess binding strength.
To test the effect of increased salt concentration on release, after the initial fluorescence reading at 10 min, 1xPBS or 4xPBS (50 μL) was added to each well (final osmolarity of 37.5 mM and 150 mM, respectively). After 15 min, the fluorescence was again measured with the plate reader. Linear interpolation was used to calculate the polymer concentration needed for 50% or 95% Yo-Pro quenching for each condition.
5.7. Polymer-nucleic acid binding assay: gel electrophoresis
Gel retardation assays were carried out by adding polymer of varying concentrations in sodium acetate buffer to a constant concentration of DNA or siRNA in sodium acetate, as with normal particle preparation protocols (above). After 10 min of incubation, a solution of glycerol in water (30%) is added at a 1:5 volumetric ratio as a loading buffer. Bromophenol blue or other dyes were not added to minimize any interference with binding. Samples were loaded into a 1% agarose gel with ethidium (1 μg/mL) bromide with DNA or siRNA per well. Samples were run for 15 or 30 min for siRNA and DNA, respectively, under 100 V, then visualized using UV exposure. Lack of visible band was considered complete complexation of the nucleic acid by polymer.
To test the effect of a reducing agent, after 10 min of complexation, 1xPBS buffer alone or 1xPBS with L-glutathione (GSH) was added to each tube of particles (final GSH concentration of 5 mM). Samples were immediately loaded into an agarose gel and run for 15 or 30 min under 100 V before visualization under UV.
To observe release kinetics, eGFP DNA or siRNA was complexed with a polymer as above, then diluted 1:5 (v/v) in a buffer solution (150 mM) of pH 5 (sodium acetate), pH 6 (sodium citrate), or pH 7 (PBS) and incubated at 37°C with shaking. At various time points, loading buffer was added, and the samples were loaded onto a 1% agarose gel and run for 30 or 15 min for DNA or siRNA, respectively, under 100 V. The gels were soaked in ethidum bromide (1 μg/mL) in 1xTAE buffer for 15 min, destained in water for 15 min, and visualized using UV exposure.
5.8. Comparison of nucleic acids of varying lengths and structures
The eGFP DNA plasmid used in this study was circular and 4733 bp, while the siRNA used was linear and 21 bp. In order to test a wider range of sizes and structures, the circular pEGFP-N1 plasmid was digested with BsrGI restriction enzyme (New England Biolabs, Ipswich, MA), yielding a single band corresponding to the linearized 4733 bp plasmid, which was isolated and extracted using a gel extraction kit (Qiagen, Valencia, CA) according to the manufacturer’s protocol. For a smaller sample, pUC19 was digested with sspI-HF and pvuII restriction enzymes (New England Biolabs), yielding four fragments (322, 491, and 1873 bp). The 1873-bp fragment containing the ampR gene and origin of replication was isolated and purified as above. This was then ligated using T4 DNA ligase (New England Biolabs) at room temperature for 2 hr, transformed into DH5α competent cells (Invitrogen), plated onto LB Agar (Sigma) with 100 mg/mL carbenicillin, and incubated for 24 hr at 37°C. Resulting colonies were grown in 2XYT (Sigma) with carbenicillin (100 mg/mL) with continual shaking for 16 hr. The 1873-bp plasmids were isolated using QIAprep Spin Miniprep Kit (Qiagen) and verified by digesting with sspI and bglI. These plasmids were amplified in DH5α cells and isolated as needed.
Larger plasmids obtained from Addgene included pEP4-E02S-ET2K (Addgene plasmid 20927[28]) and pCEP4-M2L (Addgene plasmid 20926[28]), which are approximately 17500 bp and 13000 bp, respectively. A 100% concatenated version of pCEP4-M2L was isolated by Aldevron (Fargo, ND) and was approximately 26000 bp in total.
To compare the effect of nucleic acid size or structure on nanoparticle properties, all of the aforementioned nucleic acids (linear siRNA, 21 bp; circular DNA, 1873 bp, “S-DNA”; pEGFP-N1 circular DNA, 4733 bp, “M-DNA”; pEGFP-N1 linear DNA, 4733 bp, “lin-M-DNA”; circular DNA, 17500 bp, “L-DNA”; and concatenated circular DNA, 26000 bp, “con-DNA”) were used for binding studies using Yo-Pro quenching and gel retardation and for nanoparticle size measurements using NTA.
5.9. DNA delivery to GB 319 primary human glioblastoma cells
GB 319 cells were transfected as described above with unlabeled eGFP plasmid DNA. Polymer-to-DNA w/w ratios from 30–90 were tested (1.8–5.4 mg/mL polymer diluted in 25 mM sodium acetate was mixed with 0.06 mg/mL DNA in sodium acetate at a 1:1 volume ratio). For initial screening, final DNA dose was 5 μg/mL for all polymer treatment groups. Selected polymers were also retested with transfection in the absence of serum by replacing the cell medium with serum-free medium prior to the transfection.
After 24 hr, an MTS assay (CellTiter Aqueous One, Promega, Madison WI) was used to assess cell viability according to the manufacturer’s protocols. After 48 hr, cells were trypsinized and transferred to round-bottom 96-well plates in 1xPBS FBS (2%). eGFP expression was measured by flow cytometry using an Accuri C6 flow cytometer with an Intellicyt high-throughput loader. Reported values are the percent of GFP+ cells calculated using the signal from the FL1 detector (emission: 530/30 nm).
5.10. siRNA Delivery to GFP+ GB 319 (GFP-GB) cells
GB 319 cells were transfected with eGFP DNA using a variant of polymer 453, 1.2:1 as previously reported, resulting in a small fraction of cells that remained GFP+ for many months.[9] After 3 months of culture, the cells were sorted by FACS (FACSort, BD Biosciences), and the cells that had remained GFP+ (1.2%) were cultured in complete GB medium. They were sorted again by FACS after 7 passages to isolate the remaining cells that were still GFP+ (44.6%, referred to henceforth as GFP-GB), then used at P2-P8 for all the following studies.
GFP-GB cells were plated in 96-well plates (1.5*104 cells/well) and allowed to adhere overnight. Before transfection, the GFP signal from each well was measured using a fluorescence multiplate reader (Synergy 2, Biotek). Background signal was subtracted using GFP− GB 319 cells seeded alongside the GFP-GB cells in complete GB medium. Nanoparticles were prepared as described above, using siRNA against eGFP instead of DNA. siRNA was diluted in sodium acetate (25 mM buffer, 10.8 μg/mL siRNA), then mixed with polymer in sodium acetate (1.08, 4.32 mg/mL or 100, 400 w/w polymer-to-siRNA ratios as indicated below to approximate the final polymer concentration used in DNA transfections). The final dose of particles added to each well in initial screening experiments was 60 nM siRNA (0.9 μg/mL). Cells were incubated with the particles for 4 hr before the media were replaced with fresh, complete GB medium. For each polymer tested, one group (n=4) was treated with siRNA against eGFP (siGFP) and another with scrambled siRNA (scrRNA) complexed with the same polymer as a paired control. Conditions were also tested in a serum-free medium transfection. Selected polymers were also tested by transfection with various concentrations (30 nM, 10 nM, or 5 nM final siRNA concentration) with a wider range of polymer-to-siRNA w/w.
After 24 hr, an MTS assay was used to assess cell viability as described previously. Each day, the fluorescence plate reader was used to measure the GFP signal. Knockdown was calculated by subtracting background from all wells and normalizing the signal from siGFP-treated cells to the signal from scrRNA-treated cells. After 5 days, high-throughput flow cytometry was used to measure the intensity of GFP fluorescence from each cell (FL1 detector).
5.11. Statistics
Unless otherwise stated, reported values are mean ± standard error of the mean. Statistical significance (p<0.05) between paired data sets were done using two-tailed Student’s t-tests with a Bonferroni correction for multiple comparisons. One-way ANOVA with post-hoc Dunnett’s tests were used to determine statistically significant differences (p<0.05) between multiple groups and a control. GraphPad Prism v5.0b and Matlab v.R2010b were used for statistical analysis.
Supplementary Material
Acknowledgments
Human GB 319 cells were isolated by and received from the lab of Alfredo Quiñones-Hinojosa. SYT thanks the National Science Foundation for fellowship support. This work was supported in part by the National Institutes of Health (R21CA152473). The authors thank the Microscopy and Imaging Core Module of the Wilmer Core Grant, EY001765. Supporting Information is available online from Wiley InterScience or from the author.
References
- 1.Ledley FD. Hum Gene Ther. 1995;6:1129. doi: 10.1089/hum.1995.6.9-1129. [DOI] [PubMed] [Google Scholar]
- 2.Merdan T, Kopecek J, Kissel T. Adv Drug Delivery Rev. 2002;54:715. doi: 10.1016/s0169-409x(02)00046-7. [DOI] [PubMed] [Google Scholar]
- 3.Putnam D. Nat Mater. 2006;5:439. doi: 10.1038/nmat1645. [DOI] [PubMed] [Google Scholar]
- 4.Sunshine JC, Bishop CJ, Green JJ. Therapeutic Delivery. 2011;2:493. doi: 10.4155/tde.11.14. [DOI] [PMC free article] [PubMed] [Google Scholar]
- 5.Verma IM. Mol Ther. 2000;2:415. doi: 10.1006/mthe.2000.0213. [DOI] [PubMed] [Google Scholar]; Cornetta K, Morgan RA, Anderson WF. Hum Gene Ther. 1991;2:5. doi: 10.1089/hum.1991.2.1-5. [DOI] [PubMed] [Google Scholar]; Check E. Nature. 2003;421:678. doi: 10.1038/421678b. [DOI] [PubMed] [Google Scholar]; Check E. Nature. 2005;433:561. doi: 10.1038/433561a. [DOI] [PubMed] [Google Scholar]
- 6.Park TG, Jeong JH, Kim SW. Adv Drug Deliv Rev. 2006;58:467. doi: 10.1016/j.addr.2006.03.007. [DOI] [PubMed] [Google Scholar]; Pack DW, Hoffman AS, Pun S, Stayton PS. Nat Rev Drug Discov. 2005;4:581. doi: 10.1038/nrd1775. [DOI] [PubMed] [Google Scholar]
- 7.Green JJ, Langer R, Anderson DG. Acc Chem Res. 2008;41:749. doi: 10.1021/ar7002336. [DOI] [PMC free article] [PubMed] [Google Scholar]
- 8.Green JJ, Shi J, Chiu E, Leshchiner ES, Langer R, Anderson DG. Bioconjug Chem. 2006;17:1162. doi: 10.1021/bc0600968. [DOI] [PubMed] [Google Scholar]
- 9.Tzeng SY, Guerrero-Cazares H, Martinez EE, Sunshine JC, Quinones-Hinojosa A, Green JJ. Biomaterials. 2011;32:5402. doi: 10.1016/j.biomaterials.2011.04.016. [DOI] [PMC free article] [PubMed] [Google Scholar]
- 10.Bhise NS, Gray RS, Sunshine JC, Htet S, Ewald AJ, Green JJ. Biomaterials. 2010;31:8088. doi: 10.1016/j.biomaterials.2010.07.023. [DOI] [PMC free article] [PubMed] [Google Scholar]; Sunshine JC, Akanda MI, Li D, Kozielski KL, Green JJ. Biomacromolecules. 2011 doi: 10.1021/bm200807s. [DOI] [PMC free article] [PubMed] [Google Scholar]
- 11.Tzeng SY, Yang PH, Grayson WL, Green JJ. International Journal of Nanomedicine. 2012;6:3309. doi: 10.2147/IJN.S27269. [DOI] [PMC free article] [PubMed] [Google Scholar]
- 12.Spagnou S, Miller AD, Keller M. Biochemistry. 2004;43:13348. doi: 10.1021/bi048950a. [DOI] [PubMed] [Google Scholar]; Adair JH, Parette MP, Altinoglu EI, Kester M. ACS Nano. 2010;4:4967. doi: 10.1021/nn102324e. [DOI] [PubMed] [Google Scholar]
- 13.Lee JS, Green JJ, Love KT, Sunshine J, Langer R, Anderson DG. Nano Lett. 2009;9:2402. doi: 10.1021/nl9009793. [DOI] [PMC free article] [PubMed] [Google Scholar]; Giljohann DA, Seferos DS, Prigodich AE, Patel PC, Mirkin CA. J Am Chem Soc. 2009;131:2072. doi: 10.1021/ja808719p. [DOI] [PMC free article] [PubMed] [Google Scholar]
- 14.Joyner AL, Herrup K, Auerbach BA, Davis CA, Rossant J. Science. 1991;251:12391243. doi: 10.1126/science.1672471. [DOI] [PubMed] [Google Scholar]
- 15.Green JJ. Ann Biomed Eng. 2012;40:1408. doi: 10.1007/s10439-012-0550-3. [DOI] [PMC free article] [PubMed] [Google Scholar]
- 16.Midoux P, Breuzard G, Gomez JP, Pichon C. Curr Gene Ther. 2008;8:335. doi: 10.2174/156652308786071014. [DOI] [PubMed] [Google Scholar]
- 17.Verrecchia T, Huve P, Bazile D, Veillard M, Spenlehauer G, Couvreur P. J Biomed Mater Res. 1993;27:1019. doi: 10.1002/jbm.820270807. [DOI] [PubMed] [Google Scholar]; Liu YM, Reineke TM. Bioconjug Chem. 2006;17:101. doi: 10.1021/bc050275+. [DOI] [PubMed] [Google Scholar]
- 18.Zhou J, Patel TR, Fu M, Bertram JP, Saltzman WM. Biomaterials. 2012;33:583. doi: 10.1016/j.biomaterials.2011.09.061. [DOI] [PMC free article] [PubMed] [Google Scholar]
- 19.Singh N, Agrawal A, Leung AK, Sharp PA, Bhatia SN. J Am Chem Soc. 2010;132:8241. doi: 10.1021/ja102132e. [DOI] [PMC free article] [PubMed] [Google Scholar]
- 20.Lu ZX, Liu LT, Qi XR. International Journal of Nanomedicine. 2011;6:1661. doi: 10.2147/IJN.S22293. [DOI] [PMC free article] [PubMed] [Google Scholar]
- 21.Holzerny P, Ajdini B, Heusermann W, Bruno K, Schuleit M, Meinel L, Keller M. J Control Release. 2012;157:297. doi: 10.1016/j.jconrel.2011.08.023. [DOI] [PubMed] [Google Scholar]
- 22.Bhatia P, Bernier M, Sanghvi M, Moaddel R, Schwarting R, Ramamoorthy A, Wainer IW. Xenobiotica. 2012 doi: 10.3109/00498254.2012.662726. [DOI] [PMC free article] [PubMed] [Google Scholar]
- 23.Kwon EJ, Bergen JM, Pun SH. Bioconjug Chem. 2008;19:920. doi: 10.1021/bc700448h. [DOI] [PubMed] [Google Scholar]
- 24.DeAngelis LM. N Engl J Med. 2001;344:114. doi: 10.1056/NEJM200101113440207. [DOI] [PubMed] [Google Scholar]
- 25.Bhise NS, Shmueli RB, Gonzalez J, Green JJ. Small. 2012;8:367. doi: 10.1002/smll.201101718. [DOI] [PMC free article] [PubMed] [Google Scholar]
- 26.Akinc A, Anderson DG, Lynn DM, Langer R. Bioconjug Chem. 2003;14:979. doi: 10.1021/bc034067y. [DOI] [PubMed] [Google Scholar]
- 27.Eltoukhy AA, Siegwart DJ, Alabi CA, Rajan JS, Langer R, Anderson DG. Biomaterials. 2012;33:3594. doi: 10.1016/j.biomaterials.2012.01.046. [DOI] [PMC free article] [PubMed] [Google Scholar]
- 28.Yu J, Hu K, Smuga-Otto K, Tian S, Stewart R, Slukvin, Thomson JA. Science. 2009;324:797. doi: 10.1126/science.1172482. [DOI] [PMC free article] [PubMed] [Google Scholar]
Associated Data
This section collects any data citations, data availability statements, or supplementary materials included in this article.