Abstract
Polymeric vectors for gene delivery are a promising alternative for clinical applications as they are generally safer than viral counterparts. Our objective was to further our mechanistic understanding of polymer structure-function relationships to allow rational design of new biomaterials. Utilizing poly(beta-amino ester)s (PBAE), we investigated polymer-DNA binding by systematically varying polymer molecular weight, adding single carbons to the backbone and sidechain of the monomers that compose the polymers, as well as varying the type of polymer endgroup. We then sought to correlate how PBAE binding affects polyplex diameter and zeta potential, transfection efficacy and its associated cytotoxicity in human breast and brain cancer in vitro. Amongst other trends, we observed in both cell lines the PBAE-DNA binding constant is biphasic with transfection efficacy and optimal values for transfection efficacy are in the range of 1-6×10⁴ M−1. A binding constant in this range is necessary but not sufficient for effective transfection.
Keywords: Binding Constant, Non-viral Gene Delivery, poly(beta-amino ester) (PBAE), Structure-function, Time-resolved Spectroscopy, Transfection
Introduction
Inheritable diseases and cancer can result from inactive genes (i.e., CFTR in cystic fibrosis or P53 as a tumor suppressor).1, 2 Delivering DNA and shRNA to encode and generate a functional copy or to inhibit mRNA expression of a non-functioning protein can potentially treat and cure many genetic diseases. Viruses have been used as delivery vectors as they are highly efficient in nucleic acid delivery, but they can cause insertional mutagenesis, immunogenic responses, and toxicity.3 The safety and efficacy of the viral vectors depend on the viral vector type, route of administration and therapeutic target. To date there have been only two gene therapy formulations approved; one by the SFDA in China (2003) and one in Europe (2012) by the European Medicines Agency; there are still no FDA-approved gene therapies.4 Degradable cationic polymers are an attractive alternative to viruses, as they are generally safer, are easier to manufacture and mass produce, and have more functional capabilities than viruses.5 Varying a polymer’s structure and functional groups allows one to optimize nucleic acid delivery properties while minimizing toxicity levels.6 High-throughput analyses of combinatorial biomaterial libraries can allow a vast number of polymers to be screened, but rational design of structure to control function would be more efficient.7, 8
We are interested in evaluating polymer structure-function relationships to further our mechanistic understanding of, and to improve polymeric materials for non-viral gene delivery (Scheme 1). We have previously investigated poly(beta-amino esters) (PBAEs) as biodegradable cationic polymers capable of promoting gene delivery to various types of cells.9-11 These polymers are promising due to their ability to condense DNA into nanoparticles containing many plasmids per particle,12 facilitate cellular uptake,13 and mediate endosomal escape.14, 15 Certain PBAE nanoparticles have been shown effective for in vivo gene delivery in the eye16 and to tumors.17 Despite this progress, gene delivery efficiency using polymers remains lower than with viral delivery. One challenge in evaluating and optimizing polymer structure is that synthetic polymers can be polydisperse, with variable extents of reaction and molecular weight heterogeneity.18-20 Isolating precise polymer structures and uniform molecular weight are key to being able to evaluate polymer structure.
Scheme 1.
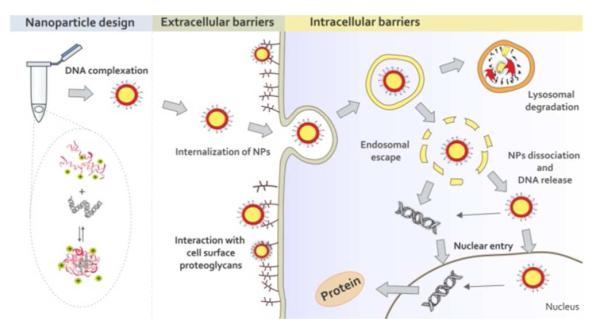
Nanoparticle formulation, extracellular and intracellular barriers for successful gene delivery.
The interactions between a cationic polymer and DNA are critical to facilitate DNA protection, nanoparticle formation, cellular uptake, and subsequent DNA release.21, 22 Anionic phosphate groups on the DNA associate with and bind to positively charged amine groups on cationic polymers to cause nucleic acid condensation and protection. This is important because the degradation half-life of naked DNA in the presence of serum is on the order of minutes.23 Upon binding with a cationic carrier (i.e., polymer), the nucleic acid half-life can increase substantially.24, 25 An optimal DNA carrier system should bind, condense, and protect DNA in the extracellular space, but release DNA effectively within the cells. Designing such systems require proper understanding of the binding between DNA and polycations.26, 27
In this manuscript, we use time-resolved fluorescence spectroscopy,28, 29 a new approach to quantitatively probe polymer-DNA interactions and binding. We report our findings of systematically investigating binding properties of DNA and monodisperse, size-fractionated poly(beta-amino ester)s with differential structures. In particular, we investigated series of polymers which varied the following: molecular weight; the number of carbons in the backbone which varied the amine density and hydrophobicity; the number of carbons in the sidechain which varied the distance of a hydroxyl group from the backbone and its hydrophobicity; and the endcap type (primary, secondary, tertiary amines and no endcap or diacrylate terminated). The effects of these small changes in the polymeric structures were characterized by fluorescence spectroscopy and gene delivery efficacy in human brain cancer and human breast cancer cells in vitro.30
The experimental procedures, including materials and methods, can be found in the Supporting Information.
Results and Discussion
Polymer Synthesis and Fractionation
The 447 polymer series varying molecular weight ranged from 10.3 to 91.6 kDa (weight average molecular weight (Mw)). The polydispersity indices (PDI) increased as the Mw increased (PDIs: 1.3, 1.4, 2.9). The average Mw of the groups varying the backbone, sidechain and endcaps were 10 ± 1 kDa, 13 ± 2 kDa, and 10.9 ± 0.7 kDa, respectively. The PDIs of the groups varying backbone, sidechain and endcaps were 1.3 ± 0.1, 1.3 ± 0.1, and 1.34 ± 0.09, respectively (Table S1). The molecular weight of the polymers was detected by gel permeation chromatography (GPC) (Figure 1). Molecular weight varied considerably for the 447 molecular weight series and was similar for the other polymers. The similarity of the Mw and narrow PDIs of the comparable polymers with small differences in the backbone, sidechain and endcap allow comparisons between the groups and ensure differences are due to the monomer type as opposed to Mw or size heterogeneity.
Figure 1.
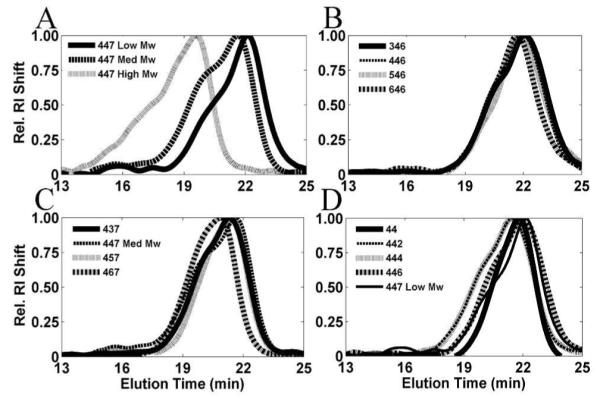
GPC curves of fractionated polymers by group (relative RI shift (mV/max mV) versus elution time (min.); varying molecular weight (Low, Med, and High) (A), backbone (B), sidechain (C), and endcaps (D).
Representative 1H NMR spectra of polymers 44, 442, 444, 446 and 447 can be found in Figure S1.6
Binding Constants for Polyplex Formation
The polyplex formation can be monitored by plotting the proportion of bound DNA, B in equation 5, against the concentration of amine. As an example the plot for polymer 442 is shown in Figure 2. The proportion of bound DNA increases with increasing polymer concentration until it reaches a saturation limit of approximately 76 % at w/w ratios of 24 in this case. Most PBAEs polymers saturated close to 80%. The saturation limit of polymer 44 and 346 is 60 and 96%, respectively. Polymers with negative cooperativity typically have saturation less than 100%, whereas polymers with high positive cooperativity saturate near 100%.
Figure 2.
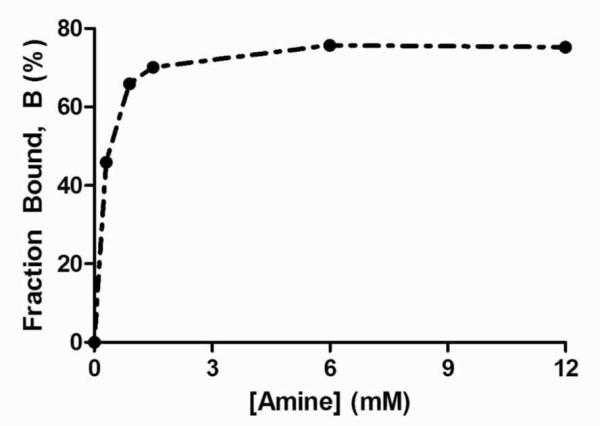
Fraction of bound DNA as a function of amine concentration of polymer 442.
The Hill plots for the 447 molecular weight series are shown in Figure 3A. Similar linear curves with negative cooperativity (Table S1) were obtained for most of the polymers except polymer 646 (Figure 3B-D). The fact that most polymers’ Hill plots entail negative cooperativity and most polymers’ bound fraction saturate close to 80% are in agreement.
Figure 3.
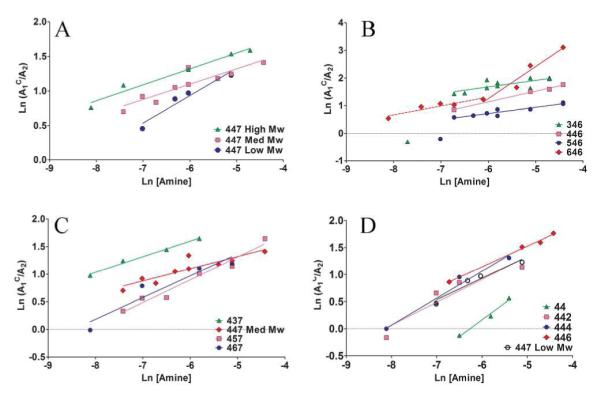
Hill plots of polymer series varying Mw (A), backbone (B), sidechain (C), and endcaps (D).
While most polymers show a single linear Hill plot, varying the polymer backbone structure (646) may enable a biphasic response (Figure 3B). Polymer 646’s Hill plot is associated with a negative and a positive cooperativity phase, which may account for why polymer 646 saturates at 96%.
This biphasic nature of binding suggests a change in the binding mechanism with increasing the molar amine to phosphate ratio. The analysis and discussion of polymer 646 will focus on the positive cooperativity slope associated with the higher amine to phosphate ratios, as all other experiments (i.e., transfection, toxicity, diameters, etc.) were carried out at weight/weights of 30, 60 or 90 (N/P ratios greater than 35). Polymers 346 and 546 (Figure 3B) have a data point which may either be an outlier or may also be associated with a binding mechanism which is biphasic, similar to polymer 646. Too few data points in these regions where there may be positive cooperativity for polymers 346 and 546 restrict further analysis. The multi-phase cooperativity is an interesting aspect for future investigation.
As the molecular weight of 447 increased, the binding constant per amine (K) increased (Figure 4A). Thus, larger polymer molecular weight led to increased polymer-DNA interaction and stronger binding. By utilizing this trend, one could potentially fractionate a polymer with a particular molecular weight corresponding to a desired binding constant.
Figure 4.
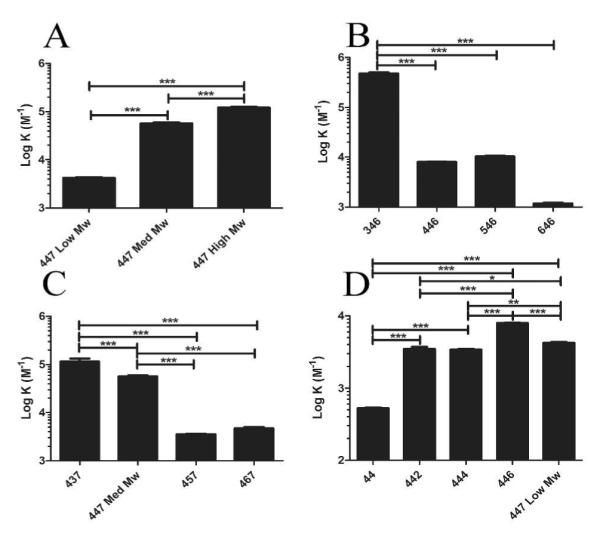
Binding constants (M−1) of each of the series comparing Mw (A), backbone (B), sidechain (C), and endcaps (D). (Statistical analysis was accomplished by a one-way ANOVA and a Tukey post-hoc analysis; *=P-value < 0.05; **=P-value < 0.01; ***=P-value < 0.001).
When evaluating the number of carbons that make up the polymer backbone repeat (3, 4, 5, or 6), the binding constants decreased as the number of carbons in the backbone monomer increased (Figure 4B). The binding affinity reduced 400-fold when the number of carbons in the backbone increased from 3 to 6. The decrease in the binding constant is likely due to the decrease in amine density as the number of carbons in the backbone increases.
The binding constants in the sidechain series (437, 447 Med Mw, 457, 467) decreased with increasing side chain length (Figure 4C). As the sidechain was altered from 3 to 6 carbons, the binding affinity reduced 24-fold. Again, the decrease in the binding constant is likely due to the decrease in amine density as the number of carbons in the sidechain increases.
The base polymer (polymer 44) had a lower binding constant than any of the endcapped polymers (442, 444, 446, and 447 Low Mw). The binding constant increased 6.6 ± 0.1, 15.2, and 8.0-fold when the base polymer was endcapped using primary (442 and 444), secondary (446), and tertiary amines (447 Low Mw), respectively (Figure 4D). Considering the pKa values of primary, secondary, and tertiary amines, one would suspect that there would be greater binding between primary versus tertiary; however, these differences would be diminished as the buffer was at a pH of 5.2. We observed a larger than expected value for the 446 K. This higher K value is understandable when the molecular weight of the 446 polymer is considered; the molecular weight of the 446 polymer was 14% higher than the other molecular weights of the endcap polymer series (Table S1) which had 3-5 more amines per polymer strand than the other polymers in the group (un-endcapped, primary, secondary, and tertiary amine-type polymers had 40, 39, 44 and 41 amines per polymer strand, respectively.
Comparison of Binding Constant Calculation Methodology
The binding constant of a cationic peptide (KK)2KGGC was also evaluated to compare our time-resolved fluorescence spectroscopy binding assay to other binding assays found in the literature. The proportion of bound DNA, B in equation 5, as a function of (KK)2KGGC concentration displayed a saturation level close to 90 %. The Hill plot of the peptide presented in Figure S3 shows the presence of two phases, similar to polymer 646. The kink point corresponds to the w/w ratio 3.6. The peptide, perhaps due to the presence of positive cooperativity (at low w/w) was associated with a higher saturation than most of the PBAEs, similar to what was observed with polymer 646. The Hill coefficient of the positive and negative cooperativity phases were 2.2 and 0.50, respectively, suggesting that further binding is hindered by the already bound amines. The overall binding constant, Kα, obtained from the positive cooperativity phase is 1.2 ± 0.2×10⁷ M−1. Plank et al. obtained a value of 2.09×10⁶ M−1 with this peptide which is ~6 times smaller than by our method.21
The Relationship Between Polyplex Diameter and Binding
The diameter of the polyplexes (nanoparticles) formed due to the binding and self assembly of cationic polymer with anionic DNA ranged from a mean diameter of 122 to 227 nm (Figure S4 and S5). While a polymer with one of the lowest binding constants (646, 1.19 × 10³ M−1) formed polyplexes of the largest size (227 nm) and the polymer with the largest binding constant (346, 4.8 × 10⁵ M−1) formed polyplexes of the smallest size (122 nm), there was not an overall trend between PBAE-DNA binding affinity and polyplex size (Figure S4). For the case of polymer backbone length, there was an apparent decrease in the diameter as the binding constant increased (or as the backbone length decreased (Figure S4B). As the backbone length increases the amine density decreases and hydrophobicity increases as well.
While an increased binding constant appears to correlate with smaller polyplex diameter, the trend is not very strong as a range of polymer binding constants and polymer structures can produce polyplexes of similar size (Figure S5A). Our data suggests that tighter binding constants may, but do not necessarily result in smaller polymer/DNA polyplexes. The number of plasmids per polyplex, the number of polymer chains per polyplex, and the association of individual polyplexes with each other in ion containing buffer solutions can all affect polyplex size.
Polyplex/particle diameter does not appear to show any clear trends in transfection efficacies in either cell line (Figure S5B and S5C). This finding suggests that the diameter of the polymer/DNA polyplexes is not a key determining factor for this class of PBAE particles in these cell lines. As all nanoparticles studied were relatively small in diameter they should be able to mediate successful endocytic cellular uptake.
Polyplexes were successfully formed at both pHs (5.2 and 7.4) and various ionic strengths (Figure S6). At these conditions, the diameters of the polyplexes ranged from approximately 100 to 300 nm and no significant aggregation was observed (Figure S6).
The Relationship Between Polyplex Zeta Potential and Binding
The polyplexes’ zeta potentials (ZP) (Figure S7 and S8) ranged from +5 to +18 mV. There were no apparent trends between the binding constants and ZP (Figure S7 and S8A). In contrast to our cationic ZPs, Eltoukhy et al. found their PBAEs were neutral in sodium acetate, likely explained by the use of different polymer structures as well as 20-40 w/w formulations, which use less polymer than what was tested in our experiments (60 w/w).18 Our nanoparticles are weakly positively charged, allowing interaction with a cell’s anionic surface. Their charge is not excessive and they do not cause high toxicity when added to cells. When comparing all ZP measurements against transfection efficacies, there are no clear trends in either cell line (Figure S8B and S8C).
These findings suggests that ZP of the polymer/DNA particles is not a key determining factor for transfection for this class of PBAE particles in these cell lines. As all nanoparticles studied were relatively weakly positive in ZP, they should be able to mediate successful cellular uptake.
The ZP of the polyplexes at both pHs (5.2 and 7.4) and in various ionic strengths ranged from approximately +6 to +25 mV (Figure S9). The ZP appeared to be inversely proportional to pH. At a pH of 5.2, the ZP decreased as the salt content increased. At a pH of 7.4, the ZP did not appear to increase in all cases as the salt content decreased (Figure S9). The ZPs of the 1:100 diluted condition was comparable to the undiluted.
Effect of Binding Constant on Transfection Efficacy
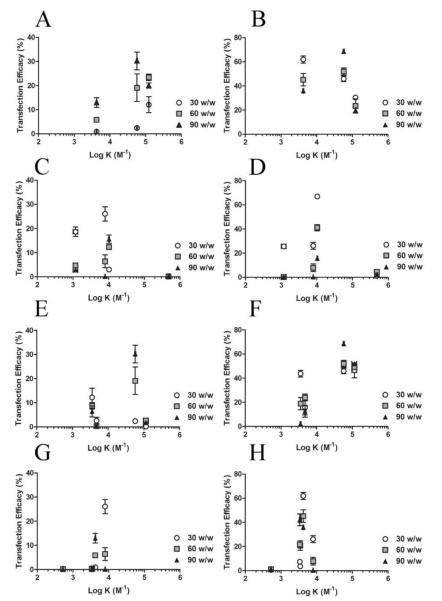
Two human cancer cell lines (MDA-MB-231 and GBM319) were utilized in these experiments to evaluate transfection efficacy. The former is derived from invasive triple negative human breast cancer and the latter is from human glioblastoma multiforme. Generally speaking, we have found both cell lines to be difficult to transfect, with MDA-MB-231 (Figure 5A, 5C, 5E, 5G) being more difficult to transfect than GBM319 (Figure 5B, 5D, 5F, 5H). The relative amount of EGFP per cell according to the normalized mean fluorescence linearly correlated with the transfection efficacy as measured by percent of cells with EGFP (Figure S10).
Figure 5.
The effect of binding constant on transfection efficacy in MDA-MB-231 cells (A, C, E, G) and GBM319 cells (B, D, F, H) for each of the series comparing Mw (A and B), backbone (C and D), sidechain (E and F), and endcaps (G and H).
The optimal molecular weight of the 447 polymer that resulted in the highest transfection efficacy was polymer 447 Med Mw at 90 w/w in both cell lines (Figure 5A and 5B). By flow cytometry the 447 Med Mw polymer achieved 30 ± 4% and 69 ± 1% transfection in the MDAMB-231 cell line and the GBM319 cell line, respectively. In MDA-MB-231 cells, the PBAE nanoparticle formulation with the highest transfection efficacy achieved 74% of the transfection percentage achieved with Lipofectamine 2000, a highly effective positive control widely used in the non-viral gene delivery community; positive and negative controls can be found in Figure S11. In GBM319 cells, the leading PBAE nanoparticles transfected 240% of the amount achieved with Lipofectamine 2000. Naked DNA, which is the same dose of plasmid DNA without added polymer, resulted in no transfection in both cell lines.
When all binding constants are analyzed with transfection efficacy, it is apparent that a biphasic trend is observed where the peak transfection occurs at an intermediate binding affinity (Figure S12A and S12B). However, the correlation is not straightforward, as similar binding affinities can also lead to dramatically lower transfection. This is to be expected as binding constants alone are likely insufficient to predict whether a particular polymer will deliver DNA successfully as there are many factors affecting gene delivery such as cellular uptake, endosomal escape, DNA release and nuclear import (Scheme 1).5
I. Effect of Mw
In the MDA-MB-231 cells, a comparison of 447 polymers with incremental molecular weight (Figure 5A) revealed a biphasic response, with the highest transfection efficacy at intermediate polymer molecular weight (447 Med Mw) and intermediate binding affinity (58,000 M−1). For the 30 w/w group, there was an increase in transfection efficacy as the molecular weight increased in the MDA-MB-231 cell line (Figure 5A) whereas there was a decrease in the GMB319 cell line (Figure 5B). 447 Med Mw with a binding constant of 58,000 M−1 was the most effective binding constant evaluated in terms of transfection efficacy in the GBM319 cells (Figure 5B). This suggests that there is an optimal range: too low of a binding constant is unfavorable and too high of a binding constant is also unfavorable. Low binding constant polymers may not be able to sufficiently condense and protect the DNA and excessively high binding constants are likely to not release the DNA as efficiently.22 As the molecular weight increased from 10.3 to 91.6 kDa, the transfection efficacy decreased from approximately 60% to 30% positive cells in the GBM319 cells.
II. Effect of Single Carbon Differences
When holding molecular weight approximately constant and varying the backbone and sidechain, the optimal binding constant was near 58,000 M−1 (polymer 447 Med Mw) for MDA-MB-231 cells (Figure 5C and 5E) and transfection was similarly high (~70%) for GBM319 cells in the range of 1-6×10⁴ M−1 (Figures 5D and 5F). In the case where the binding constant is smaller than 104 M−1, increasing the binding constant correlates with increased transfection efficacy for MDA-MB-231 cells. GBM319 cells are better transfected by polymers with weaker binding constants (103-104 M−1) than the MDA-MB-231 cells are and this is likely due to intrinsic differences in the gene delivery transport steps (Scheme 1) between these two cell types. For both cell types, when binding constant increased further (>105 M−1), even with molecular weight constant, transfection decreased.
Although it is common practice to use 10% FBS for in vitro transfection experiments, higher media serum content may be more physiologically relevant. 70% serum was used to assess transfection efficacy and its correlation with the observed binding constants in the GBM319 cell line. The highest transfection achieved in the presence of high serum was similar to the highest transfection observed with low serum, approximately 70% of human cells positively transfected. A similar biphasic trend was also observed as in the 10% serum conditions (Figure S13) and a similar optimal range of binding constants, ~104 M−1, was able to result in the highest transfection efficacy.
III. Effect of Endcaps
The MDA-MB-231 and GBM319 cell lines had very low transfection for un-endcapped, acrylate terminated (polymer 44) polymers. Furthermore, primary amine polymers (polymer 442 and 444) were not able to effectively transfect MDA-MB-231 cells; whereas primary, secondary and tertiary amines were able to transfect the GB319 cells.
Secondary or tertiary amine endcapped groups, depending on the w/w ratio, were required in the MDAMB-231 cell line for effective transfection with these polymers. The GBM319 cell line could be successfully transfected via primary amine-endcapped PBAE polymers 442 and 444 in addition to the polymers endcapped with secondary or tertiary amines. There did not appear to be a strong trend however with the binding constant and transfection efficacy in the endcapped series (Figures 5G and 5H).
Effect of Binding Constant on Cytotoxicity
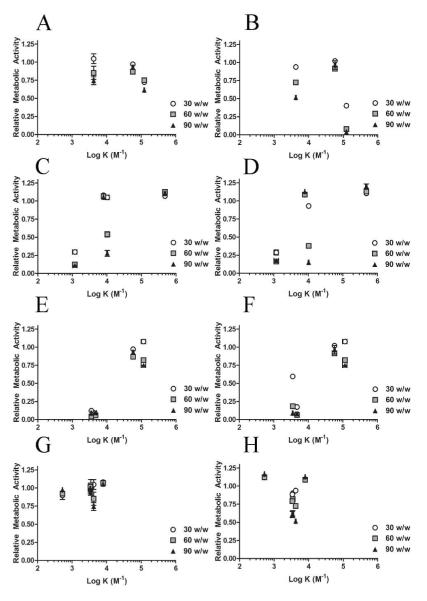
In general, cytotoxicity increased with increasing polymer to DNA w/w ratio (Figure 6). In both cell lines tested it appeared there was low cytotoxicity with polymers that had binding constants in the 104-105 M−1 range (Figures S11C and S11D).
Figure 6.
The effect of binding constant on relative metabolic activity in MDA-MB-231 cells (A, C, E, G) and GBM319 cells (B, D, F, H) for each of the series comparing Mw (A and B), backbone (C and D), sidechain (E and F), and endcaps (G and H).
I. Effect of Mw
Particle-induced cytotoxicity increased as the binding constant (and the Mw) increased in both cell lines (Figures 6A and 6B). There was relatively less toxicity in the MDA-MB-231 cell line compared to the GB319 cell line, especially for the 447 High Mw polymer.
II. Effect of Single Carbon Differences
The cytotoxicity increased as the number of carbons in the backbone or sidechain increased in both cell lines. Thus, cytotoxicity decreased (and the relative metabolic activity increased) as the binding constant increased (Figures 6C-6F).
III. Effect of Endcaps
There was not significant cytotoxicity in the MDA-MB-231 cell line in the 44, 442, 444, 446 and 447 Low endcap series, whereas there appeared to be some cytotoxicity in the GBM319 cell line with the primary and tertiary amine endcaps. Secondary amine endcaps may be particularly less cytotoxic in the GBM319 cell line (Figures 6G and 6H). There was not a clear trend in the relative metabolic activity when varying the type of endcap.
Heparin Competition Release
The 44 polymer associated with the weakest binding constant (526 M−1) released its DNA with the lowest amount of heparin (<2 μg/mL) (Figure S14). 447 Low Mw was associated with a binding constant of 4.2×10³ M−1 and released its DNA at a heparin concentration between 16 to 64 μg/mL (Figure S14). The 446 and 447 High Mw polymers were associated with 7.97×10³ and 1.23×10⁵ M−1, respectively and both released their DNA between 128 and 256 μg/mL. The 446 polymer has a faint supercoiled DNA band at 128 μg/mL, suggesting 446 polymer likely releases its DNA at a lower heparin concentration than does 447 High Mw (Figure S14). The DNA release from the polyplexes appears inversely proportional to the binding affinity between DNA and the polymers.
Conclusions
Evaluation of polymer-DNA binding constants using TCSPC compared to transfection efficacy allowed us to observe that binding constants between 1-6×10⁴ M−1 were optimal for both human cancer cell lines tested. Our data reveals that polymer-DNA binding affinity for PBAEs is biphasic with transfection efficacy, with an intermediate binding affinity being optimal. A binding constant in the optimal range is necessary but not sufficient for effective transfection. This intermediate binding affinity can be independently tuned by adding single carbons to the backbone or side-chain structure, varying monomer ratios during synthesis and/or using GPC fractionation to tune the polymer molecular weight, and by modifying a small molecule endgroup used to endcap a linear polymer. By probing a specific gene delivery bottleneck with a class of polymers that were synthesized to have subtle structural differences, new quantitative and mechanistic insights were obtained concerning how they function for gene delivery.
Supplementary Material
ACKNOWLEDGMENT
We would like to acknowledge Martina Hanzlikova for Scheme I.
Funding Sources NSF GRF and Nordic Research Opportunity grant: DGE-0707427 to CJB. This work was supported in part by the National Institutes of Health (R01EB016721-01 and R21CA152473), Tekes PrinCell II 40050/09 Finland, and Academy of Finland. The authors thank the Microscopy and Imaging Core Module of the Wilmer Core Grant, EY001765
ABBREVIATIONS
- DMSO
dimethyl sulfoxide
- DP
degree of polymerization
- ETB
ethidium bromide
- FBS
fetal bovine serum
- GBM
glioblastoma multiforme
- GPC
gel permeation chromatography
- K
cooperative binding constant per amine
- Kα
overall cooperative binding constant
- Mw
weight average molecular weight
- NaAc
sodium acetate
- NMR
nuclear magnetic resonance
- N/P
amine to phosphate mole ratio
- NTA
nanoparticle tracking analysis
- PBAE
poly(beta-amino ester)
- PBS
phosphate buffered saline
- PDI
polydispersity index
- pDNA
plasmid DNA
- PI
propidium iodide
- TCSPC
time-correlated single photon counting
- THF
tetrahydrofuran
- ZP
zeta potential
Footnotes
Supporting information includes the following figures: S1: 1H NMR spectra of polymers 44, 442, 444, 446, and 447 polymers; S2: Decay-associated spectra; Table S1: lists of Mn, Mw, PDI, DP, Hill Coefficient, K, diameter, ZP; S3: Peptide Hill plot; S4: Diameter versus binding constants for each polymer series; S5: All diameters versus binding constants (A); All diameters versus TE of MDA-MB-231 (B) and GBM319 cells (C); S6: Polyplex diameters at various pHs and ionic strengths; S7: ZP versus binding constants for each polymer series; S8: All ZPs versus binding constants (A); All ZPs versus TE in MDA-MB-231 (B) and GBM319 cells (C); S9: Polyplex ZP at various pHs and ionic strengths; S10: Correlations between geometric and arithmetic mean fluorescences (FL1-A) versus percent positive transfection efficacies in both cell lines; S11: Positive and negative controls for transfection and relative metabolic activity; S12: All binding constants versus transfection efficacy (in both cell lines) and relative metabolic activity (in both cell lines); S13: Binding constants versus transfection efficacy in 70% serum in the GBM319 cell line; S14: Heparin sulfate release competition assay via gel electrophoresis.
(This material is available free of charge via the Internet at http://pubs.acs.org.)
Author Contributions The manuscript was written through contributions of all authors. All authors have given approval to the final version of the manuscript.
Notes The authors declare no competing financial interests.
REFERENCES
- 1.Nielsen LL, Maneval DC. Cancer Gene Ther. 1998;5:52. [PubMed] [Google Scholar]
- 2.Ziady AG, Kelley TJ, Milliken E, Ferkol T, Davis PB. Mol. Ther. 2002;5:413. doi: 10.1006/mthe.2002.0556. [DOI] [PubMed] [Google Scholar]
- 3.Thomas M, Klibanov AM. Appl. Microbiol. Biotechnol. 2003;62:27. doi: 10.1007/s00253-003-1321-8. [DOI] [PubMed] [Google Scholar]
- 4.Pearson S, Jia HP, Kandachi K. Nat. Biotechnol. 2004;22:3. doi: 10.1038/nbt0104-3. [DOI] [PMC free article] [PubMed] [Google Scholar]
- 5.Sunshine JC, Bishop CJ, Green JJ. Ther. Deliv. 2011;2:493. doi: 10.4155/tde.11.14. [DOI] [PMC free article] [PubMed] [Google Scholar]
- 6.Sunshine JC, Akanda MI, Li D, Kozielski KL, Green JJ. Biomacromolecules. 2011;12:3592. doi: 10.1021/bm200807s. [DOI] [PMC free article] [PubMed] [Google Scholar]
- 7.Green JJ. Ann. Biomed. Eng. 2012;40:1408. doi: 10.1007/s10439-012-0550-3. [DOI] [PMC free article] [PubMed] [Google Scholar]
- 8.Green JJ, Langer R, Anderson DG. Acc. Chem. Res. 2008;41:749. doi: 10.1021/ar7002336. [DOI] [PMC free article] [PubMed] [Google Scholar]
- 9.Shmueli RB, Sunshine JC, Xu ZH, Duh EJ, Green JJ. Nanomed.-Nanotechnol. 2012;8:1200. doi: 10.1016/j.nano.2012.01.006. [DOI] [PMC free article] [PubMed] [Google Scholar]
- 10.Sunshine J, Green JJ, Mahon KP, Yang F, Eltoukhy AA, Nguyen DN, Langer R, Anderson DG. Adv. Mater. 2009;21:4947. doi: 10.1002/adma.200901718. [DOI] [PMC free article] [PubMed] [Google Scholar]
- 11.Tzeng SY, Guerrero-Cazares H, Martinez EE, Sunshine JC, Quinones-Hinojosa A, Green JJ. Biomaterials. 2011;32:5402. doi: 10.1016/j.biomaterials.2011.04.016. [DOI] [PMC free article] [PubMed] [Google Scholar]
- 12.Bhise NS, Shmueli RB, Gonzalez J, Green JJ. Small. 2012;8 doi: 10.1002/smll.201101718. [DOI] [PMC free article] [PubMed] [Google Scholar]
- 13.Akinc A, Lynn DM, Anderson DG, Langer R. J. Am. Chem. Soc. 2003;125:5316. doi: 10.1021/ja034429c. [DOI] [PubMed] [Google Scholar]
- 14.Akinc A, Langer R. Biotechnol. Bioeng. 2002;78:503. doi: 10.1002/bit.20215. [DOI] [PubMed] [Google Scholar]
- 15.Sunshine JC, Peng DY, Green JJ. Mol. Pharm. 2012;9:3375. doi: 10.1021/mp3004176. [DOI] [PMC free article] [PubMed] [Google Scholar]
- 16.Sunshine JC, Sunshine SB, Bhutto I, Handa JT, Green JJ. PloS one. 2012;7 doi: 10.1371/journal.pone.0037543. [DOI] [PMC free article] [PubMed] [Google Scholar]
- 17.Huang YH, Zugates GT, Peng W, Holtz D, Dunton C, Green JJ, Hossain N, Cher-nick MR, Padera RF, Jr., Langer R, Anderson DG, Sawicki JA. Cancer Res. 2009;69:6184. doi: 10.1158/0008-5472.CAN-09-0061. [DOI] [PMC free article] [PubMed] [Google Scholar]
- 18.Eltoukhy AA, Siegwart DJ, Alabi CA, Rajan JS, Langer R, Anderson DG. Biomaterials. 2012;33:3594. doi: 10.1016/j.biomaterials.2012.01.046. [DOI] [PMC free article] [PubMed] [Google Scholar]
- 19.Wang J, Gao SJ, Zhang PC, Wang S, Mao MQ, Leong KW. Gene Ther. 2004;11:1001. doi: 10.1038/sj.gt.3302248. [DOI] [PubMed] [Google Scholar]
- 20.Zelikin AN, Trukhanova ES, Putnam D, Izumrudov VA, Litmanovich AA. J. Am. Chem. Soc. 2003;125:13693. doi: 10.1021/ja036387y. [DOI] [PubMed] [Google Scholar]
- 21.Plank C, Tang MX, Wolfe AR, Szoka FC., Jr. Hum. Gene Ther. 1999;10:319. doi: 10.1089/10430349950019101. [DOI] [PubMed] [Google Scholar]
- 22.Schaffer DV, Fidelman NA, Dan N, Lauffenburger DA. Biotechnol. Bioeng. 2000;67:598. doi: 10.1002/(sici)1097-0290(20000305)67:5<598::aid-bit10>3.0.co;2-g. [DOI] [PubMed] [Google Scholar]
- 23.Leong KW, Mao HQ, Truong-Le VL, Roy K, Walsh SM, August JT. J. Control. Release. 1998;53:183. doi: 10.1016/s0168-3659(97)00252-6. [DOI] [PubMed] [Google Scholar]
- 24.Tam P, Monck M, Lee D, Ludkovski O, Leng EC, Clow K, Stark H, Scherrer P, Graham RW, Cullis PR. Gene Ther. 2000;7:1867. doi: 10.1038/sj.gt.3301308. [DOI] [PubMed] [Google Scholar]
- 25.Yu RZ, Geary RS, Leeds JM, Watanabe T, Fitchett JR, Matson JE, Mehta R, Hardee GR, Templin MV, Huang K, Newman MS, Quinn Y, Uster P, Zhu G, Working PK, Horner M, Nelson J, Levin AA. Pharm. Res. 1999;16:1309. doi: 10.1023/a:1014822219133. [DOI] [PubMed] [Google Scholar]
- 26.Green JJ, Zugates GT, Tedford NC, Huang YH, Griffith LG, Lauffenburger DA, Sawicki JA, Langer R, Anderson DG. Adv. Mater. 2007;19:2836. [Google Scholar]
- 27.van der Aa MAEM, Huth US, Hafele SY, Schubert R, Oosting RS, Mastrobattista E, Hennink WE, Peschka-Suss R, Koning GA, Crommelin DJA. Pharm. Res. 2007;24:1590. doi: 10.1007/s11095-007-9287-3. [DOI] [PMC free article] [PubMed] [Google Scholar]
- 28.Ketola TM, Hanzlikova M, Urtti A, Lemmetyinen H, Yliperttula M, Vuorimaa E. J. Phys. Chem. B. 2011;115:1895. doi: 10.1021/jp109984c. [DOI] [PubMed] [Google Scholar]
- 29.Vuorimaa E, Ketola TM, Green JJ, Hanzlikova M, Lemmetyinen H, Langer R, Anderson DG, Urtti A, Yliperttula M. J. Control. Release. 2011;154:171. doi: 10.1016/j.jconrel.2011.06.016. [DOI] [PMC free article] [PubMed] [Google Scholar]
- 30.Vuorimaa E, Urtti A, Seppanen R, Lemmetyinen H, Yliperttula M. J. Am. Chem. Soc. 2008;130:11695. doi: 10.1021/ja801503h. [DOI] [PubMed] [Google Scholar]
Associated Data
This section collects any data citations, data availability statements, or supplementary materials included in this article.


