

Abstract
An ion exclusion chromatography (IELC) comparison between a conventional ion exchange column and an ultra-high performance liquid chromatography (UHPLC) dynamically surfactant modified C18 column for the separation of an aliphatic carboxylic acid and two aromatic carboxylic acids is presented. Professional software is used to optimize the conventional IELC separation conditions for acetylsalicylic acid and the hydrolysis products: salicylic acid and acetic acid. Four different variables are simultaneously optimized including H2SO4 concentration, pH, flow rate, and sample injection volume. Thirty different runs are suggested by the software. The resolutions and the time of each run are calculated and feed back to the software to predict the optimum conditions. Derringer’s desirability functions are used to evaluate the test conditions and those with the highest desirability value are utilized to separate acetylsalicylic acid, salicylic acid, and acetic acid. These conditions include using a 0.35 mM H2SO4 (pH 3.93) eluent at a flow rate of 1 mL min-1 and an injection volume of 72 μL. To decrease the run time and improve the performance, a UHPLC C18 column is used after dynamic modification with sodium dodecyl sulfate. Using pure water as a mobile phase, a shorter analysis time and better resolution are achieved. In addition, the elution order is different from the IELC method which indicates the contribution of the reversed-phase mode to the separation mechanism.
Keywords: Ion exclusion chromatography, Ultrahigh performance liquid chromatography, Surfactant modified stationary phase, Carboxylic acids, Acetylsalicylic acid
Introduction
Ion exclusion chromatography (IELC) was first introduced for the separation of different organic acids well before the advent of HPLC [1]. Simple aliphatic carboxylic acids (e.g., formate, acetate, propionate, and butyrate) can easily be separated by IELC using mineral acids as eluents [2, 3]. The separation of aromatic acids is more difficult due to peak tailing and long retention time caused by the π-π interaction of these analytes with the aromatic rings of the polymeric stationary phase [4, 5]. To avoid this interaction between the aromatic solutes and hydrophobic stationary phase, hydrophilic silica-based columns [6] were used. Ohta et al. [7] tried various hydrophilic cation exchange resins for different aliphatic and aromatic carboxylic acids and they found that silica-based cation-exchange resins were the most suitable IELC stationary phases for the separation of aromatic carboxylic acids, while polymethacrylate-based cation-exchange resins were more suitable for the separation of aliphatic carboxylic acids. Vacancy ion exclusion chromatography was also utilized for the separation of aromatic acids in which the sample is used as a mobile phase and water is to be injected in the cation exchange column [8]. Both strong [9] and weak [10-13] cation exchange resins were employed and the technique was also applicable for haloacids [11], inorganic acids [13], aliphatic acids [14], and aliphatic amines [15]. However, the long equilibration time between runs compromises using these methods in routine analysis [5].
The separation of aliphatic acids mixed with aromatic acids has been rarely studied by IELC [16] because the retention characteristics are so different. We have chosen the separation of acetylsalicylic acid and its hydrolysis products (acetic acid and salicylic acid) as a suitable example for optimization. Generally, only the aromatic acids are separated and acetic acid is not considered in such aspirin stability studies. Separation of acetylsalicylic acid from salicylic acid has been achieved by IELC using cyclodextrin as a mobile phase modifier for an ethanol-water mobile phase [17]. Without cyclodextrin, the separation time for acetylsalicyclic acid and salicyclic acid is long, about 50-60 min; the addition of cyclodextrin did decrease the analysis time by about half although baseline resolution was sacrified [17].
Different separation methods other than IELC have been employed to study the stability of acetylsalicylic acid. These methods include GC [18], reversed phase LC [19, 20], LC/MS [21], CE [22], microdialysis [23] and voltammetry [24]. These reversed phase LC methods used conventional C18 columns with acidic (pH 2.5) mobile phases to keep the aromatic carboxylic acids neutral in charge. Analysis times were 15-20 min and no attempt was made to determine acetic acid. However, IELC has several advantages including that the eluent is usually an aqueous acid with little or no organic modifiers which offers environmental and economic benefits and makes it compatible with aqueous matrices and a wide range of detection methods. In addition, the columns used for IELC can be ion exchange, normal phase [6], or a C18 reversed phase column dynamically modified with an ion pairing agent such as sodium dodecyl sulfate (SDS) [25]. In this latter work, conventional IELC of aromatic carboxylic acids such as benzoates and naphthalene sulfonates was facilitated using an ionic strength gradient initialized by injection of the sample dissolved in ammonium sulfate [25].
The aim of this work is to compare the IELC separation of aliphatic and aromatic acids using the acetylsalicylic acid hydrolysis example using both a standard HPLC cation exchange column and a surfactant dynamically modified ultra-high performance liquid chromatography (UHPLC) reversed phase column. Commercially available UHPLC columns seem to be exclusively reversed phase in nature, usually C18 or C4, targeted to separate pharmaceuticals or peptides/proteins. There has been one report of a multidimensional UHPLC method for proteome analysis using in-house packed strong cation and reversed phase capillary columns at μL min-1 flow rates [26]. However, to the best of our knowledge, UHPLC has not been reported to have been previously applied in the IELC mode with either capillary or analytical scale columns.
Experimental
Apparatus
For conventional IELC, an Agilent 1100 degasser, a Hewlett-Packard 1050 pump, and a Waters 717 autosampler were used together with a Kratos 757 Spectroflow detector. Data acquisition was done using SRI Peak Simple software. The chromatographic separation was carried out using a Tosohaas TSK-gel SP-5PW column (7.5 mm i.d. × 7.5 cm) packed with 10 μm polymethylmethacrylate-based strongly acidic cation exchange particles with -(CH2)3SO3-H+ functional groups. Design Expert 8® software (Stat-Ease, Minneapolis, MN) was used to optimize the IELC separation conditions.
For IELC in the UHPLC mode, a Dionex Ultimate 3000 Rapid Separation instrument equipped with both UV-Vis multi-wavelength and fluorescence detection capabilities was used. It is interfaced and controlled by a computer using Chromeleon software. The chromatographic separation was performed on an Acquity 1.7 μm particle UPLC® BEH C18 column (2.1 i.d mm × 5 cm).
Chemicals and Procedures
All solvents and chemicals used in this work were of analytical grade dissolved in distilled and deionized water. Sulfuric acid purchased from Fisher Scientific (Fair Lawn, New Jersey) was diluted and used as the eluent. Stock solutions of 2000 ppm acetic acid and 200 ppm salicylic acid were prepared from reagents purchased from Fisher Scientific. A stock solution of 200 ppm acetylsalicylic acid was based on the reagent purchased from Fluka (Steinheim, Germany). SDS was obtained from Sigma-Aldrich (St Louis, Missouri).
For the conventional IELC method, the optimization was done in two steps; the first step aimed to select the best acid eluent and to narrow down the range of pH and ionic strength. The second step selects the optimum pH and ionic strength from the specified range in the previous step beside optimizing the flow rate and the injection volume. For the UHP-IELC method, the UPLC® BEH C18 column was dynamically modified with sodium dodecyl sulfate (SDS) by running a 10 mM solution for 3 h at 0.3 mL min-1 and then rinsing the column exhaustively with water. The mobile phase consisted of pure water at room temperature running at a flow rate of 0.6 mL min-1 (backpressure 8500 psi).
Results and Discussion
Water was first tried as a mobile phase for IELC using the Tosohaas TSK-gel SP-5PW column. Very fast elution was observed but the peaks were severely overlapped as shown in Figure 1a. A chromatographic separation was achieved by using 0.5 mM H2SO4 (pH 3.1) at a flow rate of 1 ml min-1. The observed elution order and the prolonged retention time of salicylic acid are congruent with the reported results [17]. This delayed elution could be attributed to the lower solubility of salicylic acid as compared to acetylsalicylic acid as a result of the intramolecular H-bond formed between the hydroxyl and the carboxyl groups of salicylic acid. The run time was too long (almost 40 min) as shown in Figure 1b. A stepwise optimization study with respect to the effects of acid eluent, pH, and ionic strength was initially done to ascertain the best resolution in the shortest time and is described in the next section. Then these results were used as the basis for further optimization by Design Expert 8® StatEase professional optimization software that can at the same time optimize additional instrumental parameters such as injection volume and flow rate.
Figure 1.

Chromatograms for the separation of injection peak (1), acetic acid (2), acetylsalicylic acid (3), and salicylic acid (4) by IELC using (a) water and (b) 0.5 mM H2SO4 (pH 3.1) as mobile phases. Other conditions; flow rate: 1 mL min-1, injection volume: 50 μL, column: Tosohaas TSK-gel SP-5PW (7.5 mm i.d. × 7.5 cm, 10 μm), column temperature: 25°C.
Factors Affecting Retention
Effect of Acid Eluent
The effect of acid eluent on retention time was studied using mobile phases of sulfuric acid, carbonic acid, perchloric acid, phosphoric acid, and boric acid (0.5 mM, pH 4.3). As shown in Figure 2, strong acids such as sulfuric and perchloric, caused shorter retention times while weaker acids, such as boric and phosphoric acids, gave longer retention times. The use of carbonic acid showed a retention pattern close to that of sulfuric acid because the carbonic acid was adjusted to the proper pH with sulfuric acid. From this study, sulfuric acid was chosen as the best eluent because it gave the shortest run time and it is more stable than carbonic acid.
Figure 2.

Effect of acid eluent on retention factor of acetic acid (●), acetylsalicylic acid (■), and salicylic acid (▲) using 0.5 mM H2SO4 (1), H2CO3 (2), HClO4 (3), H3PO4 (4), and H3BO3 (5), pH 4.3. Other conditions: as in Fig. 1.
Effect of Sulfuric Acid Concentration and pH
The effect of sulfuric acid concentration was studied in the range of 0.5 M to 0.05 mM sulfuric acid (pH 4.3), and the results are shown in Figure 3. As the concentration of sulfuric acid increases, retention time also increases. An acid concentration in the range 0.1 to 1 mM was chosen for further optimization. The effect of pH on retention factor was also studied over the range 2.5 to 4.5 using 0.5 mM H2SO4 and it was found that as the pH increases, the retention time decreases. This decrease in retention is due to the increase in the degree of ionization of the acidic solutes at higher pH values (Figure 4). This effect is variable depending on the nature of the solute and the ionization constant. The narrower pH range from 3.0 to 4.0 was sufficient to use for further optimization. The stepwise optimization helps for decreasing the number of runs required for the software step and increases the reliability of the built model.
Figure 3.

Effect of H2SO4 eluent concentration on retention factor of acetic acid (●), acetylsalicylic acid (■), and salicylic acid (▲) at pH 4.3. pM = -log[H2SO4]. Other conditions: as in Fig. 1.
Figure 4.

Effect of pH on retention factor of acetic acid (●), acetylsalicylic acid (■), and salicylic acid (▲) using 0.5 mM H2SO4. Other conditions: as in Fig. 1.
Optimization of the Chromatographic Conditions
The professional optimization software (Design Expert 8® StatEase) was used to simultaneously optimize four different variables: H2SO4 concentration, pH, flow rate, and sample injection volume. These parameters were optimized based on the four responses: resolution of injection peak from acetic acid, resolution of acetic acid from acetylsalicylic acid, resolution of acetylsalicylic acid from salicylic acid, and run time. The software was set to target a resolution value of 1.5 within a range of 1.5 to 4.0 and to minimize the run time. Using a Central Composite quadratic design, the four experimental variables were varied over a program-suggested 30 runs. Constraints were placed on each variable as shown in Table 1 based on previous results and instrumental limitations. Since multiple responses were monitored, a multi-criteria decision-making function named Derringer’s desirability [27] was used. After defining the desirability criteria for each response, a d value is calculated by the software to evaluate the desirability of the test conditions and to predict the optimum chromatographic conditions. The d values range from zero to one, and the higher the d value, the better. A d value of zero means that the conditions are undesirable while a d value of one results when the conditions are fully desirable. Figure 5 shows selected response curves for the studied conditions of the various factors of H2SO4 concentration (mM), pH, injection volume (μL), and the flow rate (mL min-1). To evaluate the model, the fraction of design space (FDS), which is a powerful tool to assess the design suitability, was used. FDS represents space of the design that can estimate the response with the required precision and it should be higher than 80% in order to have a reliable model. FDS was calculated by the software and was found to be 82% and the standard error was 0.469 at a confidence level of 95%. The highest d value was obtained for the following experimental conditions: 0.35 mM H2SO4, pH 3.93 at a flow rate of 1 mL min-1 and injection volume of 72 μL.
Table 1.
The constraints of variables used in optimization.
| Variable | Range |
|---|---|
| pH | 3-4 |
| H2SO4 (mM) | 0.1-1 |
| Injection volume (μL) | 25-100 |
| Flow rate (mL min-1) | 0.5-1.0 |
Figure 5.
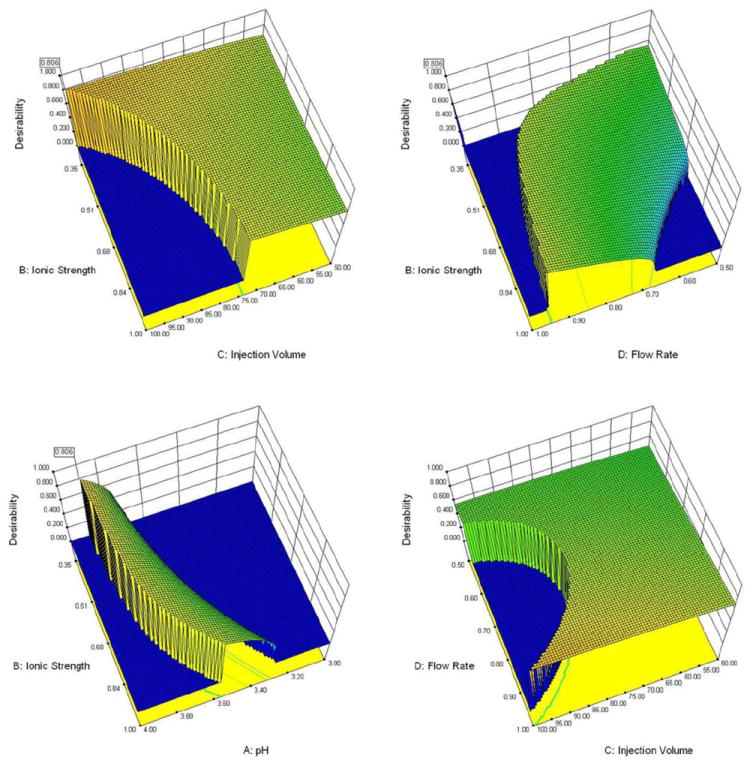
Selected response curves showing the optimized conditions of the various factors of H2SO4 concentration (mM), pH, injection volume (μL) and Flow rate (mL min-1). The range of each factor studied can be found in Table 1.
Upon trying the suggested conditions, a reasonable separation was achieved as shown in Figure 6, but the run time is still long. Using higher flow rate to decrease the run time is not possible due to column pressure operating limits. This limitation encouraged us to try using an SDS dynamically modified C18 UHPLC column to improve the separation and to decrease the run time. We started again with water as a mobile phase at a flow rate of 0.6 mL min-1 (back pressure 8500 psi) and the results were unexpectedly different from those obtained by the cation exchange column. The peaks were completely resolved without adding H2SO4 and the injection peak was hardly observable (Figure 7). Interestingly, the elution order was also different as salicylic acid eluted before acetylsalicylic acid which can be explained by the contribution of the reversed phase retention to the separation mechanism. Apparently, upon using the C18 column modified with SDS, both ion exclusion and reversed phase retention exist and the higher column pressure in this ultra high performance-IELC (UHP-IELC) technique does not change this dual separation mode. The variation in the elution order upon using mixed mode chromatography was previously reported [28]. This elution order will depend on the nature of the analyte and how much retention is induced by each mode or mechanism. The reduced hydrophobic retention due to the presence of the surfactant, permitting the use of 100% water as the mobile phase, agrees well with the reported mixed mode separation of nucleosides when a conventional C18 column is modified with a zwitterionic surfactant [29].
Figure 6.
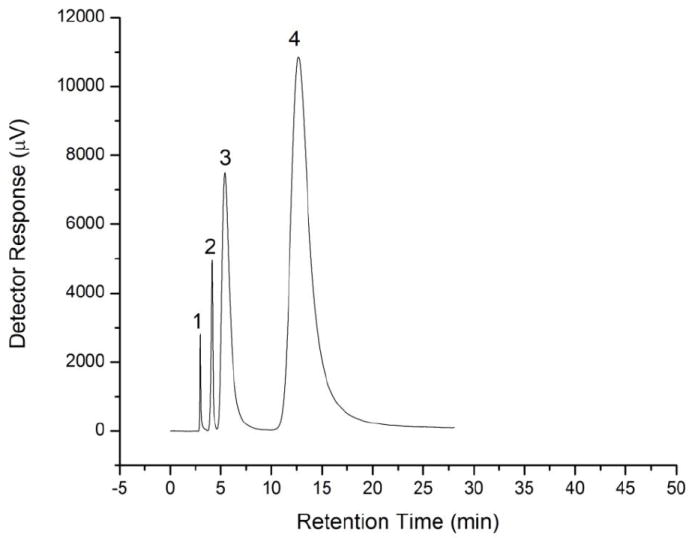
Chromatograms for the separation of injection peak (1), acetic acid (2), acetylsalicylic acid (3), and salicylic acid (4) by IELC using 0.35 mM H2SO4 (pH 3.93) as a mobile phase. Other conditions; flow rate: 1.0 mL min-1, injection volume: 72 μL, column: Tosohaas TSK-gel SP-5PW (7.5 mm i.d. × 7.5 cm, 10 μm), column temperature: 25°C.
Figure 7.
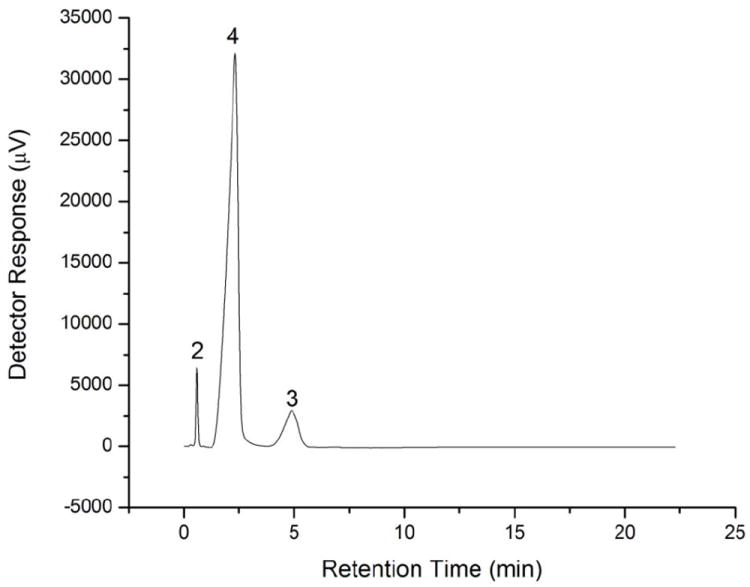
Chromatograms for the separation of acetic acid (2), acetylsalicylic acid (3), and salicylic acid (4) by UHP-IELC using water as a mobile phases. Other conditions; flow rate: 0.6 mL min-1, injection volume: 25 μL, column: Acquity UPLC® BEH C18, 1.7 μm column (2.1 i.d. mm × 5 cm) dynamically modified with SDS.
Analytical Figures of Merit
Different calibration curves were constructed for each analyte using both IELC with a conventional cation exchange column and the SDS dynamically modified C18 UHPLC column. The analytical figures of merit were calculated to compare the results obtained by the two methods as shown in Table 2. The limit of detection (LOD) and the limit of quantitation (LOQ) were calculated using the following equations: LOD = 3σ/S and LOQ = 10σ/S where σ is the standard deviation of the peak area of five blank injections and S is the slope of the calibration curve. The maximum flow rate and injection volume were utilized in UHP-IELC to facilitate the comparison with the conventional IELC method, but the variation in column diameter and particle size makes this comparison complicated. However, the short analysis time, and the pure water mobile phase render the UHP-IELC technique easier, faster and more favorable than conventional IELC.
Table 2.
Comparison between the performance data of IELC and UHP-IELC for the separation of acetic acid (AA), salicylic acid (SA), and acetylsalicylic acid (ASA).
| Parameter | IELC | UHP-IELC | ||||
|---|---|---|---|---|---|---|
|
| ||||||
| AA | SA | ASA | AA | SA | ASA | |
| Range (ppm) | 80-560 | 8-56 | 8-56 | 80-560 | 8-56 | 8-56 |
| LOD (ppm) | 1.437 | 0.004 | 0.023 | 2.261 | 0.006 | 0.027 |
| LOQ (ppm) | 4.789 | 0.014 | 0.078 | 7.536 | 0.021 | 0.090 |
| %R.S.D. | 0.71 | 0.79 | 1.78 | 0.4 | 1.32 | 0.37 |
| Slope | 0.17 | 47.07 | 11.94 | 0.17 | 50.23 | 7.87 |
| Intercept | 10.77 | - 10.55 | 45.349 | 0.78 | 48.05 | - 24.16 |
| Correlation coefficient | 0.987 | 0.989 | 0.992 | 0.990 | 0.991 | 0.986 |
| n | 6 | 6 | 7 | 6 | 6 | 7 |
Conclusion
Separation of acetylsalicylic acid from both aliphatic and aromatic degradation products was achieved using IELC by optimizing the chromatographic conditions with professional software. This software can optimize different variables simultaneously to achieve the best separation in the shortest time. The optimization showed that the analysis time could be reduced by almost a factor of two without loss of peak resolution. An even faster IELC separation was achieved by employing a C18 UHPLC column after modification with SDS. This approach eliminates the constraint of not readily available commercial ion exchange UHPLC columns with the caveat that a totally aqueous mobile phase is used, for column stationary phase reproducibility. Further work is expected in the future to study the long term stability of surfactant dynamically modified UHPLC columns under such high back pressure with applicability to the separation of basic and inorganic compounds. In addition, UHPLC reversed phase columns with a proprietary charged surface have become available and have been particularly useful for the separation of peptides [30] and proteins [31]. These columns might prove to be useful in the IELC mode.
Acknowledgments
Funding for the UHPLC instrument was made possible primarily by NIH AREA and ARRA grants.
References
- 1.Wheaton RM, Bauman WC. Annals of the NY Acad Sci. 1953;57:159–176. doi: 10.1111/j.1749-6632.1953.tb36394.x. [DOI] [PubMed] [Google Scholar]
- 2.Ohta K, Towata A, Ohashi M. J Chromatogr A. 2003;997:95–106. doi: 10.1016/s0021-9673(03)00079-7. [DOI] [PubMed] [Google Scholar]
- 3.Fritz JS, Gjerde DT. Ion Chromatography. WILEY-VCH Verlag GmbH & Co. KGA; Weinheim, Germany: 2009. [Google Scholar]
- 4.Ohta K, Tanaka K, Haddad PR. J Chromatogr A. 1997;782:33–40. [Google Scholar]
- 5.Mansour FR, Kirkpatrick CL, Danielson ND. J Chromatogr Sci. 2013 doi: 10.1093/chromsci/bmt007. [DOI] [PubMed] [Google Scholar]
- 6.Ohta K, Tanaka K. J Chromatogr A. 1999;850:177–185. doi: 10.1016/s0021-9673(99)00156-9. [DOI] [PubMed] [Google Scholar]
- 7.Ohta K, Ohashi M, Jin JY, Takeuchi T, Fujimoto C, Choi SH, Ryoo JJ, Lee KP. J Chromatogr A. 2003;997:117–125. doi: 10.1016/s0021-9673(03)00110-9. [DOI] [PubMed] [Google Scholar]
- 8.Zapała W, Kaczmarski K. Acta Chromatographica. 2010;22:1–25. [Google Scholar]
- 9.Tanaka K, Ding MY, Takahashi H, Helaleh MIH, Taoda H, Hu, Hasebe K, Haddad PR, Mori M, Fritz JS, Sarzanini C. Anal Chim Acta. 2002;474:31–35. [Google Scholar]
- 10.Tanaka K, Ding MY, Helaleh MIH, Taoda H, Takahashi H, Hu W, Hasebe K, Haddad PR, Fritz JS, Sarzanini C. J Chromatogr A. 2002;956:209–214. doi: 10.1016/s0021-9673(02)00393-x. [DOI] [PubMed] [Google Scholar]
- 11.Helaleh MIH, Tanaka K, Mori M, Xu Q, Taoda H, Ding MY, Hu W, Hasebe K, Haddad PR. J Chromatogr A. 2003;997:133–138. doi: 10.1016/s0021-9673(03)00546-6. [DOI] [PubMed] [Google Scholar]
- 12.Helaleh MIH, Tanaka K, Mori M, Xu Q, Taoda H, Ding MY. J Chromatogr A. 2003;997:139–144. doi: 10.1016/s0021-9673(03)00115-8. [DOI] [PubMed] [Google Scholar]
- 13.Mori M, Itabashi H, Helaleh MIH, Kaczmarski K, Głod B, Kowalska T. J Chromatogr A. 2006;1118:41–45. doi: 10.1016/j.chroma.2006.01.017. [DOI] [PubMed] [Google Scholar]
- 14.Zapała W, Kostka J, Kaczmarski K. Acta Chromatographica. 2011;2:377–388. [Google Scholar]
- 15.Mori M, Helaleh MIH, Xu Q, Hu W, Ikedo M, Ding MY, Taoda H, Tanaka K. J Chromatogr A. 2004;1039:129–133. doi: 10.1016/j.chroma.2004.02.012. [DOI] [PubMed] [Google Scholar]
- 16.Widiastuti R, Haddad PR, Jackson PE. J Chromatogr. 1992;602:43–50. [Google Scholar]
- 17.Glod BK, Haddad PR, Alexander PW. J Chromatogr. 1992;595:149–154. [Google Scholar]
- 18.Watson JR, Crescuolo P, Matsui F. J Pharm Sci. 1971;60:454–458. doi: 10.1002/jps.2600600324. [DOI] [PubMed] [Google Scholar]
- 19.Hobl EL, Jilma B, Ebner J, Schmid RW. Biomed chromatogr. 2013 doi: 10.1002/bmc.2846. [DOI] [PubMed] [Google Scholar]
- 20.Mullangi R, Sharma K, Srinivas NR. Biomed Chromatogr. 2012;26:906–41. doi: 10.1002/bmc.2694. [DOI] [PubMed] [Google Scholar]
- 21.Bharathi DV, Hotha KK, Kolagatla PRR, Venkateswarlu V. Biomed Chromatogr. 2013 doi: 10.1002/bmc.2832. [DOI] [PubMed] [Google Scholar]
- 22.Shaw LH, Tsai TH. J Chromatogr B. 2012;895:31–8. doi: 10.1016/j.jchromb.2012.03.010. [DOI] [PubMed] [Google Scholar]
- 23.Wudarska E, Chrzescijanska E, Kusmierek E, Rynkowski J. Electrochimica Acta. 2013;93:189–194. [Google Scholar]
- 24.Hansen SH, Jensen ME, Bjørnsdottir I. J Pharm Biomed Anal. 1998;17:1155–1160. doi: 10.1016/s0731-7085(98)00081-8. [DOI] [PubMed] [Google Scholar]
- 25.Šlais K. J Chromatogr. 1989;469:223–229. [Google Scholar]
- 26.Lee JH, Hyung S-W, Mun D-G, Jung H-J, Kim H, Lee H, Kim S-J, Park KS, Moore RJ, Smith RD, Lee S-W. J Proteome Res. 2012;11:4373–4381. doi: 10.1021/pr3004166. [DOI] [PMC free article] [PubMed] [Google Scholar]
- 27.Myers RH, Montgomery DC, Anderson-Cook CM. Response surface methodology : process and product optimization using designed experiments. John Wiley & Sons, Inc; Hoboken, New Jersey: 2009. [Google Scholar]
- 28.Lucie N, Hana V, Solich P. Talanta. 2012;93:99–105. [Google Scholar]
- 29.Hu W, Hasebe K, Reynolds DM, Haraguchi H. Anal Chim Acta. 1997;353:143–149. [Google Scholar]
- 30.Berky R, Fekete S, Fekete J. Chromatographia. 2012;75:305–312. [Google Scholar]
- 31.Fekete S, Berky R, Fekete J, Veuthey J-L, Guillarme D. J Chromatogr A. 2012;1252:90–103. doi: 10.1016/j.chroma.2012.06.066. [DOI] [PubMed] [Google Scholar]