

Abstract
It is not known whether there is a core abnormality that occurs in all cases of schizophrenia. The cognitive dysmetria hypothesis proposes that there is such an abnormality which is characterized cognitively by a disruption in control and coordination processes, and functionally by abnormal inter-regional connectivity within the cortico-cerebellar-thalamo-cortical circuit (CCTCC). In the current study, we used functional MRI (fMRI) to investigate these two key aspects of the hypothesis. Since patients with schizophrenia show deficits in attention which have been characterized extensively using the continuous performance task (CPT) and since functional imaging studies have also demonstrated that this task engages the CCTCC, we used this task to investigate whether two patient groups with distinct symptom profiles would show functional dysconnectivity within this network. Three groups of subjects participated in the study: healthy volunteers (n = 12), schizophrenia patients with both negative and positive symptoms (n = 11) and schizophrenia patients with primarily positive symptoms (n = 11). Patient groups were matched for age of illness onset and medication, and to the control group for age, gender and handedness. Subjects were scanned using fMRI whilst they performed a modified version of the CPT, involving both degraded and non-degraded stimuli. Stimulus degradation has been shown to produce decrements in sensitivity, which is thought to reflect increased demands on the limited capacity of visual attention. Between-group comparisons revealed that patients with schizophrenia, irrespective of symptomatology, showed attenuation of the anterior cingulate and cerebellar response to stimulus degradation in comparison with control subjects. We also observed disruptions of inter-regional brain integration in schizophrenia. A task-specific relationship between the medial superior frontal gyrus and both anterior cingulate and the cerebellum was disrupted in both patient groups in comparison with controls. In addition, patients with negative symptoms showed impaired behavioural performance, and abnormal task-related connectivity between anterior cingulate and supplementary motor area. These findings are consistent with theoretical accounts of schizophrenia as a disorder of functional integration, and with the cognitive dysmetria hypothesis, which posits a disconnection within the CCTCC as a fundamental abnormality in schizophrenia, independent of diagnostic subtype. Furthermore, these data show evidence of additional functional deficits in patients with negative symptoms, deficits which may explain the accompanying attentional impairment.
Keywords: schizophrenia, functional imaging, cognitive function, attention deficit
Introduction
In an attempt to identify an abnormality that could validate schizophrenia as a single phenotype, Andreasen and co-workers (Andreasen et al., 1996, 1998, 1999; Wiser et al., 1998) proposed that a core cognitive deficit, believed to be neurodevelopmental in origin, characterizes the disease. This deficit, referred to as ‘cognitive dysmetria’, involves a ‘difficulty in prioritizing, processing, coordinating and responding to information’ (Andreasen et al., 1998), and is thought to occur as a result of a disruption of the feedback mechanism within the cortico-cerebellar-thalamo-cortical circuit (CCTCC; Andreasen et al., 1996, 1998, 1999).
Numerous functional imaging studies have provided evidence for a disruption of the components of this circuit in patients with schizophrenia (for review, see Andreasen et al., 1998). This evidence has been observed across a range of cognitive tasks, supporting the notion that cognitive dysmetria is a fundamental process which could potentially explain the diverse profile of neuropsychological deficits typically observed in patients with schizophrenia. However, two central tenets of the theory have yet to be formally tested in conjunction: the first is that the physiological deficit is characterized by ‘disconnections’ between the regional nodes, the second is that this deficit is observed across people with schizophrenia who show differing patterns of symptoms.
Cognitive dysmetria is seen as an extension of the neurological concept of dysmetria, more conventionally applied to the motor system, manifest as a disturbance of the coordination of motor activity. Andreasen et al. (1999) suggest that the subtle motor dysfunctions frequently evident in the illness, such as neurological soft signs, premorbid markers and slowed reaction times, may indicate a fundamental disruption in the synchrony of thought and action. We have chosen the continuous performance task (CPT) in order to probe this possibility. The CPT is a classic behavioural assessment of attentional modulation of the motor system (Roswold et al., 1956). It is often disrupted in patients with schizophrenia (for review, see Braff and Light, 2004) and also in non-psychotic familial relatives (Grove et al., 1991; Nuechterlein, 1991; Mirsky et al., 1995; Chen et al., 1997). This may suggest that it has potential as a vulnerability marker (Addington and Addington, 1997). Patients typically show reduced target discrimination and slowed response latency. These deficits are found in chronically hospitalized or in remitted patients (Nuechterlein, 1991) and they fail to improve in line with the resolution of psychotic symptoms (Liu et al., 2000). In addition, functional imaging studies have shown that the task critically involves the functional activation of the nodes of the CCTCC in healthy volunteers (Hager et al., 1998), and elicits deficits in regional activation of this circuit in patients with schizophrenia across auditory and visual modalities (Cohen et al., 1987, 1988, 1997, 1998a; Buchsbaum et al., 1990; Siegel et al., 1993, 1995; Schroeder et al., 1994; Pugh et al., 1996; Volz et al., 1999; Potkin et al., 2002; Eyler et al., 2004; Salgado-Pineda et al., 2004). This task is, therefore, a valuable neuropsychological probe with which to investigate the possibility of functional dysconnectivity of the CCTCC across symptom categories in schizophrenia.
Patients with negative symptoms show attentional impairment, including deficits elicited by the CPT (Nuechterlein et al., 1986; Hain et al., 1993; Johnstone and Frith, 1996; Buchanan et al., 1997; Liu et al., 1997; Roitman et al., 1997). This may be due to reduced information processing capacity (Cornblatt et al., 1985; Braff, 1993) associated with abnormal frontotemporal and cerebellar metabolism (Potkin et al., 2002) and may be compounded by frontal lobe pathology (Sanfilipo et al., 2000; Mathalon et al., 2001; Sigmundsson et al., 2001). The current study sought to explore further the relationship between inter-regional functional deficits within the CCTCC circuit and attentional deficits in schizophrenic patients. The aim of the study was to identify physiological deficits common to patients across symptom types and then to identify those which are specific to patients with negative symptoms. We, therefore, scanned two groups of patients with schizophrenia. The groups differed on the basis of the presence or absence of negative symptoms. We incorporated two frequently employed versions of the CPT, involving both degraded and non-degraded stimuli, in order to index the attentional modulation of the motor system. Stimulus degradation has been shown to produce decrements in sensitivity, which is thought to reflect increased demands on the limited capacity of visual attention (Nuechterlein et al., 1983; Mass et al., 2000).
On the basis of the cognitive dysmetria theory of schizophrenia, we predicted that patients would exhibit functional dysconnectivity within the CCTCC associated with increasing attentional load. Furthermore, if this dysconnectivity truly provides a marker for the disease process, we predicted that it would be observed irrespective of symptomatology. In addition, given the relationship between negative symptoms and attentional impairment, which is not typically related to positive symptoms, we hypothesized that this cognitive impairment would be mediated by further abnormalities in the physiological systems supporting attentional processing in patients with negative symptoms, which distinguished them from healthy volunteers and patients without negative symptoms.
Methods
Subjects
Forty-two participants were recruited for the study. Two healthy volunteers and six patients were unable to comply with the scanning procedure; data are therefore reported on the remaining 34 subjects. All subjects gave written informed consent prior to involvement and received an honorarium for participation. The research protocol was approved by the Addenbrooke’s NHS Trust research ethics committee. Twenty-two outpatients with a diagnosis of schizophrenia according to DSM-IV criteria completed the study. Patients were sub-divided into patients presenting with both negative and positive symptoms (n = 11) (for convenience, these patients will subsequently be referred to as the negative patient group, as this was the only group presenting with pronounced negative symptoms), and those with primarily positive symptoms and mild/absent negative symptoms (n = 11) (subsequently referred to as the positive patient group). Current and previous psychopathology was assessed using the Comprehensive Assessment of Symptoms and History (CASH) (Andreasen et al., 1992a). All patients were receiving stable doses of atypical anti-psychotic medication at the time of study, except one patient (positive group) treated with haloperidol. Age at the time of illness onset was matched across groups. Patients were characterized by repeated hospitalizations over a chronic period of illness. Twelve healthy volunteers were recruited by advertisement within the local community. Control subjects had normal structural MR brain scans, confirmed by neuroradiological assessment, and had no previous history of neurological or psychiatric illness, based on subject’s reports during an informal screening questionnaire. All subjects were right-handed and reported no alcohol/substance abuse within 12 months prior to participation in the study. Subjects were matched for age, gender and IQ as measured using the National Adult Reading Test (NART) (Nelson, 1982) across groups.
Continuous performance test
A modified version of the original CPT (Roswold et al., 1956) was administered. The task was modified in two ways. First, we used both visually non-degraded and degraded stimuli (numerals 0, 2 4 6 and 8). The use of such degradation has been shown to accelerate the sensitivity decrement which occurs over time (Nuechterlein et al., 1983) (Fig. 1). Stimuli were degraded by randomly inverting 40% of the pixels, as this level of degradation has been shown to optimally elicit behavioural differences between patients with schizophrenia and healthy volunteers, which are not evident with increased levels of stimulus degradation (Mass et al., 2000). Secondly, stimuli were presented in 30 s blocks of either consistently degraded or non-degraded stimuli. As a reference condition for functional MRI (fMRI) image analysis, two baseline conditions were presented in which no digits were shown, but luminance was matched to the two task conditions: these stimuli were constructed by randomly inverting 40% of pixels, corresponding to the mean number of black pixels in the degraded and non-degraded task conditions (Fig. 1).
Fig. 1.
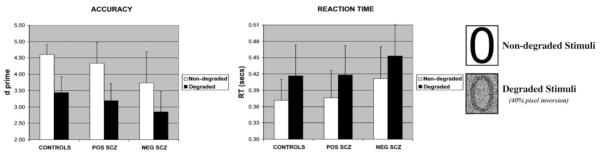
Group averages in target discrimination and reaction time for degraded and non-degraded stimuli.
The experiment was therefore a 2 (task) × 2 (degradation) factorial design. Each of the four conditions was presented five times. In each group, an ABBAABBAAB order of presentation was administered to half of the subjects, and BAABBAABBA to the other subjects, with each task preceded by its corresponding baseline condition. Each condition was preceded by a 2 s instruction screen indicating subsequent presentation of task (‘Ready’) or baseline (‘Relax’). In each block, 28 stimuli were presented for 42 ms, with an inter-stimulus interval of 958 ms, in accordance with the procedure reported by Mass et al. (2000). Task stimuli consisted of even-numbered single digits. Subjects were instructed to indicate the presentation of a target stimulus, the number zero, by pressing a response key with the right index finger. No response was required for non-targets. Target stimuli were presented on 25% of trials, pseudo-randomly interspersed amongst non-targets. In the baseline condition, numbers were not presented and no response was required from the subject. The number of black pixels in the baseline conditions corresponded to the degraded and non-degraded task conditions, producing equivalent luminance across task and baseline. Two configurations of random configurations of black pixels were presented for each baseline condition, which oscillated at a rate in order to match the rate of stimulus presentation for the task condition.
Behavioural data analysis
The signal detection theory (Green and Swets, 1966) index of sensitivity (d′) was used to measure subjects’ ability to discriminate targets from non-targets separately for the degraded and non-degraded conditions. Response latency and target discrimination were recorded during scanning. Between-group differences in target discrimination and response latency were compared using a one-way analysis of variance (ANOVA) and post hoc t-tests.
fMRI data acquisition
Imaging data were collected using a Bruker Medspec (Ettlingen, Germany) scanner operating at 3 tesla. -weighted echo-planar images, depicting BOLD contrast, were acquired in each session (TE, 27.5 ms; TR, 1.1 s). Twenty-one slices (each of 4 mm thickness; interslice gap, 1 mm; matrix size, 65 × 64) per image were acquired. Five hundred and seventy whole-brain volumes were acquired; the first six EPI images in each session were subsequently discarded to avoid T1 equilibration effects.
fMRI data analysis
Image pre-processing
fMRI data were analysed using statistical parametric mapping (SPM2; Wellcome Department of Cognitive Neurology, London, UK). This included slice acquisition time correction, within-subject image realignment, spatial normalization to a standard template (Friston and Frith, 1995) and spatial smoothing using a Gaussian kernel (8 mm full width at half-maximum). The time-series in each session was high-pass filtered (to a maximum of 1/120 Hz).
Modelling BOLD responses
Blocks of stimuli were modelled using a boxcar function incorporating a delay appropriate to the haemodynamic response. This function was used as a covariate in a general linear model in order to generate a parameter estimate for each voxel for each of two condition contrasts: (i) main effects of task (degraded and non-degraded) versus baseline (degraded and non-degraded); (ii) the effects of stimulus degradation on task-related activations (degraded task versus degraded baseline compared to non-degraded task versus non-degraded baseline). The linear combinations of parameter estimates for each contrast were stored as separate images for each subject. These contrast images were entered into second level ANOVA models as described below, to permit inferences about condition effects within- and between-groups, treating inter-subject variability as a random effect.
Between-group comparisons
Analysis of between-group differences was conducted using a between-subjects ANOVA model separately for the contrasts of task versus baseline and degraded versus non-degraded tasks (relative to each baseline, respectively, as described above). Two between-group comparisons were conducted: healthy volunteers were compared with all patients, in order to determine the effect of schizophrenia; secondly the negative patient group was compared with the positive patient group in order to determine the impact of negative symptoms on functional activation.
Masking
Type I error control
Whole-brain analyses of imaging data pose a number of statistical problems, including the risk of false positive results due to multiple comparisons. In order to eliminate this risk as far as possible, we used a combined masking procedure to ensure that we only performed statistical tests on regions of a priori interest and that we only looked for group differences in areas that showed responsiveness in the three subject groups as a whole. Thus, to begin with a structural mask was constructed using the automated anatomical labelling (AAL) template (Tzourio-Mazoyer et al., 2002), implemented using ROI software (Maldjian et al., 2003). This mask comprised key regions under test [frontal (including inferior, middle, superior and medial frontal gyri, but excluding orbitofrontal and ventral prefrontal regions), anterior cingulate cortex, striatal, thalamic and cerebellar regions]. On the basis of previous studies of attentional function, we additionally included the parietal cortex and superior temporal gyrus in this mask. All subsequent analyses were confined to the regions demarcated by this mask. We further reduced the size of the mask for each of the effects of interest (main effects of task and effects of stimulus degradation) by performing initial F tests (across all three subject groups) and limiting further pairwise analyses to those regions surviving the F test (P < 0.05). Since the ensuing pairwise t-tests, comparing group effects, were orthogonal to the across group F-tests, this constitutes a statistically rigorous approach to limiting the number of voxel-wise comparisons performed.
Constraining group comparisons
We were primarily interested in two types of group activation differences. First, we wished to establish differences between the control subjects and the schizophrenic groups, irrespective of symptomatology. Thus, we did not wish this comparison to be contaminated by regions in which the group difference was primarily attributable to one of the schizophrenic groups and not found in the other. We, therefore, produced an ‘exclusive’ mask comprising regions which showed a significant difference (at a suitably lenient threshold of P < 0.05) between the two groups of patients (for each of the key task comparisons). Any regions showing such a difference, however subtle, were excluded from the controls versus patients analysis for these comparisons. This helps to ensure that all patient versus control differences are actually found between controls and all patients, rather than arising out of a disproportionately large effect in one of the two schizophrenia groups. In order to further ensure that this procedure had successfully filtered out effects of no interest, we plotted parameter estimates across all groups for the regions surviving this series of tests. Since these masks were orthogonal to the contrast between patients and controls, parameter estimates were appropriately adjusted for the reduced search volume.
Second, in attributing unique differences to the negative symptom group, we wished to ensure that such differences were found when comparing the negative group both to the positive symptom group and to the control group. We thus initially constructed a mask on the basis of the contrast between negative patients versus control subjects, and applied this ‘inclusively’ to the negative versus positive patient group comparisons. Thus we could ensure that effects which we are attributing uniquely to the negative symptom group were found whether this group was compared to control subjects or to patients with positive symptoms. Once again, in order to further ensure that this procedure had successfully identified brain responses unique to the negative symptoms group, we plotted parameter estimates across all groups for the regions surviving this series of tests. Since the contrast used to identify the mask and that used to compare the patient groups are non-orthogonal, no adjustment of statistical thresholds was made with regard to the reduced search volume. For these a priori ROI analyses, a threshold of P < 0.005, uncorrected for multiple comparisons, was set for all contrasts described above. In order to further reduce type I error, we adopted a cluster threshold of >5 voxels for activated foci.
Analysis of task-dependent brain interactions within the CCTCC
Having identified regions in which there was a group difference in task-related activation associated with attentional load, as indexed by stimulus degradation, we sought to examine group differences in brain regions which showed a task-specific correlation with these regions. This was implemented using an analysis of ‘psychophysiological interactions’ (Friston et al., 1997). In this approach, we identify condition-specific correlations between activity in a selected region, and activity in other brain regions. We selected the anterior cingulate gyrus and cerebellar vermis, since these regions exhibited a between-group difference in task-related activity associated with attentional load. For each of these regions, individual time-series were extracted using a 2 mm sphere centred on the foci identified from the group-based comparison of task-related activation. A 2 mm sphere was considered sufficient to average across several voxels to produce a greater signal-to-noise ratio through averaging while being sufficiently small to avoid averaging across functional regions. These data were multiplied by a vector specifying the task × degradation interaction, in order to produce a vector representing the task × region covariate, with task and region incorporated separately into the model. This contrast produced individual t-statistic maps for each region, which were stored as separate images for each subject. These contrast images were entered into second level analyses, to permit inferences about condition effects within each group and between groups, treating inter-subject variability as a random effect.
The psycho-physiological interactions analysis, therefore, determined regions in which there was a significant difference in correlation with activity in the selected regions, as a function of whether subjects were performing the degraded or non-degraded versions of the task. In order to draw inferences based on differences between (i) controls and patients, and (ii) negative and positive patients, between-group comparisons were masked using the strategy described above, using identical statistical thresholds.
Results
Clinical assessments
CASH ratings were unavailable for one subject due to technical difficulties. Negative symptoms, assessed using the Scale for the Assessment of Negative Symptoms (SANS) score, were greater in the negative group (M = 11.36, SD = 2.3) compared to the positive group (M = 3.7, SD = 2.06), which was statistically significant, t(19) = 7.94; P < 0.0001. Positive symptoms, rated using the Scale for the Assessment of Positive Symptoms (SAPS) were not significantly different between groups [t(19) = 0.98, P > 0.05]. Duration of illness and age of onset of psychosis were matched across patient groups (Table 1).
Table 1.
Clinical, behavioural and demographic details
| Group | IQ | Age | Gender (females) |
Age at onset |
Duration of illness |
Antipsychotic medication (number of subjects) |
Symptom ratings |
Reaction time (s) |
Target discrimination (d-prime) |
|||
|---|---|---|---|---|---|---|---|---|---|---|---|---|
| SAPS | SANS | Non-degraded task |
Degraded task |
Non-degraded task |
Degraded task |
|||||||
| Healthy volunteers |
110.1 [10.7] | 33.3 [11.8] | 2 | - | - | - | - | - | 0.37 [0.04] | 0.42 [0.06] | 4.61 [0.3] | 3.44 [0.5] |
| Negative schizophrenia |
103.2 [12.5] | 42.64 [9.2] | 1 | 22.2 [4.2] | 20.45 [9.3] | Clozapine (10) Amisulpiride (1) |
6.73 [3.1] | 11.36 [2.3] | 0.41 [0.06] | 0.45[0.06] | 3.74 [0.9] | 2.85 [0.6] |
| Positive schizophrenia |
111.9 [7.5] | 41.1 [10.9] | 2 | 24.72 [6.4] | 16.4 [7.1] | Clozapine (8) Risperidone (1) Olanzapine (1) Haloperidol (1) |
5.4 [3.1] | 3.7 [2.1] | 0.38 [0.05] | 0.42[0.05] | 4.34 [0.6] | 3.19 [0.5] |
Behavioural performance
Target discrimination and reaction time data are presented in Fig. 1. One-way ANOVA revealed a significant effect of degradation, with reduced target discrimination [F(1,31) = 174.6; P < 0.0001] and increased response latency [F(1,31) = 100.4; P < 0.0001] for the degraded compared to the non-degraded stimuli condition. There was a main effect of group for discrimination [F(1,31) = 4.9; P = 0.015] but not reaction time [F(1,31) = 1.82; P = 0.179]. Post hoc comparisons exploring the effect of group using Tukey’s HSD test indicated that the negative schizophrenia group showed significantly reduced discrimination (P = 0.012) compared to healthy volunteers, but not the positive schizophrenia group (P = 0.528). The two-way interactions between group and degradation were non-significant for both discrimination and response latency (P > 0.05). Combining data from the negative and positive patient groups, patients showed reduced target discrimination compared to controls [F(1,32) = 5.41; P = 0.026], but there was no group difference in reaction time [F(1,32) = 1.11; P = 0.3]; two-way interactions between group and degradation were non-significant for both discrimination and reaction time for controls compared to patients [P > 0.05].
Regional fMRI response
Task versus baseline
Regional activation maps for the between-group comparisons are presented in Fig. 2; co-ordinates of significant foci are detailed in Table 2. Compared to healthy controls, patients showed reduced activation of left putamen, medial frontal gyrus and bilateral posterior parietal cortex (Fig. 2A; Table 2). Increased activation of a broad range of regions was observed in patients relative to controls, including bilateral thalamus, left caudate, bilateral inferior and superior parietal cortex, superior temporal gyrus, supplementary motor area (SMA) and cingulate gyrus (Fig. 2B and Table 2). The negative patient group showed increased activation of right middle frontal gyrus, right superior temporal gyrus and left superior parietal cortex (Fig. 2C and Table 2).
Fig. 2.

Between-group differences in activity associated with task versus baseline. For each between group comparison (A–C), maximum intensity projections from sagittal, coronal and axial perspectives are presented. On the right of the figure, parameter estimates from selected regions are shown for each group to illustrate group differences. For each of these selected regions, activation is superimposed on a representative T1-weighted image rendered into the same anatomical space, and sectioned in order to visualize the region from which the selected parameter estimates were extracted. For details of co-ordinates see Table 2.
Table 2.
Co-ordinates of significant foci for pairwise contrasts between task and baseline
| Brain region | MNI co-ordinates |
Z-score | P-value | ||
|---|---|---|---|---|---|
| x | y | z | |||
| Controls > patients | |||||
| Angular gyrus | −44 | −68 | 30 | 3.2 | 0.001 |
| *Putamen | −28 | 12 | −4 | 3.06 | 0.001 |
| Medial frontal gyrus | −2 | 54 | 10 | 2.98 | 0.001 |
| Angular gyrus | 54 | −68 | 32 | 2.89 | 0.002 |
| Patients > controls | |||||
| Superior frontal gyrus | 26 | 4 | 64 | 4.11 | 0.0001 |
| Inferior parietal lobule | 62 | −34 | 34 | 4.08 | 0.0001 |
| Posterior cingulate | 10 | −30 | 38 | 4.06 | 0.0001 |
| Post-central gyrus | 48 | −18 | 46 | 3.89 | 0.0001 |
| Superior frontal gyrus | −20 | −2 | 64 | 3.88 | 0.0001 |
| Inferior parietal lobule | −60 | −36 | 36 | 3.81 | 0.0001 |
| *Caudate nucleus | −12 | 22 | 6 | 3.68 | 0.0001 |
| Thalamus | −14 | −30 | 0 | 3.65 | 0.0001 |
| Pre-central gyrus | −56 | −4 | 8 | 3.64 | 0.0001 |
| Superior parietal lobule | 18 | −72 | 54 | 3.59 | 0.0001 |
| Superior temporal gyrus | −50 | −4 | −12 | 3.57 | 0.0001 |
| Inferior parietal lobule | −24 | −68 | 44 | 3.52 | 0.0001 |
| Thalamus | 6 | −30 | 6 | 3.28 | 0.001 |
| Inferior parietal lobule | 46 | −34 | 46 | 3.23 | 0.001 |
| Superior temporal gyrus | 62 | −12 | 0 | 3.19 | 0.001 |
| Cingulate gyrus | 6 | −10 | 30 | 3.19 | 0.001 |
| Cerebellum | 30 | −38 | −28 | 3.17 | 0.001 |
| Thalamus | 20 | −30 | 8 | 3.15 | 0.001 |
| Middle frontal gyrus | 34 | 48 | −4 | 2.96 | 0.002 |
| Inferior frontal gyrus | 44 | 22 | 10 | 2.79 | 0.003 |
| Negative > positive | |||||
| Superior temporal gyrus | 36 | −48 | 14 | 3.13 | 0.001 |
| *Middle frontal gyrus | 30 | 58 | −6 | 2.94 | 0.002 |
| Superior parietal lobule | −32 | −76 | 46 | 2.91 | 0.002 |
Asterisks indicate selected regions for which parameter estimates plotted are plotted in Fig. 2.
Degraded versus non-degraded stimuli
Regional activation maps for the between-group comparisons are presented in Fig. 3; co-ordinates of significant foci are detailed in Table 3. Patients showed reduced activation of anterior cingulate and cerebellum. No increases were observed in the patient group, and there were no significant differences between positive and negative patient groups.
Fig. 3.
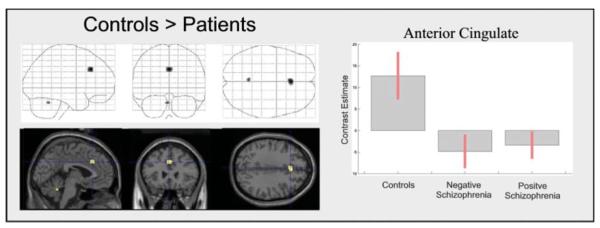
Between-group differences in activity associated with degraded versus non-degraded stimuli. The figure is presented as described previously. See Table 3 for co-ordinates.
Table 3.
Co-ordinates of significant foci for pairwise contrasts between degraded and non-degraded stimuli
| Brain region | MNI co-ordinates |
Z-score | P-value | ||
|---|---|---|---|---|---|
| x | y | z | |||
| Controls > patients | |||||
| Anterior cingulate | 0 | 26 | 34 | 3.93 | 0.0001 |
| Cerebellum | −4 | −52 | −28 | 3.38 | 0.0001 |
Psycho-physiological interactions
Anterior cingulate
On the basis of the observed difference in the response amplitude of the anterior cingulate and cerebellum in patients compared to controls, we selected these regions to evaluate between-group differences in task-related correlations of activity in the anterior cingulate and other regions of the CCTCC, and similarly for the cerebellum. This analysis, therefore, serves to determine whether the influence of cingulate-mediated processes engendered by the degraded CPT (relative to the visually-matched baseline) upon other brain regions differs across groups, compared to that observed for the non-degraded version. Group comparisons of correlation maps for the anterior cingulate are presented in Fig. 4; co-ordinates of significant foci are detailed in Table 4.
Fig. 4.

(A–D) Psycho-physiological interactions with task-related activity in anterior cingulate. The figure is presented as described previously. See Table 4 for co-ordinates.
Table 4.
Co-ordinates of significant foci demonstrating psycho-physiological correlations with the anterior cingulate gyrus (MNI co-ordinates: 0 24 36)
| Brain region | MNI co-ordinates |
Z-score | P-value | ||
|---|---|---|---|---|---|
| x | y | z | |||
| Controls > patients | |||||
| Medial superior frontal gyrus |
−4 | 44 | 46 | 4.84 | 0.0001 |
| Medial superior frontal gyrus |
8 | 40 | 48 | 3.99 | 0.0001 |
| Medial superior frontal gyrus |
20 | 56 | 30 | 3.48 | 0.0001 |
| Medial frontal gyrus | 14 | 44 | 24 | 3.1 | 0.001 |
| Medial superior frontal gyrus |
4 | 60 | 14 | 3.38 | 0.0001 |
| Inferior frontal gyrus | −52 | 16 | 6 | 3.36 | 0.0001 |
| Inferior frontal gyrus | −42 | 34 | −6 | 3.06 | 0.001 |
| Medial superior frontal gyrus |
−16 | 58 | 32 | 2.86 | 0.002 |
| Inferior frontal gyrus | 40 | 18 | −20 | 2.81 | 0.002 |
| Patients > controls | |||||
| Pre-central gyrus | 62 | −10 | 32 | 3.48 | 0.0001 |
| Post-central gyrus | 62 | −16 | 16 | 3.41 | 0.0001 |
| Pre-central gyrus | 52 | −14 | 12 | 3.34 | 0.0001 |
| Cerebellum | −24 | −66 | −28 | 3.37 | 0.0001 |
| Pre-central gyrus | −42 | −6 | 60 | 2.76 | 0.003 |
| Negative > positive | |||||
| Anterior cingulate | 14 | 20 | 28 | 3.07 | 0.001 |
| Negative < positive | |||||
| SMA | −4 | 2 | 66 | 3.05 | 0.001 |
In control subjects, increased task-related correlation of cingulate activity was observed in the left inferior frontal gyrus, and extensively within the medial superior frontal gyrus (Fig. 4A) compared to patients. Schizophrenic patients showed greater tasked-related correlation of cingulate activity with right pre/post-central gyri and left cerebellum (Fig. 4B).
Patients with negative symptoms showed greater correlation of cingulate activity within a nearby foci of the cingulate gyrus (Fig. 4C). Increased task-related correlation between the anterior cingulate and SMA was observed for the controls and positive patient group, but not the negative patients (Fig. 4D).
Cerebellum
Between-group comparisons of correlation maps for the cerebellum are presented in Fig. 5; co-ordinates of significant foci are detailed in Table 5. Task-related correlation of activity in the cerebellum was significantly greater in the degraded condition for the controls compared to the patients in the medial superior frontal gyrus. Indeed, this was remarkably similar to the group difference in pattern of task-related correlation with the anterior cingulate noted earlier.
Fig. 5.

(A–C) Psycho-physiological interactions with task-related activity in cerebellum. The figure is presented as described previously. See Table 5 for co-ordinates.
Table 5.
Co-ordinates of significant foci demonstrating psycho-physiological correlations with the cerebellum (MNI co-ordinates: −4 −52 −28)
| Brain region | MNI co-ordinates |
Z-score | P-value | ||
|---|---|---|---|---|---|
| x | y | z | |||
| Controls > patients | |||||
| Medial superior frontal gyrus |
−4 | 48 | 38 | 3.23 | 0.001 |
| Medial frontal gyrus | −6 | 46 | −6 | 3.04 | 0.001 |
| Medial superior | 4 | 48 | 38 | 2.77 | 0.003 |
| frontal gyrus | |||||
| Medial superior | 16 | 52 | 24 | 2.73 | 0.003 |
| frontal gyrus | |||||
| Patients > controls | |||||
| Middle frontal gyrus | −42 | 52 | 0 | 2.74 | 0.003 |
| Negative < positive | |||||
| Inferior frontal gyrus |
−26 | 34 | −10 | 3.72 | 0.0001 |
| Cingulate gyrus | 14 | −18 | 36 | 3.64 | 0.0001 |
| Superior parietal lobule | −20 | −60 | 48 | 3.55 | 0.0001 |
| Pre-central gyrus | 58 | −14 | 40 | 3.34 | 0.0001 |
| Pre-central gyrus | 56 | −2 | 12 | 3.11 | 0.001 |
| Inferior frontal gyrus | 38 | −4 | 34 | 3.08 | 0.001 |
| Post-central gyrus | −40 | −26 | 40 | 2.83 | 0.002 |
Task-related cerebellar activity was correlated with a small focus in the left middle frontal gyrus in patients but not controls (Fig. 5A). Several regions showed increased correlation with cerebellar activity in the negative patient group; however, as these were observed for the non-degraded condition, which was unpredicted, these are reported in Table 5 for completeness, but will not be considered further.
Summary
In thalamus bilaterally, in left caudate nucleus and in frontal and temporal regions, the response to the task (irrespective of stimulus degradation) compared to baseline was abnormally high in the patient groups (irrespective of symptom profile). Conversely, there was under-activation in middle frontal gyrus, putamen and angular gyrus in the patient groups.
We observed further differences in activation that appeared to be dependent upon the symptom profile. Specifically, people with negative symptoms showed over-activation in superior temporal, parietal and superior frontal regions compared with controls and patients with positive symptoms. While symptom patterns did not appear to be associated with differences in association with stimulus degradation, there was an overall attenuation of the anterior cingulate and cerebellar responses to increasing task difficulty in both groups of people with schizophrenia compared to control subjects.
Having observed these failures of response in anterior cingulate cortex and cerebellum, we used psycho-physiological interactions methodology to establish whether these regions showed abnormal task-dependent connectivity in schizophrenia. These findings are summarized in Fig. 6.
Fig. 6.
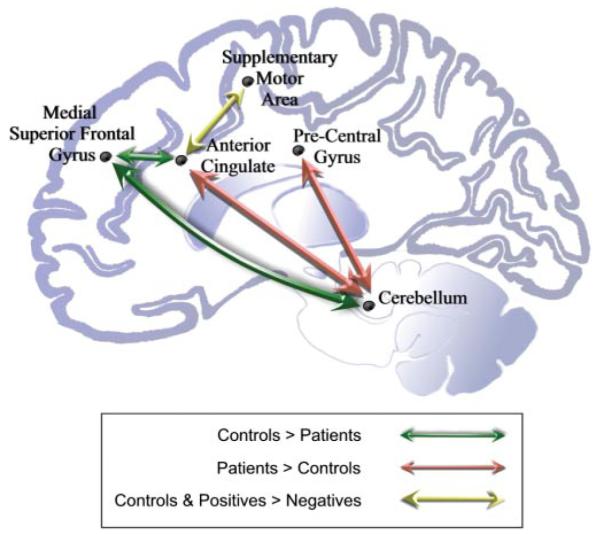
Schematic representations of group differences in functional connectivity within the CCTCC.
Stimulus degradation was associated with increased connectivity between anterior cingulate cortex and left lateral and medial frontal cortex in control subjects. This relationship was disrupted in both groups of patients, irrespective of symptoms. Patients, however, show increased task-dependent connectivity between anterior cingulate and two key regions: cerebellum and pre- and post-central gyrus. In addition, patients with negative symptoms showed reduced connectivity between anterior cingulate and the SMA, compared to patients with positive symptoms and to controls.
Discussion
Schizophrenia is increasingly conceptualized as a disorder of integration between brain regions (Friston and Frith, 1995; Bullmore et al., 1997). The current study demonstrates that inter-regional relationships in brain activity are indeed disrupted in schizophrenia. More specifically, while both anterior cingulate and cerebellum show a task-specific relationship with medial superior frontal gyrus in healthy volunteers, this relationship appears disrupted in people with schizophrenia. Furthermore, this disruption was noted irrespective of the clinical presentation. An interpretation of these findings is that, in healthy subjects, the superior frontal gyrus has a mediating or coordinating role but that this is impaired or lost in schizophrenia. This supports the prediction of the cognitive dysmetria hypothesis of schizophrenia, which posits both that a disconnection within the CCTCC is a fundamental abnormality in schizophrenia, and that this disconnection is independent of diagnostic subtype. However, there was a pattern of disruption that appeared unique to the group showing negative symptoms, in whom the functional connection between the anterior cingulate and SMA was abnormal, in comparison with healthy controls and with patients showing primarily positive symptoms. This extends the cognitive dysmetria hypothesis, and shows that, in addition to the core abnormality, common to all patients, negative symptoms are associated with further functional deficits. These additional deficits may explain the association between negative symptoms and attentional impairment.
We observed two abnormalities in the anterior cingulate cortex in people with schizophrenia. First, they showed, irrespective of symptoms, a failure of task-related activation in responding to the demands of the more difficult (degraded) task. Second, the pattern of task-related connectivity was disrupted. This suggests both that the region is failing to respond and that the functional circuit of which it forms a part is abnormally integrated. Our findings are in keeping with numerous post-mortem and in vivo structural imaging studies showing neuronal cell loss in this region in schizophrenic patients (Benes and Bird, 1987; Goldstein et al., 1999; Sigmundsson et al., 2001; Job et al., 2002; Shapleske et al., 2002; Velakoulis et al., 2002; Szeszko et al., 2003; Stark et al., 2004; Woo et al., 2004; Todtenkopf et al., 2005). It is consistent too with functional imaging studies of schizophrenic patients who have shown failure of anterior cingulate activation across a range of cognitive paradigms, including response anticipation (Quintana et al., 2004), cognitive interference (Heckers et al., 2004), conflict (Dehaene et al., 2003), stroop (Yucel et al., 2002; Weiss et al., 2003), verbal encoding/retrieval (Crespo-Facorro et al., 1999; Fletcher et al., 1999; Ragland et al., 2001; Hofer et al., 2003), CPT (Siegel et al., 1995; Keilp et al., 1997; Salgado-Pineda et al., 2004), response inhibition (Rubia, 2002; Laurens et al., 2003) and facial affect recognition (Hempel et al., 2003). While a precise role for the region has not been defined and, indeed, it is likely that there are a number of functional sub-divisions, anterior cingulate cortex is likely to participate in higher order coordination and control processes (for review see Allman et al., 2001; Rushworth et al., 2004). Our finding that it shows abnormal activation and disrupted integration with other key brain regions is in keeping with the view that such control and coordination processes may represent a fundamental abnormality in schizophrenia.
The observed disruption of cingulate functional connectivity in schizophrenia was independent of clinical presentation and was highly specific, both anatomically and cognitively. That is, it was observed in relation to cingulo-prefrontal connections and seen in the setting of the most demanding version of the task. The anatomical relationship between these structures is well established, and the functional system which these regions support has been theoretically implicated in both schizophrenia and attentional (dys)function. The medial superior frontal gyrus and anterior cingulate are major components of the archicortical system, according to Sanides’ ‘evolutionary cytoarchitectonic dual trends’ model (Sanides, 1969). The archicortical system is theoretically distinct from the more ventrolateral palaeocortical system, a partitioning corroborated by extensive autoradiographic tracing studies (Pandya et al., 1981). Bilder and co-workers suggest that this dual division of frontal neocortex is directly relevant to understanding the neurocognitive deficits of schizophrenia, and that the profile of neuropsychological impairment in schizophrenia is consistent with a defect of the archicortical trend (Bilder, 1997; Christensen and Bilder, 2000). More specifically, Tamminga et al. (2000, 2003) have suggested that attentional and working memory deficits in schizophrenia are a consequence of anterior cingulate and medial frontal dysfunction. The observation of disrupted connectivity between anterior cingulate and medial frontal cortex in the current study is, therefore, consistent with several contemporary theories of the pathophysiology of schizophrenia. Furthermore, we have demonstrated that these misconnections within frontal cortex have important implications for cortico-cerebellar interactions.
The relationship between specific symptoms and disconnections within the CCTCC is not yet known. Andreasen et al. (1999) proposed that disruptions of the CCTCC could engender different symptom profiles. In relation to negative symptoms, it was suggested that impedance of information flow in the circuit could give rise to symptoms such as alogia or affective blunting. One possibility is that symptom formation may be linked to specific disconnections within the CCTCC. In this study we observed that functional connectivity between anterior cingulate and SMA was disrupted in patients with negative symptoms, but not in patients with primarily positive symptoms. There are strong anatomical connections between these two regions (Bates and Goldman-Rakic, 1993; Luppino et al., 1993) and it has been suggested that they are involved jointly in mediating the context-sensitive, goal-setting functions of the prefrontal cortex, sensory analysis functions of the inferior parietal lobule, and the executive components of the motor system (Goldberg, 1985). Posner and Raichle (1996), moreover, proposed that midline frontal areas including anterior cingulate cortex and SMA participated in a key aspect of attentional control: ‘the control of goal-directed behaviour, target detection, error detection, conflict resolution and inhibition of automatic responses,’ (Berger and Posner, 2000). It is possible that the observed disruption of cingulate-SMA connectivity in patients with negative symptoms causes or reflects a failure to engage in these attentional controlling processes leading to impaired target detection as observed in this study. Perhaps, more generally, they could be manifest in a disruption of goal-directed behaviour, providing a physiological basis for the generation of negative symptoms in schizophrenia. This is compatible with the assessment of the post-operative pattern of cognitive impairments reported by Ochsner et al. (2001) in a psychiatric patient following anterior cingulotomy. The observed deficits led them to conclude: ‘anterior cingulate cortex may monitor the goal-related significance of stimuli and signal (to other prefrontal components of the executive control system) when behavioural change and re-orientation of attention is required.’ (Ochsner et al., 2001).
To our knowledge this is the first functional imaging study to directly compare degraded and non-degraded versions of the CPT in schizophrenic patients. Comparison to previous studies is, therefore, not straightforward, and is further complicated by the use of different versions of the CPT. However, we note that despite these methodological differences, several studies have also previously reported abnormal function of the anterior cingulate during CPT performance in patients with schizophrenia (Buchsbaum et al., 1992; Schroder et al., 1996; Cohen et al., 1997, 1998a; Volz et al., 1999; Carter et al., 2001) and in non-psychotic familial relatives (Thermenos et al., 2004). In addition, Cohen et al. (1998b) found that reduced metabolism in the right anterior midprefrontal cortex predicted a better response to neuroleptics, and reduced cingulate metabolism predicted a poor response. Using PET scanning and a degraded version of the CPT, Schroder et al. (1996) showed that both delusions and negative symptoms were associated with attenuated anterior cingulate and medial frontal responses. With regard to negative symptoms, our findings partially replicate those of the only previous functional imaging study to examine the effects of negative symptoms on regional activation during CPT performance (Potkin et al., 2002). Potkin and colleagues reported differences in right hemispheric activation, particularly in the temporal and ventrolateral prefrontal cortices in patients with negative symptoms. Similar regional abnormalities were observed in the present study. Whilst we observed increased activation of these regions in association with negative symptoms, Potkin and colleagues reported decreased activation. Possible reasons for this apparent discrepancy include the use of different versions of the task employed together with different symptom profiles, medication status, imaging modality and sample size.
In considering the observations made in this study, we should raise some important caveats. First, we must acknowledge that these findings are based upon limited numbers of subjects and, while this is, to a large extent, mitigated by the fact that we are testing a priori hypotheses based upon a well-defined model, nevertheless they should for this reason, be treated cautiously. Furthermore, patients studied were treated with atypical neuroleptic medication. While this is not a problem in interpreting the differences between the two patient groups (both being medicated), it should be considered in evaluating the patient versus control comparisons. We believe that there are number of grounds for attributing our findings to schizophrenia rather than to medication. First, we know that cognitive deficits in schizophrenia are not due to treatment (indeed, if anything, higher doses and chronic treatment seem to improve cognition (King, 1990; Mortimer, 1997). Focusing on treatment with atypical neuroleptics (given that 21 of our 22 subjects were on atypicals) and, in particular, to a possible impact upon attentional processing, there is much evidence that performance on a task comparable to the one that we report is not affected (Daniel et al., 1996; Stuve et al., 1997) nor performance on other attentional tasks (Goldberg et al., 1993; Zahn et al., 1994). This point is also supported by a meta-analysis (Keefe et al., 1999). There is, though, some evidence of an impact of atypical treatment: Stip and Lussier (1996) noted a normalization of performance. From the perspective of changes in brain metabolism produced by drug treatment, the most recent meta-analysis (Hill et al., 2004) suggests no regionally specific effects. Furthermore, previous studies have reported that task-related activation in the anterior cingulate is reduced in neuroleptic-naïve patients (Andreasen et al., 1992b) and is increased in this region (Braus et al., 2001, 2002) and the cerebellum (Stephan et al., 2001) with atypical anti-psychotic treatment. One may speculate that the effect of treatment in these patients would therefore, if anything, predispose against finding a disease-related deficit in these regions. Of course, future studies involving drug-naïve subjects are required to resolve this question ultimately.
There are some other technical issues in this study warranting further consideration. Firstly, we consider the behavioural performance of the subjects during scanning. The patients were clearly engaged in the task, and mean group performance was acceptable (mean number of targets correctly identified: controls = 98.0%; positive group = 92.6%; negative group = 88.2%). The target discrimination of the negative patient group was significantly reduced compared to controls. An important question is, therefore, whether group differences in activation for the task versus baseline contrast are wholly or partly attributable to differential performance. We do not believe that this possibility renders our key findings ambiguous given that these relate to the effects of stimulus degradation on brain response. Since there were no between-group behavioural differences in responses to degraded versus non-degraded stimuli, behavioural differences cannot be directly invoked to account for the reported functional abnormalities. A second consideration relates to whether the cognitive and physiological deficits observed may relate to deficits in early visual processing of the stimuli, rather than, or in combination with, higher order functions. Whilst we are not able to exclude this possibility on the basis of these data, it might lead us to expect a greater impact of stimulus degradation stimuli in the patients, or specifically in the negative symptoms group, which was not observed in this study.
Finally, the issue of the negative/positive distinction in schizophrenia is worthy of further consideration. In this study, we chose the strategy of identifying patients with mixed positive and negative symptoms, and comparing these with patients exhibiting only positive symptoms in order to identify common effects and those effects unique to the presence of negative symptoms. It might be argued that the effects that we here attribute to schizophrenia as a whole are actually produced by positive symptoms alone. Whilst this possibility cannot be excluded, we do not believe that it provides a likely explanation of the data. Previous studies have consistently demonstrated an association between attentional impairment and negative symptoms (Nuechterlein et al., 1986; Hain et al., 1993; Johnstone and Frith, 1996; Buchanan et al., 1997; Liu et al., 1997; Roitman et al., 1997), as observed in this study, and it is, therefore, unlikely that the physiological correlate of increasing attentional demand would be specific to positive symptoms. We chose to adopt the grouping strategy used in this study based on the consideration that the typical clinical presentation involves a mixture of both positive and negative symptoms; thus to select samples with exclusively positive or negative symptoms may reflect extremes of the illness, which may be unrepresentative of the general clinical population. A limitation of our approach is that we are not able to distinguish between primary and secondary negative symptoms in this study. However, our findings are consistent with those of Buchanan et al. (1997) indicating that CPT performance impairment is related to the deficit syndrome, which is based on the presence of primary, enduring negative symptoms. Future replications of the current findings could incorporate the deficit/nondeficit categorization, or sub-syndromal groupings based on multivariate methods, such as factor analysis, to relate more definitively the disconnectivity between anterior cingulate and SMA to negative symptoms.
In conclusion, the current study has identified deficits of functional connectivity within the prefrontal cortex and projection areas, which are commensurate with contemporary theories of the pathophysiological basis of schizophrenia. Models of anterior cingulate (dys)function provide some indication of the physiological basis of schizophrenia, and the core dysfunction of attentional perturbation associated with negative symptoms.
Acknowledgements
This work was sponsored by a Wellcome Trust grant awarded to P.C.F. G.D.H., P.R.C. and R.A.E.H. were also supported by the Wellcome Trust. We would like to thank the staff of the Wolfson Brain Imaging Centre, Addenbrooke’s Hospital for technical support, and also the participants involved in the study.
Abbreviations
- CCTCC
cortico-cerebellar-thalamo-cortical circuit
- CPT
continuous performance task
- fMRI
functional MRI
- SMA
supplementary motor area
References
- Addington J, Addington D. Attentional vulnerability indicators in schizophrenia and bipolar disorder. Schizophr Res. 1997;23:197–204. doi: 10.1016/s0920-9964(96)00105-3. [DOI] [PubMed] [Google Scholar]
- Allman JM, Hakeem A, Erwin JM, Nimchinsky E, Hof P. The anterior cingulate cortex. The evolution of an interface between emotion and cognition. Ann N Y Acad Sci. 2001;935:107–17. [PubMed] [Google Scholar]
- Andreasen NC, Flaum M, Arndt S. The Comprehensive Assessment of Symptoms and History (CASH). An instrument for assessing diagnosis and psychopathology. Arch Gen Psychiatry. 1992a;49:615–23. doi: 10.1001/archpsyc.1992.01820080023004. [DOI] [PubMed] [Google Scholar]
- Andreasen NC, Rezai K, Alliger R, Swayze IV, Flaum M, Kirchner P, et al. Hypofrontality in neuroleptic-naïve patients and in patients with chronic schizophrenia. Assessment with xenon 133 single-photon emission computed tomography and the Tower of London. Arch Gen Psychiatry. 1992b;49:943–58. doi: 10.1001/archpsyc.1992.01820120031006. [DOI] [PubMed] [Google Scholar]
- Andreasen NC, O’Leary DS, Cizadlo T, Arndt S, Rezai K, Ponto LL, et al. Schizophrenia and cognitive dysmetria: a positron-emission tomography study of dysfunctional prefrontal-thalamic-cerebellar circuitry. Proc Natl Acad Sci USA. 1996;93:9985–90. doi: 10.1073/pnas.93.18.9985. [DOI] [PMC free article] [PubMed] [Google Scholar]
- Andreasen NC, Paradiso S, O’Leary DS. ‘Cognitive dysmetria’ as an integrative theory of schizophrenia: a dysfunction in cortical-subcortical-cerebellar circuitry? Schizophr Bull. 1998;24:203–18. doi: 10.1093/oxfordjournals.schbul.a033321. [DOI] [PubMed] [Google Scholar]
- Andreasen NC, Nopoulos P, O’Leary DS, Miller DD, Wassink T, Flaum M. Defining the phenotype of schizophrenia: cognitive dysmetria and its neural mechanisms. Biol Psychiatry. 1999;46:908–20. doi: 10.1016/s0006-3223(99)00152-3. [DOI] [PubMed] [Google Scholar]
- Bates JF, Goldman-Rakic PS. Prefrontal connections of medial motor areas in the rhesus monkey. J Comp Neurol. 1993;336:211–28. doi: 10.1002/cne.903360205. [DOI] [PubMed] [Google Scholar]
- Benes FM, Bird ED. An analysis of the arrangement of neurons in the cingulate cortex of schizophrenic patients. Arch Gen Psychiatry. 1987;44:608–16. doi: 10.1001/archpsyc.1987.01800190024004. [DOI] [PubMed] [Google Scholar]
- Berger A, Posner MI. Pathologies of brain attentional networks. Neurosci Biobehav Rev. 2000;24:3–5. doi: 10.1016/s0149-7634(99)00046-9. [DOI] [PubMed] [Google Scholar]
- Bilder RM. Neurocognitive impairment in schizophrenia and how it affects treatment options. Can J Psychiatry. 1997;42:255–64. doi: 10.1177/070674379704200303. [DOI] [PubMed] [Google Scholar]
- Braff DL. Information processing and attention dysfunctions in schizophrenia. Schizophr Bull. 1993;19:233–59. doi: 10.1093/schbul/19.2.233. [DOI] [PubMed] [Google Scholar]
- Braff DL, Light GA. Preattentional and attentional cognitive deficits as targets for treating schizophrenia. Psychopharmacology (Berl) 2004;174:75–85. doi: 10.1007/s00213-004-1848-0. [DOI] [PubMed] [Google Scholar]
- Braus DF, Ende G, Weber-Fahr W, Demirakca T, Henn FA. Favorable effect on neuronal viability in the anterior cingulate gyrus due to long-term treatment with atypical antipsychotics: an MRSI study. Pharmacopsychiatry. 2001;34:251–3. doi: 10.1055/s-2001-18037. [DOI] [PubMed] [Google Scholar]
- Braus DF, Ende G, Weber-Fahr W, Demirakca T, Tost H, Henn FA. Functioning and neuronal viability of the anterior cingulate neurons following antipsychotic treatment: MR-spectroscopic imaging in chronic schizophrenia. Eur Neuropsychopharmacol. 2002;12:145–52. doi: 10.1016/s0924-977x(02)00003-2. [DOI] [PubMed] [Google Scholar]
- Buchsbaum MS, Nuechterlein KH, Haier RJ, Wu J, Sicotte N, Hazlett E, et al. Glucose metabolic rate in normals and schizophrenics during the Continuous Performance Test assessed by positron emission tomography. Br J Psychiatry. 1990;156:216–27. doi: 10.1192/bjp.156.2.216. [DOI] [PubMed] [Google Scholar]
- Buchsbaum MS, Haier RJ, Potkin SG, Nuechterlein K, Bracha HS, Katz M, et al. Frontostriatal disorder of cerebral metabolism in never-medicated schizophrenics. Arch Gen Psychiatry. 1992;49:935–42. doi: 10.1001/archpsyc.1992.01820120023005. [DOI] [PubMed] [Google Scholar]
- Buchanan RW, Strauss ME, Breier A, Kirkpatrick B, Carpenter WT., Jr Attentional impairments in deficit and nondeficit forms of schizophrenia. Am J Psychiatry. 1997;154:363–70. doi: 10.1176/ajp.154.3.363. [DOI] [PubMed] [Google Scholar]
- Bullmore ET, Frangou S, Murray RM. The dysplastic net hypothesis: an integration of developmental and dysconnectivity theories of schizophrenia. Schizophr Res. 1997;28:143–56. doi: 10.1016/s0920-9964(97)00114-x. [DOI] [PubMed] [Google Scholar]
- Carter CS, MacDonald AW, 3rd, Ross LL, Stenger VA. Anterior cingulate cortex activity and impaired self-monitoring of performance in patients with schizophrenia: an event-related fMRI study. Am J Psychiatry. 2001;158:1423–8. doi: 10.1176/appi.ajp.158.9.1423. [DOI] [PubMed] [Google Scholar]
- Chen YC, Galpern WR, Brownell AL, Matthews RT, Bogdanov M, Isacson O, et al. Detection of dopaminergic neurotransmitter activity using pharmacologic MRI: correlation with PET, microdialysis, and behavioral data. Magn Reson Med. 1997;38:389–98. doi: 10.1002/mrm.1910380306. [DOI] [PubMed] [Google Scholar]
- Christensen BK, Bilder RM. Dual cytoarchitectonic trends: an evolutionary model of frontal lobe functioning and its application to psychopathology. Can J Psychiatry. 2000;45:247–56. doi: 10.1177/070674370004500303. [DOI] [PubMed] [Google Scholar]
- Cohen RM, Semple WE, Gross M, Nordahl TE, DeLisi LE, Holcomb HH, et al. Dysfunction in a prefrontal substrate of sustained attention in schizophrenia. Life Sci. 1987;40:2031–9. doi: 10.1016/0024-3205(87)90295-5. [DOI] [PubMed] [Google Scholar]
- Cohen RM, Semple WE, Gross M, Nordahl TE, Holcomb HH, Dowling MS, et al. The effect of neuroleptics on dysfunction in a prefrontal substrate of sustained attention in schizophrenia. Life Sci. 1988;43:1141–50. doi: 10.1016/0024-3205(88)90473-0. [DOI] [PubMed] [Google Scholar]
- Cohen RM, Nordahl TE, Semple WE, Andreason P, Litman RE, Pickar D. The brain metabolic patterns of clozapine- and fluphenazine-treated patients with schizophrenia during a continuous performance task. Arch Gen Psychiatry. 1997;54:481–6. doi: 10.1001/archpsyc.1997.01830170107014. [DOI] [PubMed] [Google Scholar]
- Cohen R, Nordahl T, Semple W, Andreason P, Pickar D. Abnormalities in the distributed network of sustained attention predicts neuroleptic treatment response in schizophrenia. Neuropsychopharmacology. 1998a;19:35–47. doi: 10.1016/S0893-133X(97)00201-7. [DOI] [PubMed] [Google Scholar]
- Cohen RM, Nordahl TE, Semple WE, Andreason P, Pickar D. Abnormalities in the distributed network of sustained attention predict neuroleptic treatment response in schizophrenia. Neuropsychopharmacology. 1998b;19:36–47. doi: 10.1016/S0893-133X(97)00201-7. [DOI] [PubMed] [Google Scholar]
- Cornblatt BA, Lenzenweger MF, Dworkin RH, Erlenmeyer-Kimling L. Positive and negative schizophrenic symptoms, attention, and information processing. Schizophr Bull. 1985;11:397–408. doi: 10.1093/schbul/11.3.397. [DOI] [PubMed] [Google Scholar]
- Crespo-Facorro B, Paradiso S, Andreasen NC, O’Leary DS, Watkins GL, Boles Ponto LL, et al. Recalling word lists reveals ‘cognitive dysmetria’ in schizophrenia: a positron emission tomography study. Am J Psychiatry. 1999;156:386–92. doi: 10.1176/ajp.156.3.386. [DOI] [PubMed] [Google Scholar]
- Daniel DG, Goldberg TE, Weinberger DR, Kleinman JE, Pickar D, Lubick LJ, et al. Different side effect profiles of risperidone and clozapine in 20 patients with schizophrenia or schizoaffective disorder: a pilot study. Am J Psychiatry. 1996;153:417–9. doi: 10.1176/ajp.153.3.417. [DOI] [PubMed] [Google Scholar]
- Dehaene S, Artiges E, Naccache L, Martelli C, Viard A, Schurhoff F, et al. Conscious and subliminal conflicts in normal subjects and patients with schizophrenia: the role of the anterior cingulate. Proc Natl Acad Sci USA. 2003;100:13722–7. doi: 10.1073/pnas.2235214100. [DOI] [PMC free article] [PubMed] [Google Scholar]
- Eyler LT, Olsen RK, Jeste DV, Brown GG. Abnormal brain response of chronic schizophrenia patients despite normal performance during a visual vigilance task. Psychiatry Res. 2004;130:245–57. doi: 10.1016/j.pscychresns.2004.01.003. [DOI] [PubMed] [Google Scholar]
- Fletcher P, McKenna PJ, Friston KJ, Frith CD, Dolan RJ. Abnormal cingulate modulation of fronto-temporal connectivity in schizophrenia. Neuroimage. 1999;9:337–42. doi: 10.1006/nimg.1998.0411. [DOI] [PubMed] [Google Scholar]
- Friston KJ, Frith CD. Schizophrenia: a disconnection syndrome? Clin Neurosci. 1995;3:89–97. [PubMed] [Google Scholar]
- Friston KJ, Buechel C, Fink GR, Morris J, Rolls E, Dolan RJ. Psychophysiological and modulatory interactions in neuroimaging. Neuroimage. 1997;6:218–29. doi: 10.1006/nimg.1997.0291. [DOI] [PubMed] [Google Scholar]
- Goldberg G. Supplementary motor area: review and hypotheses. Behav Brain Sci. 1985;8:567–88. [Google Scholar]
- Goldberg TE, Greenberg RD, Griffin SJ, Gold JM, Kleinman JE, Pickar D, et al. The effects of clozapine on cognition and psychiatric symptoms in patients with schizophrenia. Br J Psychiatry. 1993;162:43–8. doi: 10.1192/bjp.162.1.43. [DOI] [PubMed] [Google Scholar]
- Goldstein JM, Goodman JM, Seidman LJ, Kennedy DN, Makris N, Lee H, et al. Cortical abnormalities in schizophrenia identified by structural magnetic resonance imaging. Arch Gen Psychiatry. 1999;56:537–47. doi: 10.1001/archpsyc.56.6.537. [DOI] [PubMed] [Google Scholar]
- Green DM, Swets JA. Signal detection theory and psychophysics. Wiley; New York: 1966. [Google Scholar]
- Grove WM, Lebow BS, Clementz BA, Cerri A, Medus C, Iacono WG. Familial prevalence and coaggregation of schizotypy indicators: a multitrait family study. J Abnorm Psychol. 1991;100:115–21. doi: 10.1037//0021-843x.100.2.115. [DOI] [PubMed] [Google Scholar]
- Hager F, Volz HP, Gaser C, Mentzel HJ, Kaiser WA, Sauer H. Challenging the anterior attentional system with a continuous performance task: a functional magnetic resonance imaging approach. Eur Arch Psychiatry Clin Neurosci. 1998;248:161–70. doi: 10.1007/s004060050034. [DOI] [PubMed] [Google Scholar]
- Hain C, Maier W, Klingler T, Franke P. Positive/negative symptomatology and experimental measures of attention in schizophrenic patients. Psychopathology. 1993;26:62–8. doi: 10.1159/000284801. [DOI] [PubMed] [Google Scholar]
- Heckers S, Weiss AP, Deckersbach T, Goff DC, Morecraft RJ, Bush G. Anterior cingulate cortex activation during cognitive interference in schizophrenia. Am J Psychiatry. 2004;161:707–15. doi: 10.1176/appi.ajp.161.4.707. [DOI] [PubMed] [Google Scholar]
- Hempel A, Hempel E, Schonknecht P, Stippich C, Schroder J. Impairment in basal limbic function in schizophrenia during affect recognition. Psychiatry Res. 2003;122:115–24. doi: 10.1016/s0925-4927(02)00126-9. [DOI] [PubMed] [Google Scholar]
- Hill KE, Mann L, Laws KR, Nimmo-Smith I, McKenna PJ. Hypofrontality in schizophrenia: a meta-analysis of functional imaging studies. Acta Psychiatr Scand. 2004;110:243–56. doi: 10.1111/j.1600-0447.2004.00376.x. [DOI] [PubMed] [Google Scholar]
- Hofer A, Weiss EM, Golaszewski SM, Siedentopf CM, Brinkhoff C, Kremser C, et al. An FMRI study of episodic encoding and recognition of words in patients with schizophrenia in remission. Am J Psychiatry. 2003;160:911–8. doi: 10.1176/appi.ajp.160.5.911. [DOI] [PubMed] [Google Scholar]
- Job D, Whalley H, McConnell S, Glabus M, Johnstone E, Lawrie S. Structural gray matter differences between first-episode schizophrenics and normal controls using voxel-based morphometry. Neuroimage. 2002;17:880. [PubMed] [Google Scholar]
- Johnstone EC, Frith CD. Validation of three dimensions of schizophrenic symptoms in a large unselected sample of patients. Psychol Med. 1996;26:669–79. doi: 10.1017/s0033291700037685. [DOI] [PubMed] [Google Scholar]
- Keefe RS, Silva SG, Perkins DO, Lieberman JA. The effects of atypical antipsychotic drugs on neurocognitive impairment in schizophrenia: a review and meta-analysis. Schizophr Bull. 1999;25:201–22. doi: 10.1093/oxfordjournals.schbul.a033374. [DOI] [PubMed] [Google Scholar]
- Keilp JG, Herrera J, Stritzke P, Cornblatt BA. The continuous performance test, identical pairs version (CPT-IP): III. Brain functioning during performance of numbers and shapes subtasks. Psychiatry Res. 1997;74:35–45. doi: 10.1016/s0925-4927(96)02881-8. [DOI] [PubMed] [Google Scholar]
- King DJ. The effects of neuroleptics on cognitive and psychomotor function. Br J Psychiatry. 1990;157:799–811. doi: 10.1192/bjp.157.6.799. [DOI] [PubMed] [Google Scholar]
- Laurens KR, Ngan ET, Bates AT, Kiehl KA, Liddle PF. Rostral anterior cingulate cortex dysfunction during error processing in schizophrenia. Brain. 2003;126:610–22. doi: 10.1093/brain/awg056. [DOI] [PubMed] [Google Scholar]
- Liu SK, Hwu HG, Chen WJ. Clinical symptom dimensions and deficits on the continuous performance test in schizophrenia. Schizophr Res. 1997;25:211–9. doi: 10.1016/s0920-9964(97)00026-1. [DOI] [PubMed] [Google Scholar]
- Liu SK, Chen WJ, Chang CJ, Lin HN. Effects of atypical neuroleptics on sustained attention deficits in schizophrenia: a trial of risperidone versus haloperidol. Neuropsychopharmacology. 2000;22:311–9. doi: 10.1016/S0893-133X(99)00137-2. [DOI] [PubMed] [Google Scholar]
- Luppino G, Matelli M, Camarda R, Rizzolati G. Cortico-cortical connections of area F3 (SMA-Proper) and area F (Pre-SMA) in the macaque monkey. J Comp Neurol. 1993;338:114–40. doi: 10.1002/cne.903380109. [DOI] [PubMed] [Google Scholar]
- Maldjian JA, Laurienti PJ, Kraft RA, Burdette JH. An automated method for neuroanatomic and cytoarchitectonic atlas-based interrogation of fMRI data sets. Neuroimage. 2003;19:1233–9. doi: 10.1016/s1053-8119(03)00169-1. [DOI] [PubMed] [Google Scholar]
- Mass R, Wolf K, Wagner M, Haasen C. Differential sustained attention/vigilance changes over time in schizophrenics and controls during a degraded stimulus continuous performance test. Eur Arch Psychiatry Clin Neurosci. 2000;250:24–30. doi: 10.1007/pl00007535. [DOI] [PubMed] [Google Scholar]
- Mathalon DH, Sullivan EV, Lim KO, Pfefferbaum A. Progressive brain volume changes and the clinical course of schizophrenia in men: a longitudinal magnetic resonance imaging study. Arch Gen Psychiatry. 2001;58:148–57. doi: 10.1001/archpsyc.58.2.148. [DOI] [PubMed] [Google Scholar]
- Mirsky AF, Yardley SL, Jones BP, Walsh D, Kendler KS. Analysis of the attention deficit in schizophrenia: a study of patients and their relatives in Ireland. J Psychiatr Res. 1995;29:23–42. doi: 10.1016/0022-3956(94)00041-o. [DOI] [PubMed] [Google Scholar]
- Mortimer AM. Cognitive function in schizophrenia: do neuroleptics make a difference? Pharmacol Biochem Behav. 1997;56:789–95. doi: 10.1016/s0091-3057(96)00425-x. [DOI] [PubMed] [Google Scholar]
- Nelson H. National adult reading test. NFER-Nelson Publishing Company Ltd.; New York: 1982. [Google Scholar]
- Nuechterlein KH, Parasuraman R, Jiang Q. Visual sustained attention: image degradation produces rapid sensitivity decrement over time. Science. 1983;220:327–9. doi: 10.1126/science.6836276. [DOI] [PubMed] [Google Scholar]
- Nuechterlein KH, Edell WS, Norris M, Dawson ME. Attentional vulnerability indicators, thought disorder, and negative symptoms. Schizophr Bull. 1986;12:408–26. doi: 10.1093/schbul/12.3.408. [DOI] [PubMed] [Google Scholar]
- Nuechterlein KH. Vigilance in schizophrenia and related disorders: neuropsychology, psychophysiology and information processing. In: Steinhauer SR, Gruzelier JH, Zubin J, editors. Handbook of schizophrenia. Vol. 5. Elsevier; Amsterdam: 1991. pp. 397–433. [Google Scholar]
- Ochsner KN, Kosslyn SM, Cosgrove GR, Cassem EH, Price BH, Nierenberg AA, et al. Deficits in visual cognition and attention following bilateral anterior cingulotomy. Neuropsychologia. 2001;39:219–30. doi: 10.1016/s0028-3932(00)00114-7. [DOI] [PubMed] [Google Scholar]
- Pandya DN, Van Hoesen GW, Mesulam MM. Efferent connections of the cingulate gyrus in the rhesus monkey. Exp Brain Res. 1981;42:319–30. doi: 10.1007/BF00237497. [DOI] [PubMed] [Google Scholar]
- Posner MI, Raichle M. Images of mind. Scientific American Books; Washington, DC: 1996. [Google Scholar]
- Potkin SG, Alva G, Fleming K, Anand R, Keator D, Carreon D, et al. A PET study of the pathophysiology of negative symptoms in schizophrenia. Positron emission tomography. Am J Psychiatry. 2002;159:227–37. doi: 10.1176/appi.ajp.159.2.227. [DOI] [PubMed] [Google Scholar]
- Pugh KR, Offywitz BA, Shaywitz SE, Fulbright RK, Byrd D, Skudlarski P, et al. Auditory selective attention: an fMRI investigation. Neuroimage. 1996;4:159–73. doi: 10.1006/nimg.1996.0067. [DOI] [PubMed] [Google Scholar]
- Quintana J, Wong T, Ortiz-Portillo E, Marder SR, Mazziotta JC. Anterior cingulate dysfunction during choice anticipation in schizophrenia. Psychiatry Res. 2004;132:117–30. doi: 10.1016/j.pscychresns.2004.06.005. [DOI] [PubMed] [Google Scholar]
- Ragland JD, Gur RC, Raz J, Schroeder L, Kohler CG, Smith RJ, et al. Effect of schizophrenia on frontotemporal activity during word encoding and recognition: a PET cerebral blood flow study. Am J Psychiatry. 2001;158:1114–25. doi: 10.1176/appi.ajp.158.7.1114. [DOI] [PMC free article] [PubMed] [Google Scholar]
- Roitman SE, Keefe RS, Harvey PD, Siever LJ, Mohs RC. Attentional and eye tracking deficits correlate with negative symptoms in schizophrenia. Schizophr Res. 1997;26:139–46. doi: 10.1016/s0920-9964(97)00044-3. [DOI] [PubMed] [Google Scholar]
- Roswold HE, Mirsky A, Sarason I, Bransome ED, Beck LH. A continuous performance test of brain damage. J Consult Psychol. 1956;20:343–50. doi: 10.1037/h0043220. [DOI] [PubMed] [Google Scholar]
- Rubia K. The dynamic approach to neurodevelopmental psychiatric disorders: use of fMRI combined with neuropsychology to elucidate the dynamics of psychiatric disorders, exemplified in ADHD and schizophrenia. Behav Brain Res. 2002;130:47–56. doi: 10.1016/s0166-4328(01)00437-5. [DOI] [PubMed] [Google Scholar]
- Rushworth MF, Walton ME, Kennerley SW, Bannerman DM. Action sets and decisions in the medial frontal cortex. Trends Cogn Sci. 2004;8:410–7. doi: 10.1016/j.tics.2004.07.009. [DOI] [PubMed] [Google Scholar]
- Salgado-Pineda P, Junque C, Vendrell P, Baeza I, Bargallo N, Falcon C, et al. Decreased cerebral activation during CPT performance: structural and functional deficits in schizophrenic patients. Neuroimage. 2004;21:840–7. doi: 10.1016/j.neuroimage.2003.10.027. [DOI] [PubMed] [Google Scholar]
- Sanfilipo M, Lafargue T, Rusinek H, Arena L, Loneragan C, Lautin A, et al. Volumetric measure of the frontal and temporal lobe regions in schizophrenia: relationship to negative symptoms. Arch Gen Psychiatry. 2000;57:471–80. doi: 10.1001/archpsyc.57.5.471. [DOI] [PubMed] [Google Scholar]
- Sanides F. Comparative architectonics of the neocortex of mammals and their evolutionary interpretation. Ann N Y Acad Sci. 1969;167:404–23. [Google Scholar]
- Schroeder J, Buchsbaum MS, Siegel BV, Geider FJ, Haier RJ, Lohr J, et al. Patterns of cortical activity in schizophrenia. Psychol Med. 1994;24:947–55. doi: 10.1017/s0033291700029032. [DOI] [PubMed] [Google Scholar]
- Schroder J, Buchsbaum MS, Siegel BV, Geider FJ, Lohr J, Tang C, et al. Cerebral metabolic activity correlates of subsyndromes in chronic schizophrenia. Schizophr Res. 1996;19:41–53. doi: 10.1016/0920-9964(95)00043-7. [DOI] [PubMed] [Google Scholar]
- Shapleske J, Rossell SL, Chitnis XA, Suckling J, Simmons A, Bullmore ET, et al. A computational morphometric MRI study of schizophrenia: effects of hallucinations. Cereb Cortex. 2002;12:1331–41. doi: 10.1093/cercor/12.12.1331. [DOI] [PubMed] [Google Scholar]
- Siegel BV, Jr, Buchsbaum MS, Bunney WE, Jr, Gottschalk LA, Haier RJ, Lohr JB, et al. Cortical-striatal-thalamic circuits and brain glucose metabolic activity in 70 unmedicated male schizophrenic patients. Am J Psychiatry. 1993;150:1325–36. doi: 10.1176/ajp.150.9.1325. [DOI] [PubMed] [Google Scholar]
- Siegel BV, Jr, Nuechterlein KH, Abel L, Wu JC, Buchsbaum MS. Glucose metabolic correlates of continuous performance test performance in adults with a history of infantile autism, schizophrenics, and controls. Schizophr Res. 1995;17:85–94. doi: 10.1016/0920-9964(95)00033-i. [DOI] [PubMed] [Google Scholar]
- Sigmundsson T, Suckling J, Maier M, Williams S, Bullmore E, Greenwood K, et al. Structural abnormalities in frontal, temporal, and limbic regions and interconnecting white matter tracts in schizophrenic patients with prominent negative symptoms. Am J Psychiatry. 2001;158:234–43. doi: 10.1176/appi.ajp.158.2.234. [DOI] [PubMed] [Google Scholar]
- Stark AK, Uylings HB, Sanz-Arigita E, Pakkenberg B. Glial cell loss in the anterior cingulate cortex, a subregion of the prefrontal cortex, in subjects with schizophrenia. Am J Psychiatry. 2004;161:882–8. doi: 10.1176/appi.ajp.161.5.882. [DOI] [PubMed] [Google Scholar]
- Stephan KE, Magnotta VA, White T, Arndt S, Flaum M, O’Leary DS, et al. Effects of olanzapine on cerebellar functional connectivity in schizophrenia measured by fMRI during a simple motor task. Psychol Med. 2001;31:1065–78. doi: 10.1017/s0033291701004330. [DOI] [PubMed] [Google Scholar]
- Stip E, Lussier I. The effect of risperidone on cognition in patients with schizophrenia. Can J Psychiatry. 1996;41(Suppl 2):S35–40. doi: 10.1177/070674379604100802. [DOI] [PubMed] [Google Scholar]
- Stuve TA, Friedman L, Jesberger JA, Gilmore GC, Strauss ME, Meltzer HY. The relationship between smooth pursuit performance, motor perception and sustained visual attention in patients with schizophrenia and normal controls. Psychol Med. 1997;27:143–52. doi: 10.1017/s0033291796004230. [DOI] [PubMed] [Google Scholar]
- Szeszko PR, Gunning-Dixon F, Goldman RS, Bates J, Ashtari M, Snyder PJ, et al. Lack of normal association between cerebellar volume and neuropsychological functions in first-episode schizophrenia. Am J Psychiatry. 2003;160:1884–7. doi: 10.1176/appi.ajp.160.10.1884. [DOI] [PubMed] [Google Scholar]
- Tamminga CA, Vogel M, Gao X, Lahti AC, Holcomb HH. The limbic cortex in schizophrenia: focus on the anterior cingulate. Brain Res Brain Res Rev. 2000;31:364–70. doi: 10.1016/s0165-0173(99)00053-3. [DOI] [PubMed] [Google Scholar]
- Tamminga CA, Lahti AC, Medoff DR, Gao XM, Holcomb HH. Evaluating glutamatergic transmission in schizophrenia. Ann N Y Acad Sci. 2003;1003:113–8. doi: 10.1196/annals.1300.062. [DOI] [PubMed] [Google Scholar]
- Thermenos HW, Seidman LJ, Breiter H, Goldstein JM, Goodman JM, Poldrack R, et al. Functional magnetic resonance imaging during auditory verbal working memory in nonpsychotic relatives of persons with schizophrenia: a pilot study. Biol Psychiatry. 2004;55:490–500. doi: 10.1016/j.biopsych.2003.11.014. [DOI] [PubMed] [Google Scholar]
- Todtenkopf MS, Vincent SL, Benes FM. A cross-study meta-analysis and three-dimensional comparison of cell counting in the anterior cingulate cortex of schizophrenic and bipolar brain. Schizophr Res. 2005;73:79–89. doi: 10.1016/j.schres.2004.08.018. [DOI] [PubMed] [Google Scholar]
- Tzourio-Mazoyer N, Landeau B, Papathanassiou D, Crivello F, Etard O, Delcroix N, et al. Automated anatomical labeling of activations in SPM using a macroscopic anatomical parcellation of the MNI MRI single-subject brain. Neuroimage. 2002;15:273–89. doi: 10.1006/nimg.2001.0978. [DOI] [PubMed] [Google Scholar]
- Velakoulis D, Wood SJ, Smith DJ, Soulsby B, Brewer W, Leeton L, et al. Increased duration of illness is associated with reduced volume in right medial temporal/anterior cingulate grey matter in patients with chronic schizophrenia. Schizophr Res. 2002;57:43–9. doi: 10.1016/s0920-9964(01)00307-3. [DOI] [PubMed] [Google Scholar]
- Volz H, Gaser C, Hager F, Rzanny R, Ponisch J, Mentzel H, et al. Decreased frontal activation in schizophrenics during stimulation with the continuous performance test—a functional magnetic resonance imaging study. Eur Psychiatry. 1999;14:17–24. doi: 10.1016/s0924-9338(99)80711-1. [DOI] [PubMed] [Google Scholar]
- Weiss EM, Golaszewski S, Mottaghy FM, Hofer A, Hausmann A, Kemmler G, et al. Brain activation patterns during a selective attention test—a functional MRI study in healthy volunteers and patients with schizophrenia. Psychiatry Res. 2003;123:1–15. doi: 10.1016/s0925-4927(03)00019-2. [DOI] [PubMed] [Google Scholar]
- Wiser AK, Andreasen NC, O’Leary DS, Watkins GL, Boles Ponto LL, Hichwa RD. Dysfunctional cortico-cerebellar circuits cause ‘cognitive dysmetria’ in schizophrenia. Neuroreport. 1998;9:1895–9. doi: 10.1097/00001756-199806010-00042. [DOI] [PubMed] [Google Scholar]
- Woo TU, Walsh JP, Benes FM. Density of glutamic acid decarboxylase 67 messenger RNA-containing neurons that express the N-methyl-D-aspartate receptor subunit NR2A in the anterior cingulate cortex in schizophrenia and bipolar disorder. Arch Gen Psychiatry. 2004;61:649–57. doi: 10.1001/archpsyc.61.7.649. [DOI] [PubMed] [Google Scholar]
- Yucel M, Volker C, Collie A, Maruff P, Danckert J, Velakoulis D, et al. Impairments of response conflict monitoring and resolution in schizophrenia. Psychol Med. 2002;32:1251–60. doi: 10.1017/s0033291702006128. [DOI] [PubMed] [Google Scholar]
- Zahn TP, Pickar D, Haier RJ. Effects of clozapine, fluphenazine and placebo on reaction time measures of attention and sensory dominance in schizophrenia. Schizophr Res. 1994;13:133–44. doi: 10.1016/0920-9964(94)90094-9. [DOI] [PubMed] [Google Scholar]