Abstract
This paper reports a novel method to track brain shift using a laser-range scanner (LRS) and nonrigid registration techniques. The LRS used in this paper is capable of generating textured point-clouds describing the surface geometry/intensity pattern of the brain as presented during cranial surgery. Using serial LRS acquisitions of the brain’s surface and two-dimensional (2–D) nonrigid image registration, we developed a method to track surface motion during neurosurgical procedures. A series of experiments devised to evaluate the performance of the developed shift-tracking protocol are reported. In a controlled, quantitative phantom experiment, the results demonstrate that the surface shift-tracking protocol is capable of resolving shift to an accuracy of approximately 1.6 mm given initial shifts on the order of 15 mm. Furthermore, in a preliminary in vivo case using the tracked LRS and an independent optical measurement system, the automatic protocol was able to reconstruct 50% of the brain shift with an accuracy of 3.7 mm while the manual measurement was able to reconstruct 77% with an accuracy of 2.1 mm. The results suggest that a LRS is an effective tool for tracking brain surface shift during neurosurgery.
Index Terms: Brain, deformation, image-guided surgery, mutual information, registration
I. Introduction
An active area of research in image-guided neurosurgery is the determination and compensation of brain shift during surgery. Reports have indicated that the brain is capable of deforming during surgery for a variety of reasons, including pharmacologic responses, gravity, edema, and pathology [1]–[3]. Studies examining the extent of deformation during surgery indicate that the brain can shift a centimeter or more and in a nonuniform fashion throughout the brain [4].
The nonrigid motion of the brain during surgery compromises the rigid-body assumptions of existing image-guided surgery systems and may reduce navigational accuracy. In an effort to provide consistent intraoperative tracking information, researchers have explored computational methods of shift compensation for surgery, also called model-updated image guided surgery (MUIGS) [5]–[7][8]–[11]. Typical MUIGS systems use a patient-specific preoperative model of the brain. During surgery, this model is used to deform the patient’s pre-operative image to provide a consistent mapping between the phyiscal-space of the OR and image-space. Invariably, a critical component of any MUIGS system is the accurate characterization of sparse1 intraoperative data that drives and constrains the patient-specific model. Possible sources of such data include intraoperative imaging (such as intraoperative ultrasound and intraoperative MR), tracked surgical probes, and surface acquisition methods [such as photogrammetry and laser-range scanning (LRS)]. Regardless of the method of acquisition, incorrect measurement of intraoperative sparse-data will generate inaccurate boundary conditions for the patient-specific computer model. As a result, the MUIGS approach to brain shift compensation could be compromised and lead to surgical navigation error. Therefore, it is critical to any MUIGS system that the method for intraoperative sparse-data acquisition be efficient and accurate.
Previous efforts have been made to characterize intraoperative brain position for shift measurement. An early method of shift assesment and correction was described by Kelly et al. in 1986 [12]. In that report, 5-mm-diameter stainless-steel balls were used in conjuction with projection radiographs to determine brain shift during surgery. All measurements and corrections in that paper were based on the qualitative assesment of the surgeon. Subsequent reports have demonstrated quantitative measurements of brain tissue location using framed and frameless stereotaxy. Nauta et al. used a framed stereotaxy system to track the motion of the brain and concluded that the brain tissue near the surgical area can move approximately 5 mm [13]. Dorward et al. used frameless stereotaxy to track both surface and deep tissue deformation of the brain and observed movements on the order of a centimeter near tumor margins in resection surgeries [14]. More recently, researchers have made whole-brain measurements of shift using intraoperative-MR systems [2]–[4] and have confirmed earlier findings regarding the degree of brain deformations during surgery. While these reports quantify the amount of shift, strategies to measure brain shift in real-time for surgical feedback have not been as forthcoming.
In previous work [15], textured LRS, or a LRS system that generates three-dimensional (3-D) intensity-encoded point cloud data, was shown to be an effective way to characterize the geometry and intensity properties of the intraoperative brain surface. A series of phantom and in vivo experiments investigated a novel, multimodal, image-to-patient rigid registration framework that used both brain surface geometry and intensity derived from LRS and magnetic resonance (MR) data. When compared to point-based and iterative closest point registration methods, textured LRS registration results demonstrated an improved accuracy with phantom and in vivo experiments. Similar to the work of Audette et al. [16], this work asserts that the brain surface during surgery can be used as a reference for registration. However, unlike others, the framework being developed here takes advantage of both geometric and visual/intensity information available on the brain surface during surgery.
In the work presented here, the use of LRS within neuro-surgery is extended to include a novel method to measure intraoperative brain surface shift in an automatic and rapid fashion. Specifically, the paper builds on previous work by employing a nonrigid registration method to provide correspondence between deformed serial textured-LRS data. Although the data acquired by the LRS system is a two-step process [i.e., scanning and texture mapping of a two-dimensional (2–D) image of the field of view (FOV)], the data can generate intensity-encoded point clouds that may be integrated with recent work investigating nonrigid point registration methods. Reports have demonstrated effective registration algorithms that provide nonrigid correspondence in featured point clouds using shape and other geometric attributes [17]–[21]. Although these approaches may be a viable avenue for accomplishing brain-shift tracking, an alternative strategy has been explored within this work that is particularly appropriate for the unique texture-mapping capability provided by the LRS system.
Detailed phantom studies and a preliminary in vivo case has been performed using data generated by LRS. An optical tracking system was used in the phantom and in vivo studies to provide an independent reference measurement system, to which results from the shift-tracking protocol were compared. While the number of reference points was limited for the single in vivo case, the results are encouraging.
II. Methods
A. LRS
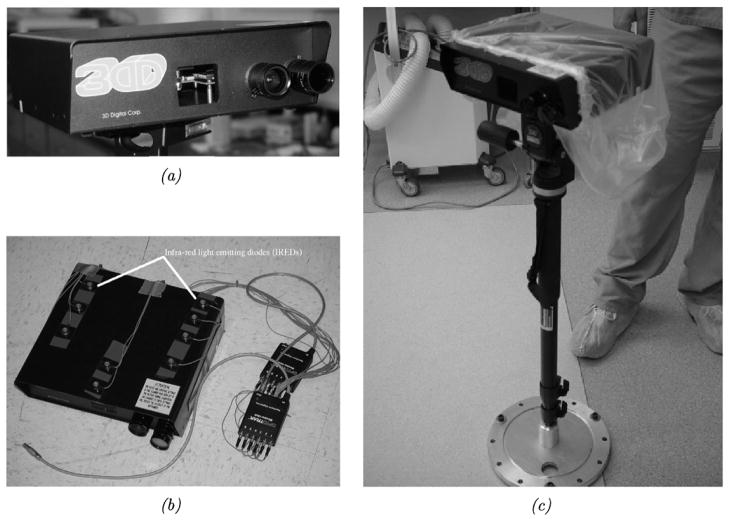
The LRS device used in this paper is a commercially available system (RealScanUSB 200, 3DDigital Inc., Bethel, CT), as shown in Fig. 1. The LRS device is capable of generating point clouds with an accuracy of 0.3 mm at a distance of 30 cm from the scanned object, with a resolution of approximately 0.5 mm. It should be noted that point-cloud accuracy and interpoint resolution degrade as the scanner is positioned further in depth from the surface of interest. It has been our experience with this particular LRS system that the device needs to be positioned between 30 to 60 cm from the cortical surface for acceptable data.2 For intraoperative scanning, the LRS device is capable of acquiring surface clouds with 40 000 to 50 000 points in the area of the craniotomy within approximately 10 s, while requiring an intraoperative footprint of approximately 0.1 m2. A detailed look at the LRS device and its scanning characteristics can be found in [22], [23], and [15].
Fig. 1.
RealScanUSB 200. (a) A close-up view of the scanner’s acquisition lenses. (b) The scanner out-fitted with infrared light emmitting diodes for physical-space tracking using the OPTOTRAK 3020 system. (c) The scanner mounted on a collapsable monopod mount for operating room use. The monopod can be extended to an elevation of approximately 5 ft and has standard yaw, pitch, and roll controls for LRS positioning.
To obtain absolute measurements of shift and shift-tracking error (STE), the scanner was modified by the attachment of 12 infrared light emitting diode (IRED) markers, as shown in Fig. 1. This arrangement of IRED markers represents an enhancement over previous IRED tracking strategies for the LRS device [22]. Standard software tools from Northern Digital Inc., in conjunction with a calibration phantom, were utilized to develop a transformation that relates textured-point clouds acquired in LRS-space to the physical-space as provided by an optical tracking system—OPTOTRAK 3020 (Northern Digital Inc., Waterloo, Ontario, Canada). Appendix A describes the registration process for relating the LRS- and physical-spaces. Having established a method to register the LRS-space to physical-space, the shift measurements for all phantom experiments provided by the shift-tracking protocol were correlated and verified using corresponding physical-space measurements provided by the OPTOTRAK system.
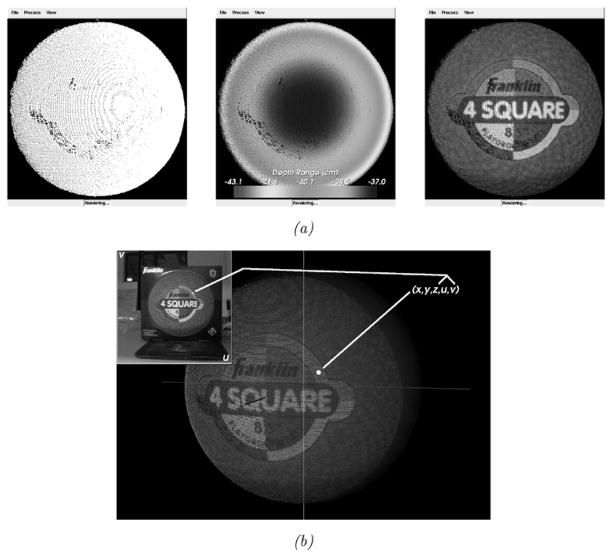
The scanner is capable of generating textured (intensity-encoded) point clouds of objects in its scanning FOV using a digital image acquired at the time of scanning. Using a calibration3 between scanner’s range and digital image spaces, each range point in the LRS device’s FOV is assigned texture-map coordinates [24] corresponding to locations in the digital image acquired at the time of scanning. Thus, the scanner reports five dimensions of data corresponding to (x, y, z) cartesian coordinates of locations in LRS-space and (u, v) texture-map coordinates of locations in texture-space (i.e., the digital image). Texture-mapping, or mapping of the texture image intensities to the corresponding locations in the point cloud, generates a textured point cloud of the scanner’s FOV. The data acquired by the scanner and texture-mapping process are shown in Fig. 2. The work in this paper builds on this unique data by taking full advantage of the geometry and intensity information to develop correspondence between serial LRS datasets. The protocol developed is fast, accurate, noncontact, and efficient for intraoperative use.
Fig. 2.
Different representations of data acquired by the LRS device and the texture mapping process. (a) From left to right, raw range points, range points colored according to their distance (in Z) from the origin of the scanning space, and the textured point cloud generated after texture-mapping. (b) A visualization of the texture mapping process.
B. Shift-Tracking Protocol
The context of the shift-tracking protocol can be defined as follows: consider an idealized system in which LRS is used to scan an object, the object then undergoes deformation, and LRS is used to acquire a serial (or sequential) range scan dataset of the object after deformation. The shift-tracking protocol, in this case, must determine homologous points and provide correspondence between them in the initial and serial range datasets using only the information in each LRS dataset. We hypothesize that providing correspondence between serial LRS textures is sufficient for determining the correspondence of their respective range data. If true, nonrigid alignment of 2-D serial texture images allows for the measurement of 3-D shifts of the brain surface.
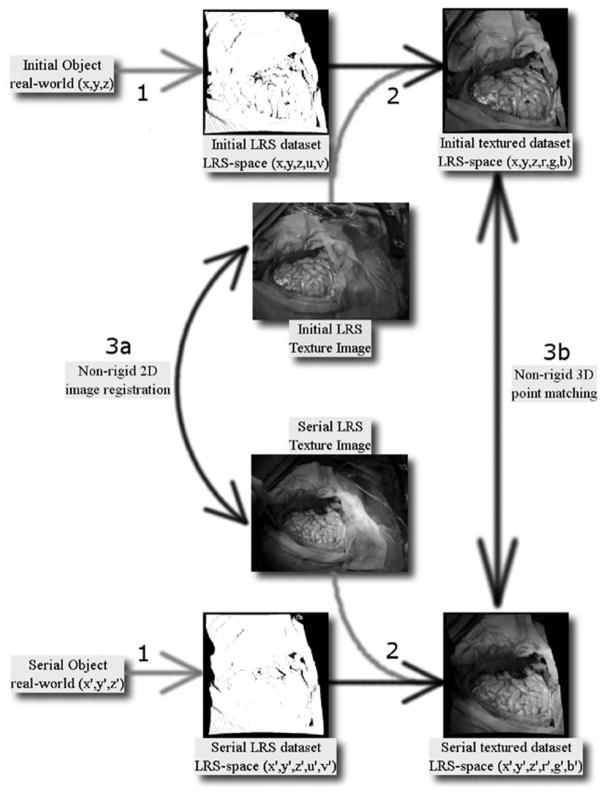
This approach to measuring brain shift marks a distinct departure from other nonrigid point matching methods. As opposed to a fully unconstrained 3-D nonrigid point matching method, the shift-tracking protocol is a multistep process whereby correspondence is ultimately provided via a 2-D nonrigid image registration method applied to the serial texture images acquired with each LRS scan (see Fig. 3). This approach has two distinct advantages: it simplifies the correspondence process greatly and minimizes the loss of information acquired by the LRS.
Fig. 3.
Conceptual representation of nonrigid point correspondence methods for the registration of textured LRS data. The three points of interest in this figure are highlighted with numbers. 1: Real world objects with continuous surface descriptions are discretized into the LRS datasets with information loss related to the resolution of the LRS system (represeted with the light gray arrow). 2: Incorporation of intensity information via texture mapping resulting in textured LRS dataset, this step incurs information loss related to the limited resolution of the spatial coordinates with respect to the texture image. 3: two methods to register textured LRS datasets, (a) nonrigid 2-D image registration and (b) nonrigid 3-D point matching.
The former advantage is readily realized since this framework reduces 3-D point correspondence to that of a 2-D image registration problem that is, arguably, not as demanding. The latter advantage is more subtle and only with careful analysis of the textured LRS process does it become apparent. The textured LRS process begins with the acquisition of a point-cloud by standard principles of laser/camera triangulation (labeled 1 in Fig. 3). At the conclusion of scanning, a digital image of the FOV is acquired and texture coordinates are assigned to the point-cloud data (labeled 2 in Fig. 3). It should be noted that the resolution of the point cloud is routinely coarser than the resolution of the digital image at the typical operating ranges for surgery. As a result, there are pixels within the digital image that do not have a corresponding range coordinate. Consequently, in the process of creating an intensity-encoded point cloud, some of the image data from the acquired digital image must be discarded. Although it may be possible to interpolate these points, they are not specifically acquired during the LRS process and the interpolation process becomes more difficult when considering the quality and consistency of data collected (i.e., specularity, edge-effects, and absorption variablities can leave considerable regions that are devoid of data). Hence, providing correspondence by nonrigidly registering the 2-D LRS texture images (labeled 3a in Fig. 3) prevents the loss of image information and simplifies the correspondence problem. The alternative is to process a 3-D textured point-cloud with a 3-D nonrigid point matching algorithm (labeled 3b in Fig. 3).
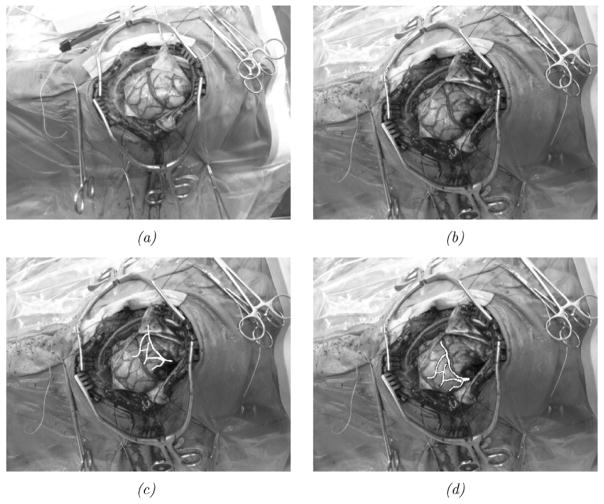
An important and central component of the shift-tracking protocol is the method of 2-D nonrigid image registration used to register serial texture images. While a variety of methods could be employed, we have utilized the adaptive bases algorithm (ABA) of Rohde et al. [25] to provide this registration. Briefly, the ABA registers two disparate images by maximizing the statistical dependence of corresponding pixels in each image using mutual information as a measure of dependence [26], [27]. Initial rigid alignment is provided between images using a multiscale, multiresolution mutual-information registration. The ABA then locally refines the rigid registration to account for nonrigid misalignment between the texture images. Image deformation in the ABA is provided by radial-basis functions (RBFs), whose coefficients are optimized for registration. The robustness and accuracy of the ABA on in vivo texture images from the LRS device has been explored and verified in Duay et al. [28] and an example registration of in vivo LRS texture images is shown in Fig. 4.
Fig. 4.
Results of the adaptive bases algorithm (ABA) on in vivo texture images. The top row shows initial and serial texture images taken intraoperatively. The second row shows registration results of vessels segmented from the initial texture to the serial image. (a) Initial in vivo texture image. (b) Serial in vivo texture image. (c) Vessels from initial texture image overlaid onto the serial texture image. (d) Vessels from initial texture registered to serial texture using ABA deformation field.
The remaining steps in the shift-tracking protocol prescribe a method by which one can transform an independent point-of-interest (POI) from the initial LRS-space, through the initial texture-space, into the serial texture-space, and finally back into the serial LRS-space. These steps are critical for the protocol as they provide a method to track the shift of novel POIs from one LRS-space to a serial LRS-space. In this paper, the novel POIs are usually provided by the optical tracking system. Transforming these POIs from physical-space to LRS-space does not, in general, align the POIs with preexisting LRS acquired points. Thus, the POIs generally do not have the full five dimensions of data as the points provided by LRS, and a system to provide continuous transformations between LRS-space and texture-spaces is needed. A schematic of these steps and the transformations used between steps is shown in Fig. 5.
Fig. 5.

Schematic describing the shift-tracking protocol used in this paper. Protocol transformations are indicated and referred to in the text with letters. POI is a point of interest that exists in both initial and serial LRS datasets. The overall goal of the shift-tracking protocol in this paper is to resolve the “calculated shift” of POIs from one LRS dataset to a serial LRS dataset.
Suppose a POI has been acquired with the optical tracking system and transformed into the initial LRS-space. For shift tracking, the POI is then projected from its geometric location (x, y, z) to its texture location (u, v) using a projection transformation Ta in Fig. 5. The transformation used for this projection is derived using the direct linear transformation algorithm (DLT) [29]. The DLT uses at least eight geometric fiducials X̄i = (xi, yi, zi), and their corresponding texture coordinates ūi = (ui, vi), to calculate 11 projection parameters [30], which can be used to map X̄ to ū as follows:
| (1) |
| (2) |
where Δui and Δvi are the point specific correction parameters for radial lens and decentering distortions and li with i = 12, …, 11 being the DLT transformation parameters.
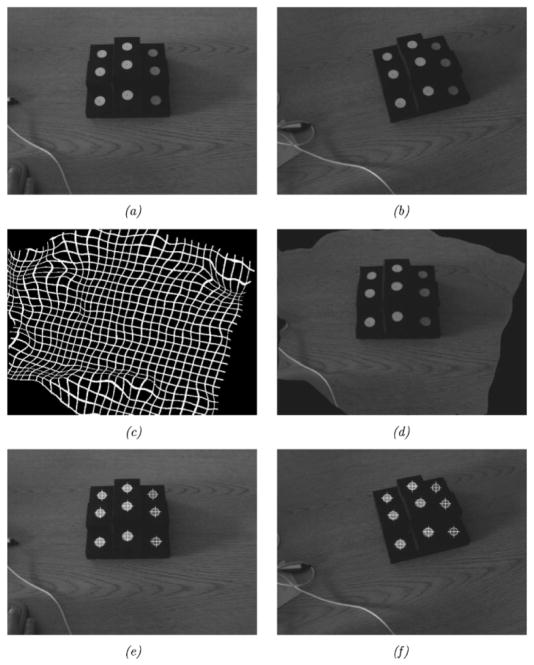
From the initial texture space, the POI is transformed into serial texture images using the deformation field provided via the ABA (denoted Tb in Fig. 5). This transformation takes the initial texture coordinates, (u, v), and results in serial texture coordinates, (u′, v′). Fig. 6, demonstrates the transformation of fiducials from an initial texture image to a serial texture image using the deformation field provided by the ABA registration.
Fig. 6.
This figure demonstrates the transformation of targets from an initial texture image to a serial image. The top row, left to right, shows the initial (fixed) and final (moving) textures. The middle row, left to right, shows the deformation field calculated via ABA registration on a reference grid and the result of registering the serial texture using the deformation field. The bottom row, left to right, demonstrates the locations of the targets in the initial texture image and the corresponding locations in the serial image found using the ABA deformation field. (a) Fixed image. (b) Moving image. (c) Deformation field. (d) Moving image registered to fixed. (e) Fiducials in initial texture. (f) Fiducials in serial texture.
Finally, Tc, in Fig. 5, provides a method to transform serial texture coordinates (u′, v′) back into serial LRS-space (x′, y′, z′). This mapping is the inverse to Ta, however, since reconstruction of 3-D points from the perspective transformation parameters requires at least two independent texture images of the same FOV, the transformation cannot be used for the reprojection. Instead, a series of B-spline interpolants are used to approximate the transformation from texture-space to LRS-space. The FITPACK package by Paul Dierckx (www.netlib.org/dierckx) uses a B-spline formulation and a nonlinear optimization system to generate knot vectors and control point coefficients automatically for a spline surface of a given degree. The Dierckx algorithm also balances the smoothness of the fitted surface against the closeness of fit [31]. The FITPACK library is used to fit three spline interpolants, one for x, y, and z, which provides a continuous transformation of texture space coordinates projected to LRS space
| (3) |
where sx(u, v), sy(u, v), and sz(u, v) are spline interpolants for x, y, and z, respectively. Experiments not reported here indicated that biquadratic splines provided low interpolation errors while providing generally smooth surfaces. For in vivo datasets acquired by the LRS, the mean root mean square (rms) fitting error (i.e., the Euclidean distance between fitted point and actual point) is 0.05 mm over 15 datasets. In general, the spline interpolants sx(u, v) and sy(u, v) used 6–9 knots in u and v; sz(u, v) provided adequate interpolation using approximately 25 knots in u and v.
The composition of these three transformation steps provides a global transformation, TST (see (4)), for the shift of a POI from initial to serial range datasets.
| (4) |
where X̃′ is the calculated location of a point X that has undergone some shift. Results from TST operating on POIs in the initial LRS dataset were compared against optical localizations of POIs in serial LRS datasets for determining shift-tracking accuracy. The OPTOTRAK and stylus used for point digitization had an accuracy of 0.3 mm and served as a reference measurement system.
C. Experiments
1) Phantom
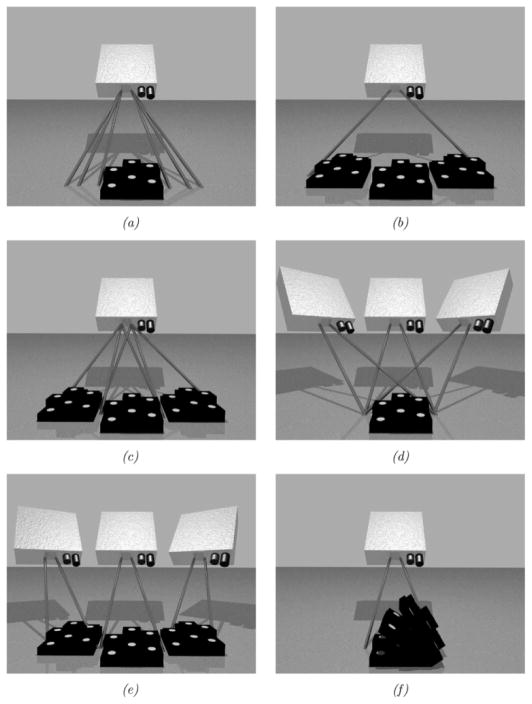
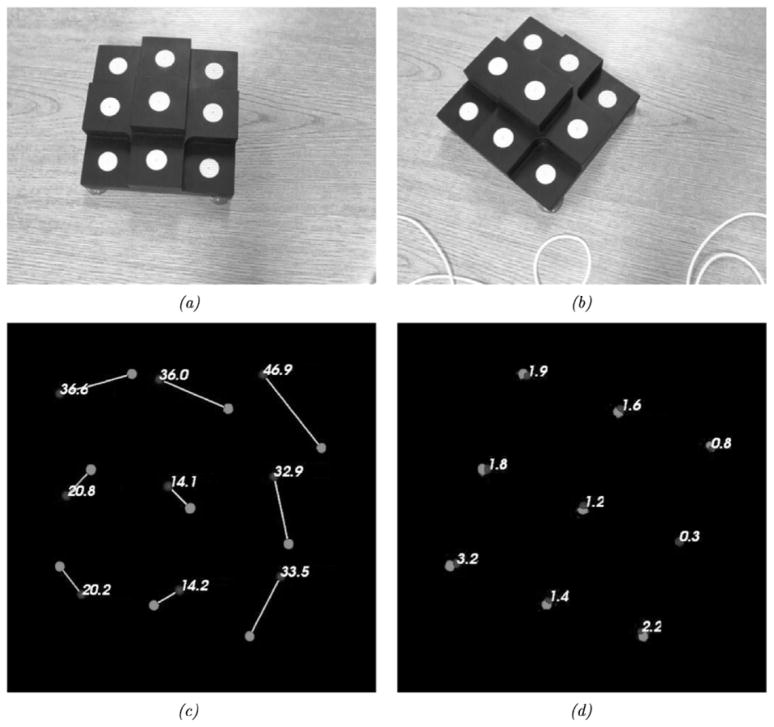
A series of phantom experiments were conducted to quantify the fidelity of the framework with respect to rigid, perspective, and nonrigid target movement. Fig. 7 is a visual representation of the experiments performed to ascertain the effects of rigid movement on the tracking framework developed. These experiments specifically tested the effects of: (a) LRS scanning extents—which affect the LRS dataset resolution, (b) target position changes within a full scanning extent, (c) target position changes with focused scanning extents, (d) LRS pose changes with stationary target, (e) target pose changes with a moving LRS, and (f) changing the incidence angle of the laser with respect to the texture mapping process. For each scenario in Fig. 7, the centroid of the white disks could act as a point target since it could be accurately digitized by both an independent optically tracked pen-probe and tracked LRS. In each experiment, an initial scan was acquired and used for calibration (see Appendix A). Subsequent scans used the calibration transform from the initial scan to transform LRS-space points into physical-space. Tracking accuracy was estimated using the target registration error [TRE, see (5)] of novel4 targets acquired by the optical tracking system and novel targets acquired by the LRS (transformed into physical-space) [32]–[35].
Fig. 7.
The different rigid-body tracking experiments performed to evaluate tracking capabilities of the experimental setup. (a) Tracking accuracy given varying scanning extents. (b) Tracking accuracy given a moving phantom in full extents. (c) Tracking accuracy given a moving phantom and focused extents. (d) Tracking accuracy given camera pose changes and a stationary phantom. (e) Tracking accuracy given camera and phantom pose changes. (f) Tracking accuracy given various scanning incidence angles.
| (5) |
where X′ and X are corresponding points in different reference frames, and T() is a transformation from Xs to X’s reference frame.
For the experiment outlined in Fig. 7(a), the laser scanning extents ranged between 17 and 35 cm. In Fig. 7(b) and (c), the phantom was positioned in a rectangular area of approximately 35 × 15 cm corresponding to the full scanning extent of the LRS. In experiment Fig. 7(d) the centroid of the LRS system was translated a minimum of 4.1 cm and a maximum of 12.1 cm, which is estimated to be the intraoperative range of motion for the LRS device. Fig. 7(f) illustrates a special tracking experiment aimed at ascertaining the fidelity of the texture mapping process of the scanner. For each scan in experiment Fig. 7(f), the physical-space localizations were transformed into LRS-space and then into texture-space using the standard perspective transformation. In texture space, the disk centroids were localized via simple image processing and region growing5. Corresponding transformed physical-space fiducial locations were compared against the texture space localizations to measure the accuracy of the texture mapping and projection processes for objects scanned at increasingly oblique angles to the plane normal to the scanner’s FOV.
After determining the accuracy of the rigid tracking problem, we then determined the shift-tracking accuracy of the protocol for situations in which the shift was induced using perspective transformations (i.e., the effect of 3-D translation and rotation, and perspective changes related to projecting the 3-D scene on to the 2-D texture image). The first series of experiments examined the results of the shift-tracking protocol on the experiments shown in Fig. 7. Although the experimental setup of the LRS acquisitions mimicked the previous rigid-body tracking experiments, it is important to note that the shift-tracking protocol, i.e., TST from (4), is used to determine the target’s transformation from the initial to the serial LRS dataset for these experiments. Since these experiments used a rigid tracking phantom and rigid-body motions of the LRS device and phantom, they provided a method to quantitatively examine the shift-tracking protocol in resolving perspective changes between the initial and serial LRS textures. Target shifts were calculated using the shift-tracking protocol and compared against shift measurements provided by the optical tracking system. RMS STE, as defined in (6), was used to quantify the accuracy of the shift-tracking protocol.
| (6) |
where is the shifted location of a point Xi as reported by the optical localization system and TST is defined in (4).
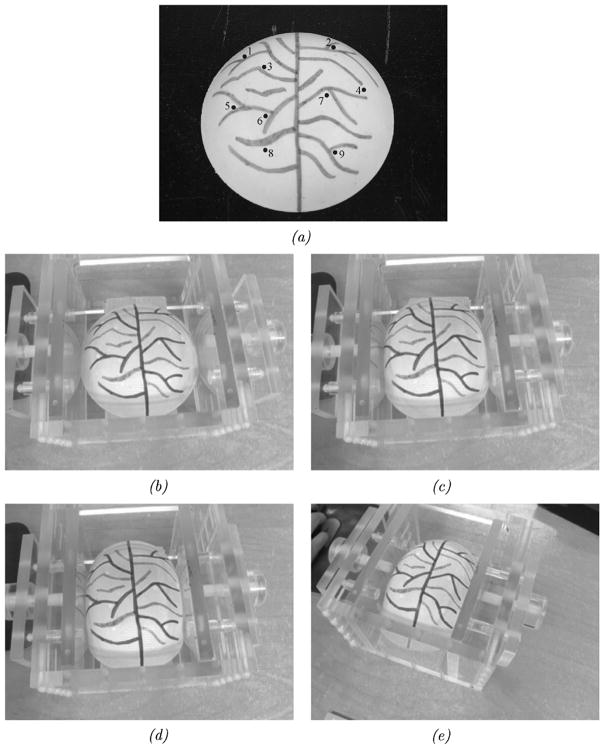
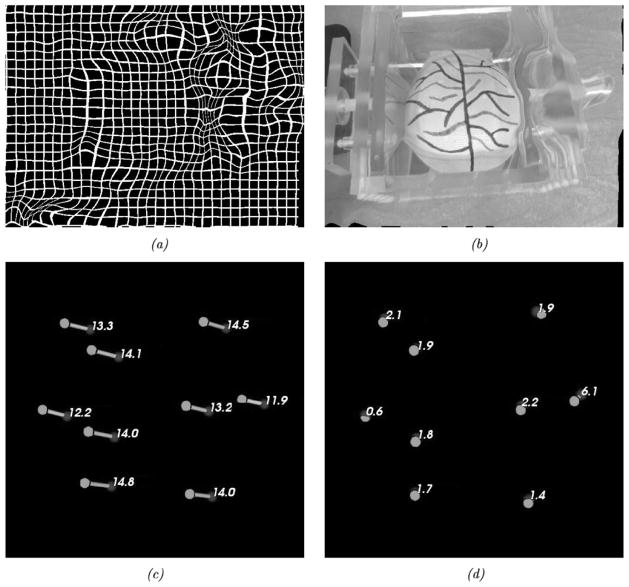
In a subsequent set of experiments, a nonrigid phantom was used to ascertain the performance of the shift-tracking protocol in an aggregate perspective/nonrigid deformation system. A compression device and pliant phantom [see Fig. 8(a)] were used in this series of experiments. The phantom was made of a rubber-like polymer (Evergreen 10, Smooth-On, Inc., Easton, PA). The surface of the phantom was designed to simulate the vascular pattern of the brain during surgery (a permanent marker was used to generate vessels). The compression device permits controlled compression of the phantom. For the tracking experiments, the phantom was scanned under minimal (or no) compression, then with compression from one side of approximately 5 cm and, finally, with compression of 5 cm from both sides. Target vessel bifurcations and features on the phantom were marked optically at each compression stage. Reproducibility of the markings was found to have a standard deviation of approximately 0.5 mm. The accuracy of the shift-tracking protocol was determined by the STE of the target points. The last experiment examined the accuracy of the shift-tracking protocol in situations with both perspective and nonrigid changes in the surface. For this, the deformable phantom was scanned using a novel camera pose while under two-sided compression. Fig. 8(b)–(e) demonstrates the four poses used to determine the accuracy of the shift-tracking protocol.
Fig. 8.
Shift tracking phantom and the various compression levels and positions for LRS acquisition. (a) Shift tracking phantom and targets. (b) Uncopreseed. (c) One-sided compression, from the right. (d) Two-sided compression. (e) Two-sided compression w/perspective change in the texture image (related to change in the LRS position during scanning).
2) Preliminary In Vivo Data
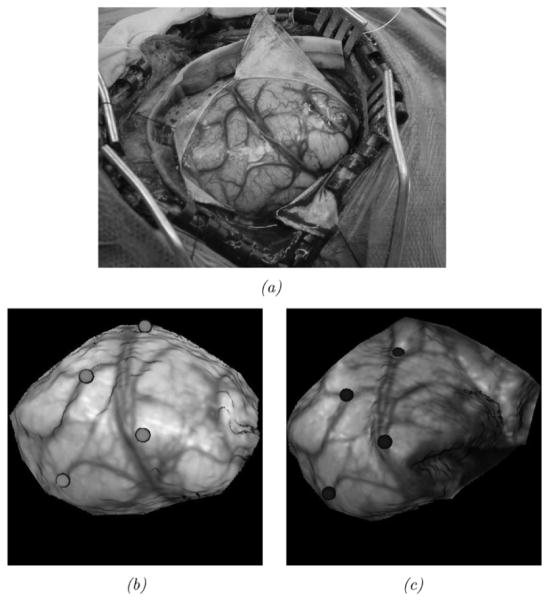
In addition to phantom experiments, a preliminary experience with the shift-tracking protocol is reported for a human patient. For this case, the optically tracked LRS system was deployed into the OR. In addition, an optically tracked stylus was also present and both were registered to a common coordinate reference. Upon duratomy, the tracked LRS unit was brought into position and a scan was taken. Immediately following the scan, cortical features were identified by the surgeon (vessel bifurcations and sulcal gyri) and marked with the optically tracked stylus. After tumor resection, the process was repeated whereby the surgeon marked the same points with the stylus. With this data, three separate measurements of the shift can be performed by: 1) OPTOTRAK points before and after the shift; 2) manual delineation of the same points on the LRS data before and after shift; and 3) applying the shift-tracking protocol. Since both the LRS and the stylus are registered in the same coordinate reference, all of these methods are directly related. In the case of manual LRS delineation of points, there may be some localization subjectivity in the determination of points within the postshift LRS data. To qualify this, a study of interuser reproducibility for point localization in LRS datasets was found to be 1.0 ± 0.29 mm6. By measuring the positional shift of these targets points before and after resection, a 3-D vector of brain deformation can be determined in all three sets (i.e., OPTOTRAK, manual LRS, and shift-tracking protocol point measurements) independently and compared. A view of the surgical area, texture images of the scanning FOV, and the manually localized landmarks for this experiment are shown in Fig. 9.
Fig. 9.
In vivo data. The top image (a) demonstrates the surgical FOV as captured by a digital camera. Intraoperative textured LRS datasets before (b) and after (c) resection with OPTOTRAK targets highlighted using color spheres: brighter spheres indicate the presection targets, and darker spheres indicate the postresection targets.
III. Results
The calculated rigid-body description of the IRED pattern on the LRS device demonstrated an accuracy of 0.5-mm rms fitting error using seven static views of the IRED orientations. The fitting error was on the order of the accuracy of the OPTOTRAK 3020 optical tracking system7, which suggests that the scanner’s rigid-body was created accurately.
Thirty-three calibration registrations of the phantom in Fig. 13 generated an average rms fiducial registration error (FRE) of 0.70 ± 0.14 mm. These results indicated that the LRS device and optical tracking system can be registered to each other with an accuracy that allows for meaningful assessment of the accuracy of the shift-tracking protocol.
Fig. 13.
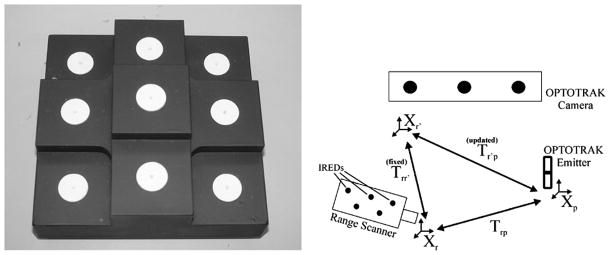
Registration phantom and process used to align LRS-space to physical-space. On the left is the registration phantom used to register LRS-space to physical-space. On the right is a figure outlining the registration process used to register LRS-space to physical-space.
The results of the rigid tracking experiments are categorized and reported in Table I according to the experiment types shown in Fig. 7.
TABLE I.
Target Registration Errors According for Rigid-Body Tracking Experiments Outlined in Fig. 7.
| Experiment Type | Mean RMS FRE | Mean RMS TRE |
|---|---|---|
| n=number of poses examined | ||
|
| ||
| a: varying extents | 0.62±0.10 (n=4) | 0.95±0.22 (n=12) |
| b: varying phantom position | 0.74±0.23 (n=4) | 1.63±0.49 (n=12) |
| c: focused extents, varying phantom position | 0.57±0.05 (n=4) | 1.20±0.32 (n=12) |
| d: varying camera position | 0.54±0.04 (n=3) | 1.29±0.44 (n=6) |
| e: varying camera and phantom position | 0.79±0.08 (n=4) | 0.94±0.14 (n=12) |
n Indicates the Number of LRS and OPTOTRAK Acquisitions Used to Generate the Mean Value Reported. The Mean rms FRE Describes the Accuracy With Which the Calibration Between Physical-Space and LRS Was Generated. The Mean rms TRE Represents the Tracking Accuracy of Targets Acquired by the LRS and OPTOTRAK Independently of the Calibration Scans
The low mean rms TREs verified that the LRS tracking system is capable of resolving and tracking physical points accurately and precisely. An interesting observation from these results is the increased tracking accuracy when using focused scanning extents as compared to the full scanning extents [see results from Experiments (b) and (c) of Table I]. In light of this fact, only focused extents were used for each range scan acquisition in the shift-tracking experiments.
Shift tracking results of the rigid-body calibration phantom in the perspective registration experiments produced an average rms STE of 1.72 ± 0.39 mm in nine trials. A sample of the results from the pose shift-tracking experiments is shown in Fig. 10.
Fig. 10.
Example perspective STE and results. The top row shows the initial and serial positions of the phantom and scanning FOV. The bottom row shows the initial shift vectors and the error vectors for the shift calculated via shift-tracking protocol. (a) Initial position. (b) Camera pose and phantom position change. (c) Induced shift vectors observed via optical tracking system. (d) STE vectors produced from shift-tracking protocol.
Shift tracking results for the nonrigid phantom provided encouraging results. Table II highlights the rms STE for target landmarks at each compression stage of the nonrigid STE while Fig. 11 demonstrates the shift vectors and results from the one-sided compression experiment.
TABLE II.
Induced Shift Magnitudes and Shift Tracking Errors (STEs) for the Target Points on the Non-Rigid Phantom.
| Target Point Number | Compression Type
|
||||||||
|---|---|---|---|---|---|---|---|---|---|
| One-sided | Two-sided | Two-sided w/pose change | |||||||
|
| |||||||||
| Shift | STE | Θ | Shift | STE | Θ | Shift | STE | Θ | |
|
| |||||||||
| 1 | 13.31 | 2.17 | 0.13 | 13.84 | 1.99 | 0.19 | 13.42 | 10.41 | 0.42 |
| 2 | 14.50 | 1.99 | 0.13 | 17.38 | 2.28 | 0.08 | 16.47 | 4.90 | 0.12 |
| 3 | 14.11 | 1.93 | 0.09 | 15.87 | 1.21 | 0.04 | 15.45 | 1.67 | 0.06 |
| 4 | 11.98 | 6.11 | 0.23 | 10.26 | 6.04 | 0.00 | 9.57 | 18.14 | 0.33 |
| 5 | 12.26 | 0.66 | 0.06 | 10.65 | 1.76 | 0.13 | 11.21 | 8.99 | 0.60 |
| 6 | 14.07 | 1.87 | 0.11 | 15.47 | 1.80 | 0.08 | 15.82 | 1.20 | 0.00 |
| 7 | 13.25 | 2.27 | 0.13 | 14.39 | 1.08 | 0.00 | 14.20 | 1.55 | 0.08 |
| 8 | 14.81 | 1.70 | 0.09 | 17.82 | 1.00 | 0.04 | 17.89 | 1.60 | 0.08 |
| 9 | 14.08 | 1.46 | 0.09 | 15.77 | 1.37 | 0.08 | 15.34 | 1.46 | 0.09 |
All Shift Measurements and Angles Are Reported in Millimeters, and Radians, Respectively. The Shift Column Describes the Total Shift of the Target Point. The STE Column Describes the Shift Tracking Error of Protocol on This Point. The Θ Column Describes the Deviation of the Calculated Shift Vector From the Measured Shift Vector. A Perfect Tracking Would Produce Low STEs and Θs
Fig. 11.
Results from the nonrigid, one-sided compression STE. (a) One-sided compression deformation field. (b) One-sided compression registered image. (c) One-sided compression induced shift vectors. (d) One-sided compression shift tracking error vectors.
From Table II, one can see that the protocol is capable of rms STEs of 2.7, 2.5, and 7.8 mm for the 1-sided, 2-sided, and 2-sided with perspective change experiments, respectively; while preserving the directionality of the the shift vectors. There are, however, some outliers in each experiment which require closer examination. In the one-sided and two-sided compression experiments (with minimal perspective changes in the textures) target point 4 experienced increased STE and according to the Grubb’s test [36] was identified as a statistical outlier in the results. The aberrant result is most likely due to point 4’s location near the periphery of the scanning FOV. During compression this point was obscured from scanning and therefore was not accurately registered. Removing point 4 and calculating the rms STE for the remaining 8 points yielded a result of 1.8 and 1.6 mm for the one-sided and two-sided compression experiments, respectively. Similar results can be seen in the two-sided compression with perspective change. Points 1, 4, and 5 all displayed atypical results for this experiment. Examination of the LRS datasets showed that those points were occluded during the scanning process and therefore were not registered correctly. Removing these points from the rms STE calculation resulted in a accuracy of 2.4 mm. Factoring in the overall rigid-body and perspective tracking accuracies into the STEs seen in the nonrigid shift-tracking experiments imply that the shift-tracking protocol may in fact be determining shift to approximately 1.5- to 2-mm error. The increased errors seen in the nonrigid experiments were likely due to larger localization errors in the target points on the surface of the phantom. This observation is supported by the tracking results reported from the previous series of perspective shift-tracking experiments using the rigid tracking object.
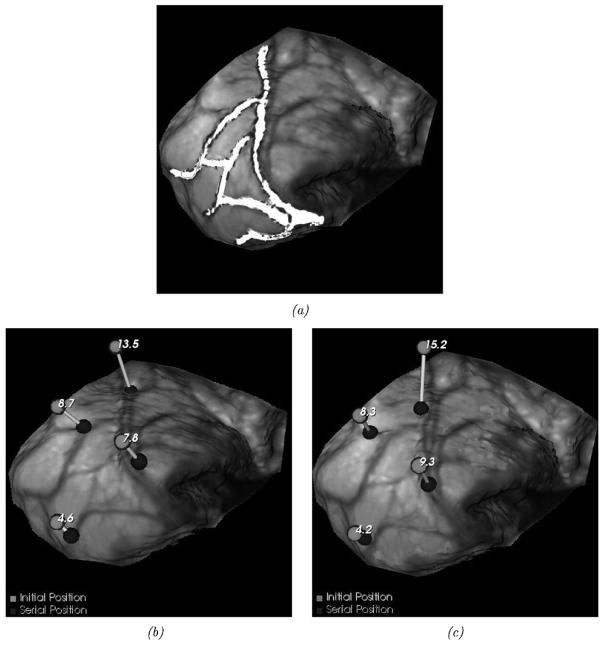
The in vivo dataset results demonstrate the potential for using LRS in tracking brain shift automatically. Fig. 9 demonstrates the fidelity with which data can be acquired and registered in a common coordinate system using the two tracked digitizers, i.e., points in Fig. 9, acquired by the stylus, reside on the LRS acquired surface. Fig. 12 visually demonstrates the results of shift measurements as performed with our shift-tracking protocol as compared to the OPTOTRAK measurements. Fig. 12(a) demonstrates the alignment of a set of contours extracted from the preshift LRS dataset to those of the postshift LRS data under the guidance of our shift-tracking protocol. Fig. 12(b)–(c) shows the measurement of shift at four distinct points as performed by OPTOTRAK and the shift-tracking protocol, respectively. Table III reports a more quantitative comparison with the addition of shift measurements as conducted by manually digitizing points on the pre- and postshift LRS datasets.
Fig. 12.
In vivo shift-tracking results. (a) ABA-registered contours mapped to the postresection intraoperative textured LRS dataset. (b) Postresection LRS dataset with initial and serial OPTOTRAK shift measurements. (c) is similar to (b), but demonstrates shift vectors calculated using the shift-tracking protocol. The numbers near the brighter spheres in (b) and (c) represent the magnitude of the corresponding shift vector given in millimeters. (a) ABA-registered contours. (b) OPTOTRAK shift-localization. (c) Calculated shift-localization.
TABLE III.
In Vivo Shift Tracking Results.
| Target Point | Brain shift measurements
|
||||||
|---|---|---|---|---|---|---|---|
| OPTOTRAK | Shift tracking | Manual | |||||
| Calc. | STE | Θ | Calc. | STE | Θ | ||
|
| |||||||
| 1 | 13.5 | 15.2 | 9.5 | 0.67 | 13.2 | 1.8 | 0.13 |
| 2 | 8.7 | 8.3 | 4.9 | 0.59 | 8.8 | 1.3 | 0.14 |
| 3 | 7.8 | 9.3 | 3.1 | 0.32 | 10.0 | 3.2 | 0.27 |
| 4 | 4.6 | 4.2 | 2.8 | 0.63 | 5.6 | 1.4 | 0.21 |
|
| |||||||
| RMS | 9.2 | 10.5 | 5.7 | 0.57 | 9.8 | 2.1 | 0.20 |
| RMS w/o Target #1 | 7.3 | 7.6 | 3.7 | 0.53 | 8.3 | 2.2 | 0.21 |
There Were Four Targets Acquired During Surgery, They Are Listed Row-Wise. For Each Target, a Shift Measurement Was Made Using the OPTOTRAK, the Shift-Tracking Protocol and Also Via Manual Localization of Targets on the Serial LRS Dataset. Magnitudes for These Shift Vectors Are Shown in Columns 2, 3, and 6 for OPTORAK, the Shift-Tracking Protocol, and Manual Localization, Respectively. Columns 4 and 5 Relate the Performance of the Shift-Tracking Protocol Relative to the OPTOTRAK Using STE and Θ Angle Deviation, Respectively. Columns 7 and 8 Relate the Performance of Manual Localization of Shift Targets Relative to OPTOTRAK Measurements Using STE and Θ, Respectively. The Last Two Rows of the Table List the rms Measurements With and Without Target Point #1. This Point Was Identified as an Outlier in Post-Processing
IV. Discussion
Figs. 1 and 2 illustrate the experimental setup and unique data provided by the laser-range scanner. Fig. 1 illustrates the minimal impact that the LRS system has to the OR environment while Fig. 2 shows the multidimensional data provided by the unit (x, y, z, u, and v). In some sense, the data generated represents four distinct dimensions: Cartesian coordinates and texture (as characterize by an RGB image of the FOV). Compared to other LRS work for intraoperative data acquisition [37], the inclusion of texture is particularly important. More specifically, capturing spatially correlated brain texture information allows the development of novel alignment and measurement strategies that can take advantage of the feature-rich brain surface routinely presented during surgery. In previous work [15], these feature-rich LRS data sets were used in a novel patient-to-image registration framework. The work presented here extends that effort by establishing a novel measurement system for nonrigid brain motion. As a result, a significant advancement in establishing quantitative relationships between high-resolution preoperative MRI and/or CT data and the exposed brain during surgery has been provided by this LRS-brain imaging platform. The methods described in this paper can also be used with data provided by other intraoperative brain surface acquisition methods that can generate texture-mapped point-clouds (i.e., binocular photogrammetry) [21], [7], [20].
Figs. 3–6 and (4) represent this novel approach to measuring cortical surface shifts within the OR environment. The method greatly simplifies the measurement of 3-D brain shifts by using advanced methods in deformable 2-D image registration (e.g., Fig. 4) and standard principles of computer vision (i.e., the standard perspective transformation). In addition, the shift-tracking framework maximizes the information acquired from this particular LRS system by directly determining correspondence using the acquired texture images of the FOV rather than establishing correspondence using coarser textured point clouds. This approach is illustrated, within the context of rigid-body motion, in Fig. 6. In this image series, shift is induced by a pose change of the phantom (i.e., rigid body movement). The resulting rigid-body change is captured by the stationary LRS as a perspective change in the digital images of the FOV. The ABA accounts for these changes nonrigidly and yields encouraging results with respect to specific targets, i.e., the centroids of the white disks.
To quantify the effects of perspective changes on the ability to track shift (e.g., Fig. 6), a series of experiments were proposed and shown in Fig. 7. Fig. 10 is an example of a typical result from one of these experiments and demonstrates the marked ability to recover rigid movement of the targets of 28.4 ± 11.4 mm with an error of 1.6 ±0.8 mm, on average. Table I reports the full details of these experiments that investigated changes in LRS device pose and target positions. Interestingly, a target localized central to the LRS extents produces the best results (Fig. 7(a) and (b) with corresponding TREs from Table I). This is in contrast to the results observed from the experiment described by Fig. 7(b). In experiments presented elsewhere [22], there has been some indication than an increased radial distortion occurs in the periphery of the LRS scanning extents. This would suggest that placing the target central to the extents is an important operational procedure for shift tracking. However, in our experience, the ability to place the brain surface central to the extents has been relatively easy within the OR environment and is not a limiting factor. In Fig. 7(f), the fidelity of the texture mapping process is tested by scanning at increasingly oblique angles to the scanner’s FOV normal. In experiments where the scanning incidence angle was varied in a range expected in the OR (i.e., ±5–10 degrees), the perspective transformation error associated with mapping the texture is on the order of 1 mm. Considering that the localization error of the OPTOTRAK is on the order of 0.15 mm and a low-resolution camera is being used to capture the FOV, this is an acceptable result for this initial work.
The nonrigid phantom experiments relayed in Fig. 8 demonstrate the full extent of the shift-tracking protocol within the context of a controlled phantom experiment. The results in Fig. 11 and Table II demonstrate the fidelity with which simulated cortical targets are tracked. As shown in Fig. 11, all points experienced similar shifts (13.6 mm) with points on the periphery having increased STEs as compared to those located internally. Specifically, point 4 (6.1-mm error) is very close to the edge of the phantom in the compressed state and in the subsequent dual-compression becomes somewhat obscured. In most mutual-information-based nonrigid image registration frameworks there is a necessity for similar structures to exist within the two images being registered, otherwise the statistical dependence sought by mutual information registration is confounded. The implications to this requirement are more salient when considering the nature of the brain surface during surgery. In cases of substantial tissue removal, measurements of deformation immediately around voids in the surface may be less accurate. Further studies need to be conducted to understand the influence of missing regions on shift measurement but the fidelity of measurement within close proximity is promising (e.g., in Fig. 8(a), point 7 is in close proximity to 4 and experienced STEs between 1 and 2 mm). Interestingly, Table II does indicate some variability with respect to measuring shift especially in the combined perspective and nonrigid experiment (Table II, last three columns). The primary cause of this behavior appears to be from the compression device. Figs. 8 and 11(b) show that the compression plate displays a reflected image of the phantom which may affect the ABA registration. In addition, some points become somewhat obscured by the device itself during the combined nonrigid and perspective shift experiment (i.e., points 1, 4, and 5). While the ABA registration produces a result in these regions, the disappearance of feature between serial scans is still something that needs further study. This emphasizes that special care may be needed when measuring shifting structures in close proximity to the craniotomy margin or around resected regions in the in vivo environment. However, it should be noted that with respect to directionality as measured by the angle θ the OPTOTRAK and the protocol’s shift vectors, all results have good agreement.
Fig. 9 illustrates a preliminary in vivo case used for assessing the shift tracking protocol. For this case, points on the brain surface were independently digitized by the OPTOTRAK system. Since the OPTOTRAK and LRS unit were tracked in the same coordinate reference, direct comparisons could be made to the LRS-based measurements conducted manually and by the shift-tracking protocol. Fig. 12 and Table III quantify the shift tracking capabilities for this preliminary in vivo case. The results comparing the OPTOTRAK measurements to the manual were in good agreement with an rms error of 2.1 mm, while when comparing to the automatic tracking protocol were less satisfying with an rms error of 3.7 mm. It should be noted that point #1 was considered an outlier in the shift-tracking protocol result due to misidentification of the surgical point during OPTOTRAK digitization. This misidentification could be corrected in the manual digitization, hence the reason why STE is similar with and without target point #1 in the manual shift-tracking results (see the rms results in Table III, column 7). The most likely reason for the discrepancy in the results between manual and automatic methods is the state of the cortical surface between range scans. In this case, a considerable disruption of the surfaces occurred between scans due to tumor resection. In results reported elsewhere [38] where the surface was not as disrupted, we have found much better agreement. The problem of accounting for FOV discontinuities in sequential images is an active area of research in the nonrigid image registration community and warrants further research in this context also. Based on these results, it is evident that more development is necessary for the nonrigid registration of brain textures. However, the success of manual measurements provides rationale to continue this approach. More specifically, sufficient pattern was available within the image textures to allow a user to accurately measure shift. In addition, when considering the localization error associated with LRS data and the digitization error with the OPTOTRAK on a deformable structure, 2.1 mm is markedly accurate.
The results presented here are encouraging given the early stages of development in this paper. Many factors need to be studied further such as: the performance of the ABA registration on multiple sets of brain surface images, the impact of missing structures, the influence of line-of-sight requirements, the effects of craniotomy size on algorithm fidelity, and the speed of measurement. However, the methods and results described here do present a significant development in identifying and measuring 3-D brain shift during surgery.
V. Conclusion
This paper represents a critical step in addressing the brain-shift problem within IGS systems. Unlike other methods [21], [37] to quantify shift, the added dimensionality of surface texture allows full 3-D correspondence to be determined which is not usually possible using other geometry based methods.
When considering the advancements embodied in this work coupled with our previous study in aligning textured LRS data to the MR volume rendered image tomogram [15], a novel visualization and measurement platform is being developed. This platform will offer surgeons an ability to correlate the intraoperative brain surfaces with their preoperatively acquired image volume counterparts. It will also offer surgeons the ability to render cortical targets identified on MR image volumes into the surgical FOV in a quantitative manner. Last, the quantitative measurement of brain shift afforded by textured LRS technology presents a potential opportunity in developing shift compensation strategies for IGS systems using computer modeling approaches.
Acknowledgments
This work was supported in part by Vanderbilt University’s Discovery Grant Program and the NIH-National Institute for Neurological Disorders and Stroke Grant R01 NS049 251-01A1. The Associate Editor responsible for coordinating the review of this paper and recommending its publication was T. Peters.
Appendix A. Registering LRS-Space to Physical-Space
The registration of the LRS scanning space to physical-space is achieved using a registration phantom with the registration schematic in Fig. 13. The phantom is 15 cm × 15 cm × 6 cm, with white disc fiducials 9.5 mm in radius. Three-millimeter diameter hemispherical divots were machined into the center of each of the nine discs to compensate for the 3-mm-diameter ball tip used to capture physical-space points. The phantom is painted with nonreflective paint to minimize the acquisition of nondisc range points.
During registration, physical space locations of each disc’s center was acquired three times. The average location of the three acquisitions was used as the physical-space location of the fiducial (Pp). Corresponding fiducials8 were localized in LRS-space by segmenting each disc from the native LRS dataset. A region growing technique was used to identify all points corresponding to an individual disc. Calculating the centroid of each group of points resulted in fiducial locations in LRS-space (Pr). A point-based rigid-body registration of the two point sets provides the transformation (Tr→r′) from LRS-space (Xr) to a pose-dependent physical-space ( ) [39]. The reason for the pose-dependence is that the physical-space points are acquired relative to a reference rigid-body affixed to the scanning object. If the scanner is moved relative to the reference rigid-body, Tr→r′ will not provide consistent physical-space coordinates. As a result, the final step in the registration process is to incorporate the pose of the LRS relative to the reference rigid-body (Tr→p) at the time of scanning, leading to the formulation of the registration transform in (7).
| (7) |
where Tr′→p, the scanner pose relative to the reference rigid-body, is provided by the OPTOTRAK. Subsequent LRS datasets can now be transformed into physical-space by using Tr→p and the new pose of the scanner according to (8).
| (8) |
Appendix B. Clinical Impact of the Technology and Intraoperative Design Concerns
In this work, we have used the LRS system in a proof-of-concept framework. Three important, distinct clinical issues with respect to the full realization of this framework are: 1) disruption of the procedure; 2) the effects of retraction on the measuring methodology; and 3) issues concerned with lighting in the OR that could confound the approach.
The current OR design of the LRS unit allows for accurate and effective clinical data acquisition at the cost of some surgical intrusiveness, i.e., the surgeons must move away from the patient and allow for the LRS to come into the surgical FOV. The surgeons we have worked with have indicated that this has been minimally obstructive to their progress in surgery due to the fast nature of our approach (2–4 min to get an acquisition which includes: movement into the FOV, setup, scan, and withdrawal). Nonetheless, future generations of the scanning device can be greatly improved with respect to this intrusive design. Although some surgeons rely on the surgical microscope to different degrees, in principle, one could mount this technology to an existing surgical microscope. Based on work with our industrial collaborators, the size of the scanner can be significantly reduced. In fact, there is very little inherent OR constraints that prevent the adoption of this technology.
While retraction is used to different degrees based on surgical presentation and technique (with some neurosurgeons using the tool less than others), the obstruction to the brain surface would undoubtedly result in a loss of data. However, the LRS unit can readily capture the location and application point of a retractor within the surgical field. Arguably, in these cases, capturing the retractor contact position relative to the brain surface would be of great importance for estimating brain shift with computer models. We assert that the LRS unit can capture this type of information and that it could be used as a source of data for MUIGS frameworks [5].
With respect to the quality of the data acquired, our current experience leads us to believe that lighting conditions can be an issue. However, we have found that ambient lighting conditions are sufficient for clean, accurate and highly resolved texture LRS datasets with the current scanner. In our current intraoperative data acquisition protocol, the surgeons usually turn overhead focused lights and head-lamps away from the surgical FOV. Again, future designs could greatly improve on these constraints by calibrating the LRS capture CCDs to the lighting characteristics of the surgical microscope to which they are mounted. Another enhancement to the current design would most likely be the resolution and capture characteristics of the texture image CCD. Currently, the CCD used to acquire the texture image is not ideal for capturing high resolution, high contrast digital images. This is mainly due to the intended purpose of the LRS device in scanning larger objects with limited texture information. A higher resolution digital image of the surgical FOV would allow for highly resolved deformation fields between serial texture images and would in turn increase the overall accuracy of the shift-tracking protocol. These enhancements, being very feasible, could help alleviate many of the acquisition deficiencies that currently face us. Furthermore, they will help increase the clinical impact of the shift-tracking protocol.
Footnotes
Sparse data is defined as data with limited information or extent within the surgical environment.
More information regarding the clinical impact of the device is contained within Appendix A and Appendix B.
The calibration is generated and provided by the manufacturer; it is intrinsic to the scanner.
Unique and reproducibly identified points across all modalities that were not used in the registration process.
The image processing done in the texture space included thresholding of the intensities such that only the white discs were apparent; all other pixels were set to a termination value (i.e., −1). A region growing technique was then used to collect all image pixels belonging to a single disc. The region growing was terminated based on the intensity value of the 8-neighbor pixels from the current pixel in the region growing.
Reproducibility for these markings was measured by determining the accuracy with which one could reselect target landmarks from a textured LRS dataset. Reproducibility trials were performed with 10 individuals marking 7 target landmarks from an intraoperative LRS dataset. The reported number was the average targeting error across all individuals and all trials.
The accuracy of the OPTOTRAK system in tracking individual infrared emitting diodes is reported to be (0.1, 0.1, 0.15) mm in x, y, and z at 2.25 m, respectively (www.ndigital.com/optotrak-techspecs.php)
Correspondence was established a priori by numbering the fiducials discs and localizing each fiducial in order.
Contributor Information
Tuhin K. Sinha, Department of Medical Engineering, Vanderbilt University, Nashville, TN 37235 USA
Benoit M. Dawant, Department of Electrical and Computer Engineering, Vanderbilt University, Nashville, TN 37235 USA
Valerie Duay, Department of Medical Engineering, Vanderbilt University, Nashville, TN 37235 USA.
David M. Cash, Department of Medical Engineering, Vanderbilt University, Nashville, TN 37235 USA
Robert J. Weil, Brain Tumor Institute, Cleveland Clinic Foundation, Cleveland, OH 44195 USA
Reid C. Thompson, Department of Neurosurgery, Vanderbilt University Medical Center, Nashville, TN 37232 USA
Kyle D. Weaver, Department of Neurosurgery, Vanderbilt University Medical Center, Nashville, TN 37232 USA
Michael I. Miga, Department of Medical Engineering, Vanderbilt University, VU Station B, #351631, Nashville, TN 37235 USA
References
- 1.Roberts DW, Hartov A, Kennedy FE, Miga MI, Paulsen KD. Intraoperative brain shift and deformation: A quantitative analysis of cortical displacement in 28 cases. Neurosurgery. 1998;43(4):749–758. doi: 10.1097/00006123-199810000-00010. [DOI] [PubMed] [Google Scholar]
- 2.Nimsky C, Ganslandt O, Hastreiter P, Fahlbusch R. Intraoperative compensation for brain shift. Surg Neurol. 2001;56(6):357–364. doi: 10.1016/s0090-3019(01)00628-0. [DOI] [PubMed] [Google Scholar]
- 3.Nabavi A, Black PM, Gering DT, Westin CF, Mehta V, Pergolizzi RS, Ferrant M, Warfield SK, Hata N, Schwartz RB, Wells WM, Kikinis R, Jolesz FA. Serial intraoperative magnetic resonance imaging of brain shift. Neurosurgery. 2001;48(4):787–797. doi: 10.1097/00006123-200104000-00019. [DOI] [PubMed] [Google Scholar]
- 4.Hartkens T, Hill DLG, Castellano-Smith AD, Hawkes DJ, Maurer CR, Martin AJ, Hall WA, Liu H, Truwit CL. Measurement and analysis of brain deformation during neurosurgery. IEEE Trans Med Imag. 2003 Jan;22(1):82–92. doi: 10.1109/TMI.2002.806596. [DOI] [PubMed] [Google Scholar]
- 5.Miga MI, Roberts DW, Kennedy FE, Platenik LA, Hartov A, Lunn KE, Paulsen KD. Modeling of retraction and resection for intraoperative updating of images. Neurosurgery. 2001;49(1):75–84. doi: 10.1097/00006123-200107000-00012. [DOI] [PubMed] [Google Scholar]
- 6.Miller K. Constitutive model of brain tissue suitable for finite element analysis of surgical procedures. J Biomechan. 1999;32(5):531–537. doi: 10.1016/s0021-9290(99)00010-x. [DOI] [PubMed] [Google Scholar]
- 7.Skrinjar O, Nabavi A, Duncan J. Model-driven brain shift compensation. Med Image Anal. 2002 Dec;6(4):361–373. doi: 10.1016/s1361-8415(02)00062-2. [DOI] [PubMed] [Google Scholar]
- 8.Edwards PJ, Hill DL, Little JA, Hawkes DJ. A three-component deformation model for image-guided surgery. Med Image Anal. 1998;2(4):355–67. doi: 10.1016/s1361-8415(98)80016-9. [DOI] [PubMed] [Google Scholar]
- 9.Fontenla E, Pelizzari CA, Roeske JC, Chen GTY. Using serial imaging data to model variabilities in organ position and shape during radiotherapy. Phys Med Biol. 2001 Sep;46(9):2317–2336. doi: 10.1088/0031-9155/46/9/304. [DOI] [PubMed] [Google Scholar]
- 10.Hagemann A, Rohr K, Stiehl HS, Spetzger U, Gilsbach JM. Biomechanical modeling of the human head for physically based, nonrigid image registration. IEEE Trans Med Imag. 1999 Oct;18(10):875–84. doi: 10.1109/42.811267. [DOI] [PubMed] [Google Scholar]
- 11.Ferrant M, Nabavi A, Macq B, Jolesz FA, Kikinis R, Warfield SK. Registration of 3-D intraoperative MR images of the brain using a finite-element biomechanical model. IEEE Trans Med Imag. 2001;20(12):1384–1397. doi: 10.1109/42.974933. [DOI] [PubMed] [Google Scholar]
- 12.Kelly PJ, Kall B, Goerss S, Earnest FI. Computer-assisted stereotaxic laser resection of intra-axial brain neoplasms. J Neurosurg. 1986;64:427–439. doi: 10.3171/jns.1986.64.3.0427. [DOI] [PubMed] [Google Scholar]
- 13.Nauta HJ. Error assessment during “image guided” and “imaging interactive” stereotactic surgery. Comput Med Imag Graph. 1994;18(4):279–87. doi: 10.1016/0895-6111(94)90052-3. [DOI] [PubMed] [Google Scholar]
- 14.Dorward NL, Alberti O, Velani B, Gerritsen FA, Harkness WFJ, Kitchen ND, Thomas DGT. Postimaging brain distortion: Magnitude, correlates, and impact on neuronavigation. J Neurosurg. 1998;88(4):656–662. doi: 10.3171/jns.1998.88.4.0656. [DOI] [PubMed] [Google Scholar]
- 15.Miga MI, Sinha TK, Cash DM, Galloway RL, Weil RJ. Cortical surface registration for image-guided neurosurgery using laser range scanning. IEEE Trans Med Imag. 2003 Aug;22(8):973–985. doi: 10.1109/TMI.2003.815868. [DOI] [PMC free article] [PubMed] [Google Scholar]
- 16.Audette MA, Siddiqi K, Ferrie FP, Peters TM. An integrated range-sensing, segmentation and registration framework for the characterization of intra-surgical brain deformations in image-guided surgery. Comput Vis Image Understanding. 2003;89(2–3):226–251. [Google Scholar]
- 17.Chui H, Rangarajan A. A new point matching algorithm for nonrigid registration. Comput Vis Image Understanding. 2003;89:114–141. [Google Scholar]
- 18.Chui H, Win L, Schultz R, Duncan JS, Rangarajan A. A unified nonrigid feature registration method for brain-mapping. Med Image Anal. 2003;7:113–130. doi: 10.1016/s1361-8415(02)00102-0. [DOI] [PubMed] [Google Scholar]
- 19.Skrinjar O, Nabavi A, Duncan J. A stereo-guided biomechanical model for volumetric deformation analysis. Proc IEEE Workshop Mathematical Methods Biomedical Image Analysis, 2001. 2001 Dec;:95–102. [Google Scholar]
- 20.Skrinjar O, Duncan J. Stereo-guided volumetric deformation recovery. Proc 2002 IEEE Int Symp Biomedical Imaging. 2002:863–866. [Google Scholar]
- 21.Sun H, Farid H, Rick K, Hartov A, Roberts DW, Paulsen KD. Lecture Notes in Computer Science. Vol. 2878. New York: Springer-Verlag; 2003. Estimating cortical surface motion using steropsis for brain deformation models; pp. 794–801. Medical Image Computing and Computer Assisted Intervention: MICCAI’03. [Google Scholar]
- 22.Cash DM, Sinha TK, Chapman W, Terawaki H, Dawant B, Galloway RL, Miga MI. Incorporation of a laser range scanner into image-guided liver surgery: Surface acquisition, registration, and tracking. Med Phys. 2003;30(7):1671–1682. doi: 10.1118/1.1578911. [DOI] [PMC free article] [PubMed] [Google Scholar]
- 23.Cash DM, Sinha TK, Chapman WC, Galloway RL, Miga MI. SPIE Med Imag 2002. Vol. 4681. San Diego, CA: 2002. Fast, accurate surface acquisition using a laser range scanner for image-guided liver surgery. [DOI] [PMC free article] [PubMed] [Google Scholar]
- 24.Foley JD, Hughes J, van Dam A. Computer Graphics: Principles and Practice, ser. Addison-Wesley Systems Programming Series. Reading, MA: Addison-Wesley; Jul, 1995. [Google Scholar]
- 25.Rohde G, Aldroubi A, Dawant BM. The adaptive bases algorithm for intensity based non rigid image registration. IEEE Trans Med Imag. 2003 Nov;22(11):1470–1479. doi: 10.1109/TMI.2003.819299. [DOI] [PubMed] [Google Scholar]
- 26.Viola P, Wells W. Alignment by maximization of mutual information. Int J Comput Vis. 1997;24(2):137–154. [Google Scholar]
- 27.Maes F, Collignon A, Vandermeulen D, Marchal G, Seutens P. Multimodality image registration by maximization of mutual information. IEEE Trans Med Imag. 1997 Apr;16(2):187–198. doi: 10.1109/42.563664. [DOI] [PubMed] [Google Scholar]
- 28.Duay V, Sinha TK, D’Haese P, Miga MI, Dawant BM. Lecture Notes in Computer Science. Vol. 2717. New York: Springer-Verlag; 2003. Nonrigid registration of serial intraoperative images for automatic brain-shift estimation; pp. 61–70. Biomedical Image Registration. [DOI] [PMC free article] [PubMed] [Google Scholar]
- 29.Abdel-Aziz YI, Karara HM. Direct linear transformation into object space coordinates in close-range photogrammetry. Proc Symp Close-Range Photogrammetry. 1971:1–18. [Google Scholar]
- 30.Hartley R, Zisserman A. Multiple View Geometry in Computer Vision. New York: Cambridge Univ. Press; 2001. [Google Scholar]
- 31.Dierckx P. Curve and Surface Fitting with Splines. New York: Oxford Univ. Press; 1993. [Google Scholar]
- 32.Fitzpatrick JM, West JB. The distribution of target registration error in rigid-body point-based registration. IEEE Trans Med Imag. 2001 Sep;20(9):917–927. doi: 10.1109/42.952729. [DOI] [PubMed] [Google Scholar]
- 33.West JB, Fitzpatrick JM, Toms SA, Maurer CR, Maciunas RJ. Fiducial point placement and the accuracy of point-based, rigid body registration. Neurosurgery. 2001;48(4):810–816. doi: 10.1097/00006123-200104000-00023. [DOI] [PubMed] [Google Scholar]
- 34.Mandava VR, et al. Registration of multimodal volume head images via attached markers. Proc SPIE Medical Imaging IV: Image Processing. 1992;1652:271–282. [Google Scholar]
- 35.Mandava VR. PhD dissertation. Vanderbilt Univ; Nashville, TN: Dec, 1991. Three dimensional multimodal image registration using implanted markers. [Google Scholar]
- 36.Rosner B. Fundamentals of Biostatistics. 4. New York: Duxbury; 1995. [Google Scholar]
- 37.Audette MA, Siddiqi K, Peters TM. Lecture Notes in Computer Science. Vol. 1679. New York: Springer-Verlag; 1999. Level-set surface segmentation and fast cortical range image tracking for computing intra-surgical deformations; pp. 788–797. Medical Image Computing and Computer Assisted Intervention: MICCAI’99. [Google Scholar]
- 38.Sinha TK, Duay V, Dawant BM, Miga MI. Lecture Notes in Computer Science. 2. Vol. 2879. New York: Springer-Verlag; 2003. Cortical shift tracking using laser range scanner and deformable registration methods; pp. 166–174. Medical Image Computing and Computer Assisted Intervention—MICCAI 2003. [DOI] [PMC free article] [PubMed] [Google Scholar]
- 39.Arun KS, Huang TS, Blostein SD. Least-squares fitting of 2 3-d point sets. IEEE Trans Pattern Anal Mach Intell. 1987 Sep;PAMI-9(5):699–700. doi: 10.1109/tpami.1987.4767965. [DOI] [PubMed] [Google Scholar]


