Abstract
This article presents a method designed to automatically track cortical vessels in intra-operative microscope video sequences. The main application of this method is the estimation of cortical displacement that occurs during tumor resection procedures. The method works in three steps. First, models of vessels selected in the first frame of the sequence are built. These models are then used to track vessels across frames in the video sequence. Finally, displacements estimated using the vessels are extrapolated to the entire image. The method has been tested retrospectively on images simulating large displacement, tumor resection, and partial occlusion by surgical instruments and on 21 video sequences comprising several thousand frames acquired from three patients. Qualitative results show that the method is accurate, robust to the appearance and disappearance of surgical instruments, and capable of dealing with large differences in images caused by resection. Quantitative results show a mean vessel tracking error (VTE) of 2.4 pixels (0.3 or 0.6 mm, depending on the spatial resolution of the images) and an average target registration error (TRE) of 3.3 pixels (0.4 or 0.8 mm).
Index Terms: Brain shift, image guided neurosurgery, registration, tracking, vessel
I. Introduction
MOST image-guided surgery systems in current clinical use only address the rigid body alignment of pre-operative images to the patient in the operating room despite the fact that substantial brain shift happens as soon as the dura is opened [1]–[4]. The problem is even more acute for cases that involve tumor resection. A possible solution to this problem is to use models [4]–[6] that can predict brain shift and deformation based on cortical surface data acquired intraoperatively such as laser range scans [7]–[12] or video images [13]–[21].
Video images acquired with cameras attached or integrated with the operating microscope have been proposed to register pre- and intraoperative data as early as 1997 by Nakajima et al. [13]. This approach has been extended in [14] and [15] by using a pair of cameras. In 2006, DeLorenzo et al. used both sulcal and intensity features [16], [17] to register pre-operative images with intraoperative video images. However, these studies were carried out on data acquired just after the opening of the dura [17] or on epileptic procedures for which brain shift is relatively small when compared to tumor resection surgeries [11], [12].
The objective of the work described in this article is to develop a system that can be deployed in the Operating Room (OR) to update preoperative images and thus provide deformation-corrected guidance to the surgical team. To estimate surface deformation during surgery, a tracked laser range scanner [11], [12] has been employed. This device simultaneously acquires 3-D physical coordinates of the surface of a scanned object using traditional laser triangulation techniques and a color image of the field of view. Because the color image and the 3-D cloud of points are registered through 2-D to 3-D texture calibration, the 3-D coordinates of the image pixels are known. As shown in [11] and [12], tracking the 3-D displacement of the cortical surface can thus be achieved by registering the 2-D color images acquired over time. This can be achieved by placing the laser range scanner in the operating room and acquiring data during the procedure. While feasible, this approach is difficult to use in practice, at least in our OR setting, because it requires positioning the scanner above the resection site and acquiring the data, which takes on the order of one minute. One possibility is to acquire one laser range scan just after the opening of the dura and one or more additional scans during the procedure, typically after partial tumor resection. Substantial changes occur during surgery such that developing automatic techniques for the registration of the 2-D static images that are acquired at different phases of the procedure by the scanner, is challenging. As a partial solution, we have developed a semiautomatic method that only requires selecting starting and ending points on vessel segments that are visible in the scanner images that need to be registered [12]. Using this method, we have shown that it is possible to estimate the displacement of points on cortical surfaces with submillimetric accuracy. These results were obtained on images acquired from 10 patients with mean cortical shift of about 9 mm and range from 2 mm to 23 mm. Herein, we describe an effort to automate the registration of the laser range scanner images using video streams acquired with an operating microscope.
Operating microscopes are typically used during the procedure and these are often equipped with video cameras. Clearly, the video sequences have a much higher temporal resolution than images acquired with the tracked laser range scanner. Changes occurring between video frames are thus substantially smaller and automatic tracking of vessels through the video sequence may be possible. Estimating cortical shift during the procedure could thus be done as follows: 1) acquire a 2-D image/3-D point cloud laser scanner data set at time t0; 2) register the 2-D image acquired with the scanner to the first frame of a video sequence started shortly after t0; 3) estimate 2-D displacement/deformation occurring in the video sequence; 4) stop the video sequence at time t1; 5) acquire a 2-D image/3-D point cloud laser scanner data set shortly after time t1; 6) register the 2-D image acquired with the scanner at time t1 with the last frame in the video sequence to establish a correspondence between laser range scanner image 1 and laser range scanner image 2; and 7) compute 3-D displacements for each pixel in the images using their associated 3-D coordinates.
Recently, Paul et al. [20], [21] have proposed a technique to estimate cortical shift from video sequences but their approach is substantially different from ours. In their approach, a pair of microscope images is used to create a surface at time t1. At this time, a number of points are also localized in one of the video images. These points are tracked in one of the sequences until time t2. At time t2 another pair of images is acquired and an-other surface computed. Computation of cortical displacement requires the registration of the two surfaces. This is an inherently difficult problem because the appearance and shape of the surfaces change throughout surgery. In their work, they use a similarity measure to register these surfaces that relies on intensity, intersurface distance, and on displacement information provided by the tracked points. Because we use a laser range scanner that provides us with the 3-D coordinates of the pixels in the images it acquires, we do not need to estimate the 3-D surface, nor do we need to register surfaces directly. The entire problem can be handled using much simpler 2-D registrations.
The remainder of this article is organized as follows: First, the data that have been used are described. The technique that has been used to model and track the vessels is explained next. This is followed by a discussion on how vessel displacement is used to estimate displacements over the entire image. Simulated results show the robustness of the proposed method to displacement, partial occlusions and changes caused by the resection. Results obtained on real images confirm the simulated results and show overall submillimetric registration accuracy.
II. Data
A Zeiss OPMI® Neuro/NC4 microscope equipped with a video camera was used to acquire the video sequences. The frame rate of the video is 29 fps. A total of 21 sequences were acquired from three patients (7 sequences/patient) with IRB (Institutional Review Board) approval. The images of patient 1 have 352 × 240 pixels, while the images of patients 2 and 3 have 768 × 576 pixels. The approximate pixel dimension in the video images of patient 1 is 0.06 mm2, while it is 0.01 mm for the other two patients. At those resolutions, cortical capillaries and small vessels can be seen in the images and used for tracking. Between sequences acquired for a particular patient the camera can be translated, rotated or its focus adjusted to suit the needs of the neurosurgeon.
To show the feasibility of registering video and laser range scanner images, one additional data set was acquired. This data set includes a laser range scanner image and one video sequence started 5 min after the acquisition of this image.
III. Methods
A number of methods can be used to register sequential frames in video streams. For example, nonrigid intensity-based algorithm has been used to estimate heart motion in video streams [22]. However, as also reported by Paul et al. [21], this approach is not adapted to the current problem because surgical instruments appear and disappear from the field of view. To address this issue, a feature-based method that requires finding homologous structures in sequential frames, has been adopted in this work. These structures are used to compute transformations that are subsequently utilized to register the entire image. The blood vessels are the most visible structures in the video images; hence, they are employed as tracked features.
In the approach described herein, vessel segments are identified by the user in the first frame of a video sequence. This is done by selecting starting and ending points on these segments. A minimum cost path finding algorithm is then used to join the starting and ending points and segment the vessels (more details on this approach can be found in [12]).
A. Features Used for Tracking
Once the vessels are identified, their centerline C is sampled to produce a number of points, which we call active points. In the current version of the algorithm, this is done by downsampling the centerlines by a factor of four, which was found to be a good compromise between speed and accuracy. For each of the active points, a line perpendicular to the centerline passing through the point is computed as shown in Fig. 1.
Fig. 1.
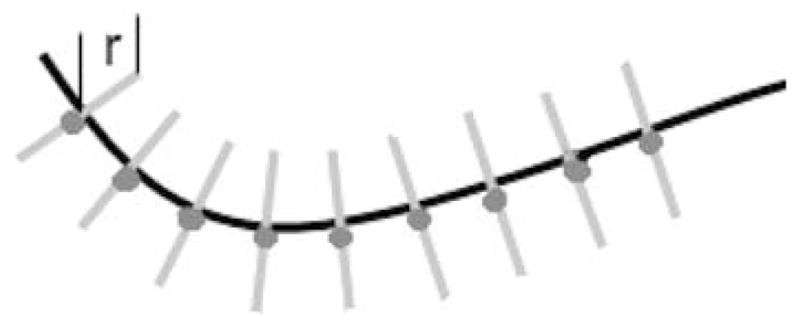
Active points along the curve.
Next, a feature matrix F (1) is associated with each point. To create this matrix, the R, G, B, and vesselness values are extracted from the image along these perpendicular lines. Vesselness, defined as in [23], is a feature computed from the Hessian of the image obtained at different scales (here scales ranging from 1 to 8 pixels have been used). It is commonly used to enhance tubular structures.
Because the R, G, and B values are intensity features while vesselness is a shape feature within the [0,1] interval, the R, G, B values are first normalized between 0 and 1, while the vesselness value V is multiplied by 3 to avoid weighing one type of feature over another.
The length r of the perpendicular lines on either side of the centerline is a free parameter. Each active point ai is thus associated with the following matrix:
| (1) |
B. Finding Homologous Points in Consecutive Frames
To match one frame to the other, homologous points need to be localized. This is done as follows: First, one feature matrix, as defined above, is associated with every pixel in the new frame. Second, the active points and the centerlines found in the previous frame are projected onto the new frame. Then the similarity between 1) the feature matrix of every pixel in the new frame along lines perpendicular to the centerlines and passing through the active points and 2) the feature matrix of the corresponding active point in the previous frame is computed as
| (2) |
in which c and d are the row and column index of the feature matrix, i refers to the ith point on the centerline and j is the position on the line perpendicular to the centerline at that point with −sr ≤ j ≤ sr, i.e., the computation is done in bands of width 2 sr +1. Fai is the feature matrix in the previous frame of the ith active point and Fpi,j is the feature matrix in the new frame of the jth point along the perpendicular passing through the ith active point.
The point bi with the feature matrix most similar to the feature matrix of the active point ai in the previous frame is selected as the homologous point for this active point. However, if the maximum similarity between some ai and all the pi,j is small, it indicates that no reliable homologous point bi can be found along the search line. When the maximum similarity falls below a threshold for a point ai, it is deactivated and not used to estimate the transformation that registers consecutive frames.
This process is illustrated in Fig. 2. In this figure, the dotted line represents the projection of the centerline from the previous frame to the current frame. The red dots are the active points. The lines perpendicular to the dotted lines are the search direction for each active point. The continuous line represents the position of the vessel in the new frame. In the left image, all the active points found their homologous points, which are shown as red stars. In the right image, an object appears and covers part of the vessel. For some active point ai, this results in
Fig. 2.

Strategy used to search for homologous points in the next frame.
| (3) |
C. Smoothing TPS
Smoothing Thin Plate Splines (TPS) are regularized TPS, which minimize the following function:
| (4) |
Here, smoothing TPS are used to compute the transformation that registers the active points {a1, a2, …, al} in one frame to the corresponding points {b1, b2, …, bl} in the next frame. For a fixed λ there exists a unique minimizer T. To solve this variational problem, QR decomposition as proposed by Wahba [24] has been used. The parameter λ is used to control the rigidity of the deformation. When λ → ∞, the transformation is constrained the most and is almost affine. Through experimentation, λ = 1 has been found to produce transformations that are smooth, regular, and forgiving to local errors in point correspondence while being able to capture the observed inter-frame deformations/displacements. The transformation computed with the homologous points is then extrapolated over the entire frame. The algorithm developed is summarized in Table I. All the results obtained have been computed with tracking one out of every five frames in the sequence to speed up the process. This downsampling did not affect the results.
TABLE I.
Automatic Intra-Video Tracking in Intra-Operative Videos
|
IV. Results
A. Registration of Laser Scanner and Microscope Images
Fig. 3 illustrates the feasibility of registering 2-D images acquired with our laser range scanner (left panel) to a microscope image (right panel) acquired five minutes after the scanner image. These images have been registered nonrigidly using vessels segmented semiautomatically. Yellow points have been selected on the microscope image and projected onto the laser image through the computed transformation.
Fig. 3.
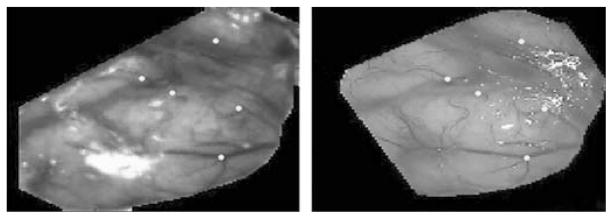
Example of registration of a 2-D laser range scanner image (left panel) and one microscope image (right panel).
B. Simulated Results
To show the robustness of the algorithm to various challenging situations observed in clinical images, we have generated simulated sequences. With these, we show its robustness to translation, occlusion, and changes due to resection.
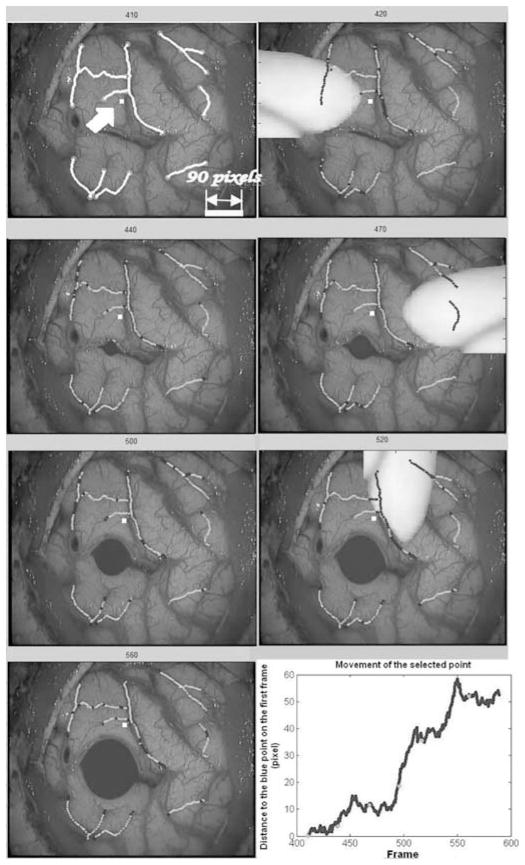
In clinical sequences, translation is observed when parts of the brain sag, causing portions of the cortical surface initially visible through the craniotomy to disappear under the skull. To simulate this situation, we have selected one video frame in one of the third patient’s sequences, and we have translated it by 90 pixels in the x and y direction over 90 frames. Fig. 4 shows four frames in this sequence. Tracked vessels are selected in frame 410 and shown in yellow in the top left panel of Fig. 4. The location of the tracked vessels estimated by our algorithm on frames 440, 470, and 500 are shown in green. Blue segments shown within the green segments are segments over which homologous active points were not found. When active points fall outside the image, they are deactivated and not used to compute the transformations.
Fig. 4.
Simulation of a diagonal translation of 90 pixels in the x and y directions over 90 frames. Selected vessels are shown in yellow. Estimated vessel locations produced by our algorithm are shown in green.
In addition to translation, the appearance of surgical instruments in the video sequence is a potential source of tracking error. In order to show the robustness of the approach to the sudden appearance of objects in the field of view, one video sequence was selected and simulated instruments were inserted into the field of view to mask various parts of the image during portions of the sequence.
The top left panel of Fig. 5 shows frame 410 of the third patient. The vessels selected in frame 410 are shown in yellow. Tracking results are shown in green on the other frames. One point shown in white and indicated by an arrow on the first frame has been selected in the image to show overall displacement. The bottom right panel shows the Euclidean distance of the point to its original position in consecutive frames. The oscillations observed in this plot are due to small displacements of the cortical surface caused by brain pulsatility. In these simulations, an object is inserted on the left side of the image at frame 420 and disappears at frame 430, another object appears on the right side of the image at frame 470 and disappears at frame 480, and a third object appears in the top at frame 520 and disappears at frame 530. In the same sequence, a cavity induced by the resection has also been simulated. This was achieved by placing a small cavity in an incision visible in the image and progressively growing it. To achieve this, the image was expanded linearly within the cavity. Outside the cavity, the magnitude of the deformation was reduced exponentially. The radius of the cavity was increased from frame to frame. This results in images in which tissues surrounding the cavity are both displaced and compressed.
Fig. 5.
Simulation of occlusions caused by surgical instruments entering and leaving the field of view and of a cavity caused by a resection. Selected vessels are shown in yellow on the first frame. Estimated vessel locations are shown in green on the other frames. The blue segments indicate segments for which no correspondence was found. The bottom right panel shows the displacement of the white point indicated by an arrow on the upper left frame.
As was the case in the previous figure, vessel segments that appear in blue are segments over which active points were not found. The transformation used to register the frames was thus computed without them. But because the remaining segments are sufficient to compute a transformation that is accurate enough over the entire image, the computed position of the vessel during occlusion is approximately correct. As soon as the instrument disappears, the algorithm reacquires the vessels. This is possible because the vesselness component of the feature matrix is defined on the first frame and fixed for the entire sequence. When a surgical instrument appears in the field of view, it dramatically changes the vesselness value of the pixels it covers. Because of this, the similarity between these pixels and the centerline pixels projected from the previous frame falls below the threshold and no correspondence is found. As soon as the vessels become visible, the similarity value is above the threshold and the vessels are used. This will work well as long as the transformation computed without the covered vessels is a reasonable approximation over the covered regions. One also observes that the presence of the cavity does not affect tacking results.
C. Qualitative Results Obtained on Real Image Sequences
In this section, results obtained for selected patient sequences are presented to illustrate the type of images included in the study.
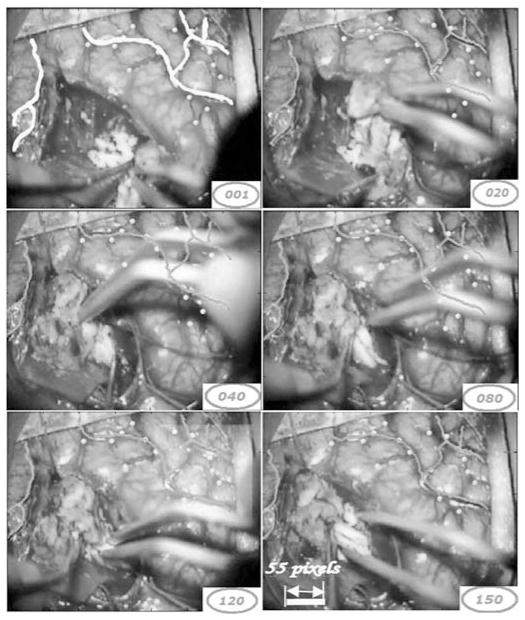
Fig. 6 shows several frames in one sequence acquired for the first patient. In this sequence, a surgical instrument appears in the field of view. The vessels selected in the first frame are shown in yellow. Tracking results are shown in green in the other frames. Points shown in yellow are points that are not used for registration purposes but define targets used in the quantitative study (see next section). As was the case in the simulated images, the algorithm is capable of tracking selected vessels despite the partial occlusion caused by the surgical instruments and the cortical deformation caused by the resection. A close inspection of frame 120 in Fig. 6 shows a light yellow square on the right corner of the image. This is the logo of the Zeiss microscope, which is occasionally projected onto the image and causes artifacts. As discussed above, the vesselness component of the feature matrix is evaluated on the first frame of the video sequence and fixed for the entire sequence. This is done because it is assumed that the shape characteristics of the vessels do not change from frame to frame. The R, G, and B values, on the other hand, are updated as the algorithm moves from one frame to the other. This permits the adaptation of the color characteristics to, for instance, changes in lighting conditions. Here, the algorithm is immune to the artifact caused by the Zeiss logo because it appears in the video gradually and the R, G, and B values of the similarity matrix are adapted.
Fig. 6.
Tracking of sample frames in one video sequence for patient 1.
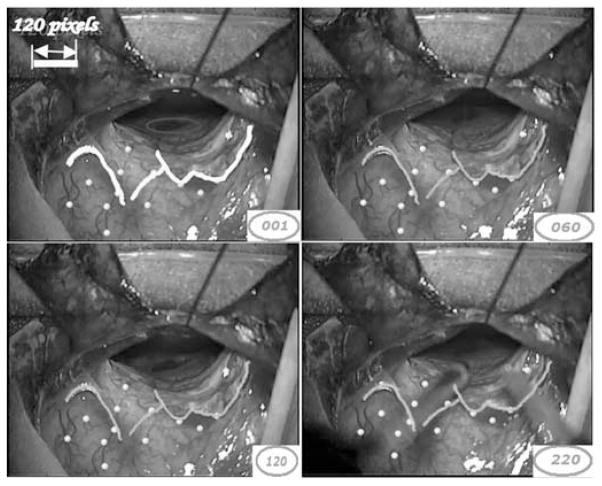
Fig. 7 shows several frames in one of the second patient’s sequences. In this sequence, a relatively fast, medium amplitude motion was observed. Vessel segments identified on the first frame and shown in yellow are tracked over 400 frames. Here, the algorithm was able to track all the active points and tracking results are shown in green. Again, the yellow points designate the intersection of small vessels not used in the registration process. Visual inspection shows that the yellow target points are tracked accurately and demonstrate the accuracy of the method over the entire frame. As was the case in the previous sequence, a surgical instrument appears in the last sample frame without affecting the tracking process.
Fig. 7.
Tracking of sample frames in one video sequence of patient 2.
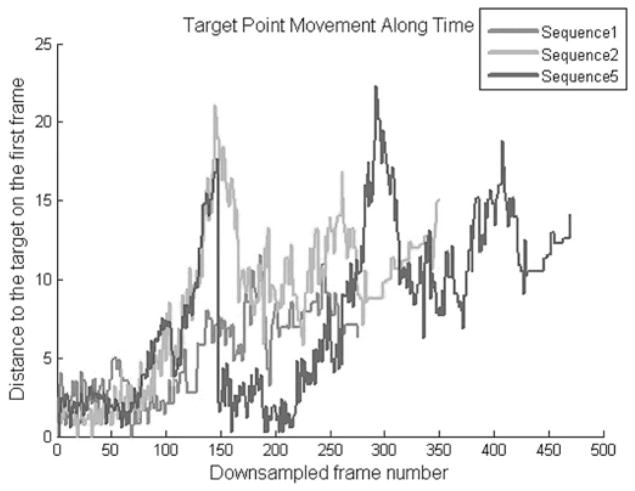
To provide the reader with a sense of the interframe and total motion observed in the sequences used herein, which is difficult to convey with static images, Fig. 8 plots the displacement of one voxel in each of three sequences pertaining to patient 1 (sequences 1, 2, and 5).
Fig. 8.
Frame-to-frame displacement of one landmark points in three sequences pertaining to patient 1 (sequences 1, 2, and 5).
D. Quantitative Evaluation
To evaluate the approach quantitatively, two measures have been used: the vessel tracking error (VTE) and the target registration error (TRE). The vessel tracking error is computed for vessel segments tracked from frame to frame and is defined as the average distance between the true vessel position and the position of the vessel found by the algorithm. To compute this error, a human operator first selects starting and ending points of vessel segments in the first frame of the sequence. These vessel segments are chosen such that they cover a major portion of the image. The vessel segmentation algorithm (see [12]) connects the starting and ending points to create the set of vessel segments that are tracked. The human operator also selects the starting and ending points for the same vessel segments in four additional frames positioned at 25%, 50%, 75%, and 100% of the sequence. Both the vessel segments selected by the human operator and those produced by the algorithm on these frames are then parameterized. N equidistant samples with N equal to the number of active points for a segment are subsequently selected on corresponding segments. This produces two sets of homologous points Vi and Ui. VTE is defined as
| (5) |
i.e., it is the mean Euclidean distance between homologous points on vessel segments. The target registration error [25] is the registration error obtained for points that are not used to register the frames. These are points, typically intersections of small vessels, which are selected by the human operator in the first frame and then in the four other frames in which the vessels have been selected (see selected points in Figs. 6 and 7). While selecting the target points, magnification of the images was allowed. To evaluate target localization error, a few sequences were chosen on which landmarks were selected several times. Target localization error was subvoxel and considered to be negligible. For those points, the target registration error is defined as follows:
| (6) |
Where Xi and Yi are the points selected in the first frame and the four sampled frames, respectively. T is the transformation obtained by concatenating all the elementary transformations obtained from tracking each frame.
Table II lists the vessel tracking errors computed for the 21 video sequences. Sequences 1 to 7 pertain to patient 1, sequences 8 to 14 are to patient 2, and sequences 15 to 21 to patient 3. Results pertaining to patient 3 have been computed differently than those of patients 1 and 2. Rather than parameterizing vessel segments, we computed correspondence between manually segmented and automatically localized vessel segments using closest point distance. This metric is not sensitive to vessel translation. Unfortunately, data pertaining to patient 3 became unavailable for reprocessing due to disk failure. Based on our observations for the other two patients, our current distance measure adds, in average, one pixel to our previous measure. Overall statistics have thus been reported in two groups. The first contains patients 1 and 2, the other contains patient 3. The tracking error for each video sequence reported in the “mean” column is computed as the mean of the vessel tracking errors in the four sampled frames.
TABLE II.
VTE (In Pixels) for 21 Video Sequences
| 25 % | 50 % | 75 % | 100 % | Mean | Std | # V | # Frames | |
|---|---|---|---|---|---|---|---|---|
| 1 | 2.26 | 2.47 | 2.78 | 2.55 | 2.51 | 0.21 | 9 | 285 |
| 2 | 1.48 | 2.48 | 2.09 | 2.67 | 2.18 | 0.52 | 10 | 350 |
| 3 | 2.46 | 1.89 | 2.46 | 2.93 | 2.43 | 0.42 | 11 | 680 |
| 4 | 2.03 | 2.18 | 3.18 | 2.48 | 2.46 | 0.51 | 9 | 520 |
| 5 | 1.6 | 2.50 | 3.52 | 2.36 | 2.49 | 0.78 | 6 | 470 |
| 6 | 1.84 | 3.64 | 3.00 | 2.54 | 2.75 | 0.75 | 8 | 435 |
| 7 | 1.84 | 2.67 | 3.19 | 2.56 | 2.56 | 0.55 | 6 | 485 |
| 8 | 2.71 | 2.14 | 2.35 | 2.00 | 2.3 | 0.39 | 8 | 990 |
| 9 | 1.42 | 2.11 | 2.22 | 1.73 | 1.87 | 0.36 | 7 | 1190 |
| 10 | 2.46 | 2.0 | 3.64 | 4.54 | 3.16 | 1.15 | 6 | 585 |
| 11 | 2.79 | 2.83 | 2.14 | 2.63 | 2.59 | 0.31 | 6 | 815 |
| 12 | 2.40 | 2.12 | 1.44 | 1.71 | 1.91 | 0.42 | 6 | 945 |
| 13 | 2.11 | 2.56 | 2.95 | 2.29 | 2.47 | 0.36 | 5 | 925 |
| 14 | 3.11 | 2.04 | 2.58 | 2.71 | 2.61 | 0.44 | 8 | 1275 |
| 15 | 1.18 | 1.15 | 1.71 | 1.59 | 1.41 | 0.29 | 7 | 160 |
| 16 | 0.44 | 0.84 | 1.37 | 1.31 | 0.99 | 0.35 | 7 | 210 |
| 17 | 1.16 | 1.24 | 1.65 | 1.36 | 1.35 | 0.39 | 7 | 180 |
| 18 | 1.54 | 1.42 | 1.79 | 3.39 | 2.04 | 0.15 | 5 | 165 |
| 19 | 0.85 | 1.49 | 2.08 | 1.15 | 1.38 | 0.53 | 6 | 180 |
| 20 | 1.02 | 1.69 | 1.05 | 1.17 | 1.23 | 0.17 | 7 | 220 |
| 21 | 0.82 | 0.94 | 1.04 | 0.97 | 0.94 | 0.32 | 8 | 340 |
| patient 1 and 2 | Overall mean | 2.45 | overall std | 0.58 | ||||
| patient 3 | Overall mean | 1.33 | overall std | 0.54 | ||||
Across the 14 sequences for which we compute the VTE as described above, the mean VTE is 2.45 pixels with a standard deviation of 0.58 pixels. With the spatial resolution of the images, this leads to a mean VTE of 0.3 (high resolution sequences) or 0.6 (low resolution sequences) mm. The second column from the right shows the number of vessel segments tracked in each of the video sequences. This number varies from 11 in sequences in which a large number of vessels are visible, e.g., sequence 3, to 5 in sequences in which only a few vessels are visible, e.g., sequence 13. The number of vessel segments across sequences for a particular subject may change, e.g., from sequence 1 to sequence 7. This is due to the fact that videos are taken over long periods of time at different phases of the procedure. Because of this, some vessels may disappear because of the resection or be covered by cotton pads during the entire sequence; these vessels cannot be tracked in the sequence. The last column in the table is the number of frames in each video sequence.
In Table III, TRE is reported for all the video sequences. As was done above, the average TRE for each video sequence reported in the “mean” column is computed as the mean of the target registration errors in the four sampled frames. The overall mean (3.34 pixels), median (2.88 pixels), and standard deviation (1.52 pixels) of the TRE are also reported. The overall mean TRE is thus approximately 0.4 or 0.8 mm, depending on the spatial resolution of the images. As expected, the TRE is larger than the VTE because it is computed with points that are not used to estimate the transformations used to register the frames. The last column of the table shows the number of target points that have been selected for each of the video sequences. Again, more points have been selected on some sequences than others because some sequences have more vessels and thus more identifiable target points than others. As many as 15 points have been selected for some sequences, e.g. sequence 19. The lowest number of target points is 6 for sequence 10. For this sequence, one also observes that the TRE is relatively large. In this sequence, the microscope was focused on the bottom of the cavity left after the resection. The cortical surface was thus blurry, which affected the accuracy of the tracking algorithm.
TABLE III.
TRE (in Pixels) for 21 Video Sequences
| 25% | 50% | 75% | 100% | Mean | Std | # Targets | |
|---|---|---|---|---|---|---|---|
| 1 | 1.77 | 2.1 | 2.54 | 2.29 | 2.18 | 0.32 | 11 |
| 2 | 1.85 | 2.19 | 2.9 | 2.09 | 2.26 | 0.45 | 13 |
| 3 | 1.97 | 2.36 | 2.83 | 1.43 | 2.15 | 0.59 | 11 |
| 4 | 3.32 | 4.2 | 2.76 | 5.5 | 3.95 | 1.19 | 8 |
| 5 | 1.97 | 2.3 | 2.61 | 2.37 | 2.31 | 0.26 | 8 |
| 6 | 2.34 | 4.17 | 2.94 | 3.28 | 3.18 | 0.76 | 10 |
| 7 | 2.13 | 2.74 | 2.33 | 2.57 | 2.44 | 0.27 | 10 |
| 8 | 2.05 | 5.91 | 5.11 | 4.06 | 4.28 | 1.67 | 8 |
| 9 | 1.86 | 2.91 | 3.72 | 4.79 | 3.32 | 1.24 | 9 |
| 10 | 7.79 | 9.7 | 8.62 | 6.26 | 8.09 | 1.45 | 6 |
| 11 | 3.24 | 3.03 | 2.77 | 3.09 | 3.03 | 0.2 | 7 |
| 12 | 2.18 | 2.57 | 2.62 | 2.7 | 2.52 | 0.23 | 9 |
| 13 | 2.88 | 5.09 | 4.88 | 3.72 | 4.14 | 1.04 | 8 |
| 14 | 2.04 | 3.46 | 5.82 | 5.34 | 4.17 | 1.74 | 6 |
| 15 | 1.86 | 2.11 | 2.91 | 2.84 | 2.43 | 0.52 | 13 |
| 16 | 2.55 | 3.64 | 2.3 | 2.39 | 2.72 | 0.62 | 13 |
| 17 | 3.67 | 1.67 | 3.49 | 4.13 | 3.24 | 1.08 | 13 |
| 18 | 3.52 | 2.81 | 2.85 | 3.44 | 3.16 | 0.38 | 13 |
| 19 | 4.51 | 3.99 | 1.98 | 1.99 | 3.12 | 1.32 | 15 |
| 20 | 3.47 | 3.13 | 2.88 | 2.71 | 3.05 | 0.33 | 14 |
| 21 | 2.95 | 5.04 | 4.88 | 4.79 | 4.42 | 0.98 | 13 |
| overall mean | 3.34 | overall median | 2.88 | ||||
| overall std | 1.52 | average # of targets | 10 | ||||
E. Parameter Sensitivity Test
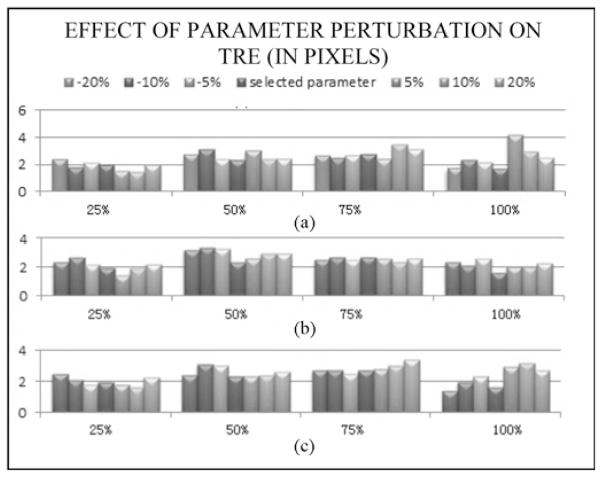
Three main parameters need to be selected in our approach: the profile radius r, the searching threshold sr, and the similarity threshold. These were selected heuristically on a few sequences and then used without modification on others. To illustrate the sensitivity of the results on the parameter values one sequence was first selected (sequence # 3). The algorithm was then applied to this sequence with parameter values ranging from 80% to 120% of the original values. Parameter values were perturbed sequentially. Fig. 9 shows the TRE values that were obtained on the four evaluation frames used for this sequence. These results show that, albeit some variations can be observed when the parameters are adjusted, the results remain within a tight range.
Fig. 9.
TRE values obtained for sequence #3 when perturbing the value of the three main parameters used in the algorithm: profile radius (top panel), searching radius (middle panel), and threshold (bottom panel). In each case values were perturbed in an 80%–120% range.
V. Discussion
In this paper, a method has been proposed to track brain motion in video streams. Coupled with a laser range scanner, this will potentially permit estimating intraoperative brain shift automatically. The results we have presented indicate that this method is capable of tracking vessels even when surgical instruments obscure parts of the images. It is relatively simple, which makes it fast and applicable in real time (a MATLAB implementation takes about one second per frame but the algorithm does not need to be applied to every frame). The method has been used on 21 video sequences comprising 11,405 frames. As the results demonstrate, the method is able to track the features in all of these sequences accurately. Tracking was less accurate in one of the sequences in which the cortical surface was blurry because the microscope was focused on deeper brain structures.
Comparison of the proposed algorithm with work by Paul et al. [21], [22] is difficult without direct application of our methods to their data; however, we believe that our work is substantially different. In their work, a surface is created from video pairs and then registered to surfaces acquired at different times. Isolated points are tracked from frame to frame using a Kalman filter. An advantage of this approach is that it permits modeling the interframe motion. We circumvent the need for surface registration by using a laser range scanner that provides us with both a 2-D image and the 3-D coordinates of the pixels in this image. We also rely on the entire vessel and on frame-to-frame registration for tracking rather than on a few isolated pixels. The fact that we register the entire frame based on the available information allows us to compute a transformation that is relatively accurate over occluded regions and to wait for points to become visible again to refine the transformation over these regions. Paul et al. report that their method is robust to occlusion. It is difficult to compare their results with ours because we could not ascertain from the results they report which points were occluded and for how long.
As discussed in the background section, the goal of this work is to use intraoperative video sequences to register laser range scanner images obtained at somewhat distant intervals during the procedure. To the best of our knowledge, this is the first attempt at doing so and the method described herein is a step in that realization but work remains. For example, while it has been shown that tracking vessels within a continuous video stream is achievable, tracking discontinuous sequences that are separated by relatively long intervals may require an additional intersequence registration step. Because the intraoperative microscope is currently not tracked, intersequence registration necessitates first computing a transformation to correct for differences in pose or magnification between sequences, which can be done by localizing a few common points in both sequences and computing a global transformation. If the last frame in a sequence and the first frame in the next sequence are very different, for example, if the first sequence is acquired with the cortex intact and the next one after tumor resection, manual localization of a few vessels visible in both sequences may be required. The advantage of the laser range scanner is the fact that it produces accurate cortical surfaces but it also requires an additional piece of equipment in the operating room. While the cost of a laser scanner is modest and acquiring an LRS image from time to time is minimally disruptive, the integration of the process in the clinical flow and the assessment of its impact on the surgical process remain to be done. This will require integrating the processing of the LRS images and video images into the same framework as well as designing the user interfaces required to interact with the images. Indeed, even though work is underway to adapt methods we have developed for the automatic segmentation of vessels in laser scan images [26] to video images, our experience indicates that a certain amount of user interaction will be necessary to select which among the segmented vessels should be used for tracking. Vessels located on top of the resection site in the preresection images would be, for instance, poor candidates for tracking.
While challenges remain, the results presented in this article suggest the value of intraoperative surgical microscope data. Coupling the tracking of microscope video sequences with 3-D laser range scan data to characterize deformation during surgery could provide a detailed understanding of the changes in the “active surgical” surface that are at the focus of therapy.
Acknowledgments
This work is funded by National Institute for Neurological Disorders and Stroke Grant R01 NS049251.
The authors thank Vanderbilt University Medical Center, Department of Neurosurgery, and the operating room staff for providing the recorded operating microscope video images.
Biographies
Siyi Ding received the Ph.D. degree from Vanderbilt University, Nashville, TN, in 2011.
Currently she is an Algorithm Engineer in KLA-Tencor. Her primary research interest includes image modeling, registration and defect detection, especially for high-resolution images.

Michael I. Miga (M’98) received the B.S., and M.S. degrees in Mechanical Engineering from the University of Rhode Island Kingston, RI, in 1992, and 1994, respectively. He received the Ph.D. degree from Dart-mouth College, Hanover, NH, in 1998, concentrating in Biomedical Engineering.
He joined the Department of Biomedical Engineering, Dartmouth College, in the 2000, and is currently an Associate Professor. He is the director of the Biomedical Modeling Laboratory, which focuses on developing new paradigms in detection, diagnosis, characterization, and treatment of disease through the integration of computational models into research and clinical practice.
Tom Pheiffer received the B.S. degree in Biosystems Engineering from Clemson University, Clemson, SC, in 2007, and the M.S. degree in Biomedical Engineering from Vanderbilt University, Nashville, TN, in 2010. He is currently working toward the Ph.D. degree in Biomedical Engineering at Vanderbilt and his interest is in multimodal image-guided surgery.

Amber Simpson received her Ph.D. degree in Computer Science from Queen’s University, Kingston, ON, Canada, in 2010, concentrating on the computation and visualization of uncertainty in computer-aided surgery.
She joined the Department of Biomedical Engineering, Vanderbilt University, Nashville, TN, in late 2009 as a Research Associate in the Biomedical Modeling Laboratory, Department of Biomedical Engineering, Vanderbilt University.

Reid C. Thompson is currently William F. Meacham Professor and Chairman of Neurological Surgery at Vanderbilt University Medical Center, Nashville, TN.
He has served as the Director of Neurosurgical Oncology and Director of the Vanderbilt Brain Tumor Center for 10 years. His previous clinical appointments have been at Cedars-Sinai Medical Center, and he had carried out a Fellowship in Cerebrovascular Neurosurgery at Stanford University, and completed his Residency in Neurosurgery at Johns-Hopkins University Medical Center.
Benoit M. Dawant (M’88–SM’03–F’10) received the MSEE degree from the University of Louvain, Louvain, Belgium, in 1983, and the Ph.D. degree from the University of Houston, Houston, TX, in 1988.
He has been on the faculty of the Electrical Engineering and Computer Science Department at Vanderbilt University, Nashville, TN, since 1988, where currently he is a Professor. His main research interests are medical image processing and analysis. His current projects include the development of systems for the placement of deep brain stimulators used for the treatment of Parkinson’s disease and other movement disorders, for the placement of cochlear implants used to treat hearing disorders, for tumor resection assistance, or for the creation of radiation therapy plans for the treatment of cancer.
Footnotes
Part of this work has been presented in IEEE International Symposium on Biomedical Imaging in 2009 [19].
Color versions of one or more of the figures in this paper are available online at http://ieeexplore.ieee.org.
Contributor Information
Siyi Ding, Electrical Engineering Department, Vanderbilt University, Nashville, TN 37212 USA.
Michael I. Miga, Biomedical Engineering Department, Vanderbilt University, Nashville, TN 37212 USA.
Thomas S. Pheiffer, Biomedical Engineering Department, Vanderbilt University, Nashville, TN 37212 USA
Amber L. Simpson, Biomedical Engineering Department, Vanderbilt University, Nashville, TN 37212 USA
Reid C. Thompson, Neurosurgery Department, Vanderbilt University Medical Center, Nashville, TN 37212 USA
Benoit M. Dawant, Email: benoit.dawant@vanderbilt.edu, Electrical Engineering Department, Vanderbilt University, Nashville, TN 37212 USA.
References
- 1.Nauta HJ. Error assessment during ‘image guided’ and ‘imaging interactive’ stereotactic surgery. Comput Med Imag Graph. 1994;18(4):279–287. doi: 10.1016/0895-6111(94)90052-3. [DOI] [PubMed] [Google Scholar]
- 2.Roberts DW, Hartov A, Kennedy FE, Miga MI, Paulsen KD. Intraoperative brain shift and deformation: A quantitative clinical analysis of cortical displacements in 28 cases. Neurosurgery. 1998;43(4):749–760. doi: 10.1097/00006123-199810000-00010. [DOI] [PubMed] [Google Scholar]
- 3.Hill DLG, Maurer CR, Maciunas RJ, Barwise JA, Fitzpatrick JM, Wang MY. Measurement of intraoperative brain surface deformation under a craniotomy. Neurosurgery. 1998;43(3):514–528. doi: 10.1097/00006123-199809000-00066. [DOI] [PubMed] [Google Scholar]
- 4.Miga MI, Paulsen KD, Lemery JM, Eisner S, Hartov A, Kennedy FE, Roberts DW. Model-updated image guidance: Initial clinical experience with gravity-induced brain deformation. IEEE Trans Med Imag. 1999 Oct;18(10):866–874. doi: 10.1109/42.811265. [DOI] [PubMed] [Google Scholar]
- 5.Roberts DW, Miga MI, Hartov A, Eisner S, Lemery JM, Kennedy FE, Paulsen KD. Intraoperatively updated neuroimaging using brain modeling and sparse data. Neurosurgery. 1999 Nov;45:1199–1207. [PubMed] [Google Scholar]
- 6.Skrinjar O, Nabavi A, Duncan J. Model-driven brain shift compensation. Med Image Anal. 2002 Dec;6:361–373. doi: 10.1016/s1361-8415(02)00062-2. [DOI] [PubMed] [Google Scholar]
- 7.Miga MI, Sinha TK, Cash DM, Galloway RL, Weil RJ. Cortical surface registration for image-guided neurosurgery using laser range scanning. IEEE Trans Med Imag. 2003 Aug;22(8):973–985. doi: 10.1109/TMI.2003.815868. [DOI] [PMC free article] [PubMed] [Google Scholar]
- 8.Dumpuri P, Thompson RC, Dawant BM, Cao A, Miga MI. An atlas-based method to compensate for brain shift: Preliminary results. Med Image Anal. 2007 Apr;11(2):128–145. doi: 10.1016/j.media.2006.11.002. [DOI] [PMC free article] [PubMed] [Google Scholar]
- 9.Cao A, Thompson RC, Dumpuri P, Dawant BM, Galloway RL, Ding S, Miga MI. Laser range scanning for image-guided neurosurgery: Investigation of image-to-physical space registrations. Med Phys. 2008 Apr;35:1593–1605. doi: 10.1118/1.2870216. [DOI] [PMC free article] [PubMed] [Google Scholar]
- 10.Sinha TK, Dawant BM, Duay V, Cash DM, Weil RJ, Thompson RC, Weaver KD, Miga MI. A method to track cortical surface deformations using a laser range scanner. IEEE Trans Med Imag. 2005 Jun;24(6):767–781. doi: 10.1109/TMI.2005.848373. [DOI] [PMC free article] [PubMed] [Google Scholar]
- 11.Ding S, Miga MI, Thompson RC, Dumpuri P, Cao A, Dawant BM. Estimation of intra-operative brain shift using a laser range scanner. Proc Ann Int Conf IEEE Eng Med Biol Soc. 2007:848–851. doi: 10.1109/IEMBS.2007.4352423. [DOI] [PubMed] [Google Scholar]
- 12.Ding S, Miga MI, Noble JH, Cao A, Dumpuri P, Thompson RC, Dawant BM. Semiautomatic registration of pre- and postbrain tumor resection laser range data: Method and validation. IEEE Trans Biomed Eng. 2009 Mar;56(3):770–780. doi: 10.1109/TBME.2008.2006758. [DOI] [PMC free article] [PubMed] [Google Scholar]
- 13.Nakajima S, Atsumi H, Kikinis R, Moriarty TM, Metcalf DC, Jolesz FA, Black PM. Use of cortical surface vessel registration for image-guided neurosurgery. Neurosurgery. 1997;40(6):1201–1210. doi: 10.1097/00006123-199706000-00018. [DOI] [PubMed] [Google Scholar]
- 14.Sun H, Lunn KE, Farid H, Wu Z, Hartov A, Paulsen KD. Stereopsis-guided brain shift compensation. IEEE Trans Med Imag. 2005 Feb;24(8):1039–1052. doi: 10.1109/TMI.2005.852075. [DOI] [PubMed] [Google Scholar]
- 15.Skrinjar OM, Duncan JS. Stereo-guided volumetric deformation recovery. Proc IEEE Int Symp Biomed Imag. 2002:863–866. [Google Scholar]
- 16.DeLorenzo C, Papademetris X, Vives KP, Spencer D, Duncan JS. Combined feature/intensity-based brain shift compensation using stereo guidance. Proc IEEE Int Symp Biomed Imag. 2006:335–338. [Google Scholar]
- 17.DeLorenzo C, Papademetris X, Wu K, Vives KP, Spencer D, Duncan JS. Lecture Notes in Computer Science. Vol. 4190. Berlin, Germany: Springer-Verlag; 2006. Nonrigid 3D brain registration using intensity/feature information; pp. 932–939. [DOI] [PMC free article] [PubMed] [Google Scholar]
- 18.DeLorenzo C, Papademetris X, Staib LH, Vives KP, Spencer DD, Duncan J. Nonrigid intraoperative cortical surface tracking using game theory. Proc IEEE Int Conf Comput Vis. 2007 Oct;:1–8. [Google Scholar]
- 19.Ding S, Miga MI, Thompson RC, Dawant BM. Robust vessel registration and tracking of microscope video images in tumor resection neurosurgery. Proc IEEE Int Symp Biomed Imag. 2009 Jun;:976–983. [Google Scholar]
- 20.Paul P, Quere A, Arnaud E, Morandi X, Jannin P. A surface registration approach for video-based analysis of intraoperative brain surface deformations. presented at the Workshop on Augmented Environments for Medical Imaging and Computer-Aided Surgery; Copenhagen, Denmark. Oct. 2006. [Google Scholar]
- 21.Paul P, Morandi X, Jannin P. A surface registration method for quantification of intraoperative brain deformations in image-guided neurosurgery. IEEE Trans Inf Technol Biomed. 2009 Nov;13(6):976–983. doi: 10.1109/TITB.2009.2025373. [DOI] [PubMed] [Google Scholar]
- 22.Rohde GK, Dawant BM, Lin SF. Correction of motion artifact in cardiac optical mapping using image registration. IEEE Trans Biomed Eng. 2005 Feb;52(2):338–341. doi: 10.1109/TBME.2004.840464. [DOI] [PubMed] [Google Scholar]
- 23.Frangi AF, Niessen WJ, Vincken KL, Viergever MA. Lecture Notes in Computer Science. Vol. 1496. Berlin, Germany: Springer-Verlag; 1998. Multi-scale vessel enhancement filtering; p. 130137. [Google Scholar]
- 24.Wahba G. Spline Models for Observational Data. Philadelphia, PA: Society for Industrial and Applied Mathematics; 1990. [Google Scholar]
- 25.Fitzpatrick JM, West JB, Maurer CR. Predicting error in rigid body point-based registration. IEEE Trans Med Imag. 1998 Oct;17(5):692–702. doi: 10.1109/42.736021. [DOI] [PubMed] [Google Scholar]
- 26.Ding S, Miga MI, Thompson RC, Garg I, Dawant BM. Automatic segmentation of cortical vessels in pre- and post-tumor resection laser range scan images. Proc SPIE. 2009;7261:726104–726108. [Google Scholar]


