

Abstract
Background
The adenoma detection rate (ADR) is one of the main quality measures for colonoscopy, but it is burdensome to calculate and is not amenable to claims-based reporting.
Objective
To validate the correlation between polypectomy rates (PRs) and ADRs by using a large group of endoscopists.
Design
Retrospective study.
Setting
Community and academic endoscopy units in the United States.
Subjects
Sixty endoscopists and their patients.
Main outcome measurements
Proportion of patients with any adenoma and any polyp removed; correlation between ADRs and PRs.
Results
In total, 14,341 screening colonoscopies were included, and there was high correlation between endoscopists’ PRs and ADRs in men (Rs .91, P < .0001) and women (Rs .91, P < .0001). Endoscopists with PRs in the highest quartile had a significantly higher ADR than did those in the lowest quartile in men (44.6% vs 19.4%, P < .0001) and women (33.6% vs 11.6%, P < .0001). Endoscopists in the top polypectomy quartile also found more advanced adenomas than did endoscopists in the bottom quartile (men: 9.6% vs 4.6%, P = .0006; women: 6.3% vs 3.0%, P = .01). Benchmark PRs of 40% and 30% correlated with ADRs greater than 25% and 15% for men and women, respectively.
Limitation
Retrospective analysis of a subset of a national endoscopic database.
Conclusions
Endoscopists’ PRs correlate well with their ADRs. Given its clinical relevance, its simplicity, and the ease with which it can be incorporated into claims-based reporting programs, the PR may become an important quality measure.
Despite a decline in the incidence of colorectal cancer in recent years,1 variable adenoma detection rates (ADRs),2–5 marginal right colon cancer protection,6 and suboptimal postcolonoscopy colorectal cancer rates7–10 highlight the need to examine colonoscopy quality. The ADR is accepted as one of the most important quality measures for colonoscopy,11,12 and a high ADR is associated with decreased interval colorectal cancer.8 Unfortunately, measuring the ADR can be a time-consuming and cumbersome process: measurement requires waiting for histology data, periodically reviewing both endoscopy reports and pathology reports for individual patients, and then analyzing these data by gender. Another major limitation of the ADR is that it is not amenable to claims-based reporting, and therefore it is not incorporated into incentive-based programs such as the Physician Quality Reporting System.
The polypectomy rate (PR) is much easier to measure than the ADR and is calculable with claims data. Furthermore, a recent study using administrative data found that a high PR is associated with decreased right-sided colon cancer.7 In a prior small study, we showed a high correlation between PR and ADR and also pro- posed benchmark PRs of 40% in men and 30% in women (comparable to ADR benchmarks of 25% in men and 15% in women).13 In our prior work, we examined a relatively small number of endoscopists at a single academic institution.
In this study, we aimed to validate the correlation between PRs and ADRs, using a larger, more diverse group of endoscopists. Additionally, we sought to identify benchmark PRs for men and women that correlate with established ADR benchmarks for men and women.
METHODS
CORI database
We used the Clinical Outcomes Research Initiative (CORI) database to identify eligible patients and endoscopists. The CORI database is a multicenter endoscopic database; during the study period the CORI consortium included approximately 400 endoscopists at 64 practice sites in 25 different states. Participating endoscopists use a standardized endoscopy report generator to create endoscopy reports, and the data are transmitted electronically to a central data repository. Seventeen sites transmitted a minimum of 75% of their histology data to the repository and were eligible for inclusion in this analysis. These sites represent approximately 24% of the colonoscopy reports received during the study period. CORI is a patient de-identified database and is approved by the Oregon Health and Sciences University Institutional Review Board. Additional institutional review board approval for this study of the CORI database was not required.
Inclusion and exclusion criteria
Colonoscopies from the CORI sites described above with the indication cited as “average risk screening” were eligible. Procedures performed in patients under the age of 50 or in which the endoscopist did not reach the cecum were excluded. Additionally, procedures performed by endoscopists who performed fewer than 50 average-risk screening colonoscopies during the study period were excluded.
Variables and definitions
The endoscopists provided patients’ demographic data (age, sex, race/ethnicity) and also rated the bowel preparation quality. The options included excellent; good; fair—examination adequate; fair—examination compromised; or poor. CORI determined the type of practice setting (community, academic, or health maintenance organization) for each practice and its corresponding endoscopists. Pathology data were submitted to CORI by each practice site.
Endoscopist-level data were calculated after the patient-level data were collected. The PR for an endoscopist was defined as the proportion of procedures in which at least 1 polypoid lesion was seen and some or all of this tissue was sent for pathologic examination after biopsy or snare removal. The ADR was defined as the proportion of procedures in which at least 1 adenoma was detected as documented by the pathology report. Additionally, for each endoscopist, we examined the proportion of patients with an advanced adenoma detected (adenoma ≥10 mm, with a villous component, high-grade dysplasia, or cancer) and the mean number of polyps per patient. We calculated all of these rates based on each endoscopist’s male patients and female patients separately to determine gender-specific benchmarks.
Statistical analysis
To test the relationship between endoscopists’ PRs and ADRs in men and women, we used the Spearman rank correlation coefficient. To determine benchmark PRs for men, we plotted the ADR for men against the PR for men, created a least-squares regression line, and found the point on the regression line that corresponded to an ADR of 25%. A similar process was used for women to find the PR corresponding to an ADR of 15%. To evaluate differences in lesion detection between groups of endoscopists above and below benchmark PRs, we used the 2 test and analysis of variance. We also classified endoscopists by their PRs into quartiles and calculated the mean PR, ADR, and advanced ADR for each quartile. The analyses were performed by using SAS v 9.2 software (SAS Institute, Inc, Cary, NC) and Microsoft Office Excel 2007 (Microsoft, Redmond, WA).
RESULTS
From 2005 to 2006, 128,419 colonoscopies were performed on unique male patients at participating CORI sites, and 31,016 were performed at sites that submitted pathology results. There were 8479 colonoscopies in which the indication was average-risk screening. After the exclusion of incomplete procedures and ineligible patients and endoscopists, 7022 procedures in men remained. During the same period, 129,251 colonoscopies were per- formed on unique female patients at participating CORI sites, and 29,144 were performed at eligible sites. The indication for colonoscopy was average-risk screening in 8796 colonoscopies. Once ineligible patients, endoscopists, and procedures were excluded, there were 7319 colonoscopies in women.
Table 1 shows the patient and procedure characteristics. The mean age of male patients was 60.7 (standard deviation, 8.4) and the mean age of female patients was 61.2 years (standard deviation, 8.7). Approximately 90% of all patients were white, and bowel preparation quality was rated as excellent or good in 65.8% of men and 68.8% of women.
Table 1.
Characteristics of study patients
| Characteristic | Male Patients n = 7, 022 | Female Patients n = 7,319 |
|---|---|---|
| Mean age, years (SD) | 60.7 (8.4) | 61.2 (8.7) |
| Age group, years (%) | ||
| 50–59 | 54.3 | 52.5 |
| 60–69 | 30.1 | 30 |
| 70–79 | 13.4 | 14.7 |
| >80 | 2.3 | 2.9 |
| Caucasian (%) | 89.6 | 90.6 |
| Excellent or Good Bowel Prep (%) | 65.8 | 68.8 |
Percentages may not add to 100 due to rounding.
Table 2 shows the characteristics of the study endoscopists. There were 60 unique endoscopists for the male patients and 53 unique endoscopists for the female patients. After the exclusion of ineligible endoscopists, 14 unique practice sites were included in the analysis. In the male cohort, the mean number of colonoscopies performed by endoscopists over the study period was 462, and the mean number of screening colonoscopies in this group was 117. For the female cohort, the corresponding numbers were 598 and 138, respectively. The majority of endoscopists were associated with community practices (78% in men and 87% in women), with smaller numbers of endoscopists from health maintenance organizations or academic practice sites.
Table 2.
Characteristics of Study Endoscopists
| Characteristic | Male Patients n = 7, 022 | Female Patients n = 7,319 |
|---|---|---|
| Number of endoscopists | 60 | 53 |
| Colonoscipies per endoscopist, mean (SD) | 462 (255) | 598 (297) |
| Screening colonoscopies per endoscopist, mean (SD) | 117 (68) | 138 (82) |
| Number of practice sites | 14 | 13 |
| Practice Setting, No (%) | ||
| Community | 47 (78.3%) | 46 (86.8%) |
| HMO | 8 (13.3%) | 1 (1.9%) |
| Academic | 5 (8.4%) | 6 (11.3%) |
We plotted the PR and ADR for each endoscopist in male and female patients (Figures 1 and 2, respectively). The correlation between PR and ADR was very strong for both men (Rs 0.91, P < .0001) and women (Rs 0.91, P < .0001). Using a linear regression line, we found that to achieve an ADR of 25% in men, endoscopists needed a PR of 36.7%. To achieve an ADR of 15% in women, endoscopists needed a PR of 26.7%.
Figure 1.
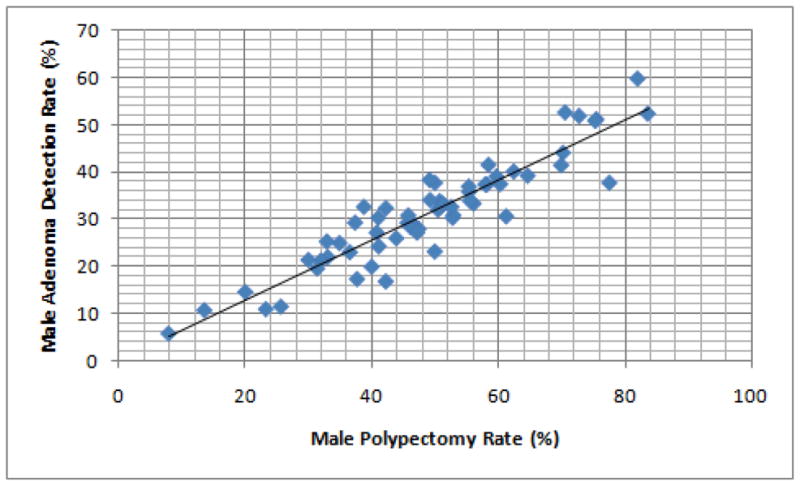
Correlation between adenoma detection rate (ADR) and polypectomy rate (PR) in men, among study endoscopists. The Spearman rank correlation coefficient (rs) demonstrates a good correlation between ADR and PR.
Figure 2.
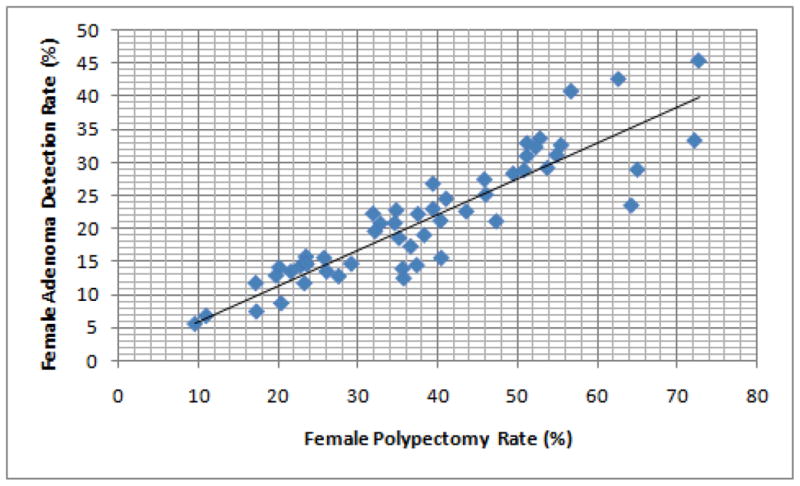
Correlation between adenoma detection rate (ADR) and polypectomy rate (PR) in women, among study endoscopists.
Endoscopists were sorted into quartiles according to their PRs; Table 3 shows the mean PR, ADR, advanced adenoma detection, and number of polyps per patient for each quartile. In men, the mean PR for endoscopists in the lowest quartile (29.2%) was significantly lower than for endoscopists in quartile 2 (44.7%, P < .0001), quartile 3 (53.4%, P < .0001), and quartile 4 (69.7%, P < .0001). Similarly, the mean ADR for endoscopists in the lowest quartile (19.4%) was also significantly lower than for endoscopists in quartile 2 (28.2%, P < .0009), quartile 3 (33.4%, P < .0001), and quartile 4 (44.6%, P < .0001). The advanced ADR for endoscopists in the top quartile was significantly higher than the advanced ADR for the lowest quartile (9.6% vs 4.6%, P = .0006). There was a trend toward more advanced adenomas found by endoscopists in the second and third quartiles compared with the lowest quartile, but this did not reach statistical significance. The mean number of polyps per patient also increased for endoscopists in the higher PR quartiles. For endoscopists in the lowest quartile, the mean number of polyps per patient was 0.48 compared with 0.74 in quartile 2 (P = .0004), 0.96 in quartile 3 (P < .0001), and 1.6 in quartile 4 (P < .0001).
Table 3.
Performance Measures in men according to endoscopists’ polypectomy rate, in quartiles
| Measure | Endoscopist Group | |||
|---|---|---|---|---|
| Quartile 1 | Quartile 2 | Quartile 3 | Quartile 4 | |
| PR ≤ 39% | PR 40–50% | PR 51–58% | PR ≥59% | |
| Mean PR, % | 29.2 | 44.7* | 53.4* | 69.7* |
| Mean ADR, % | 19.4 | 28.2* | 33.4* | 44.6* |
| Mean Advanced Adenoma rate, % | 4.6 | 5.4 | 5.8 | 9.6* |
| Mean No. of polyps per subject | 0.8 | 0.74* | 0.96* | 1.6* |
Indicates statistical significance, compared to quartile 1 values
P values were calculated using the fourth quartile as the reference group.
Values refer to the MEAN value for all the endoscopists in each polypectomy quartile Advanced adenomas defined as adenomas ≥ 10mm or with villous features, high grade dyplasia, or adenocarcinoma
Similar patterns for lesion detection emerged in the female patients (Table 4). The mean PR for endoscopists in the lowest quartile (19.6%) was also significantly lower than the PR in the higher quartiles: quartile 2 (32.2%, P < .0001), quartile 3 (42.2%, P < .0001), and quartile 4 (58.3%, P < .0001). The mean ADR for endoscopists in the bottom quartile (11.6%) was also lower than for those in quartile 2 (17.3%, P < .0005), quartile 3 (22.4%, P < .0001), and quartile 4 (33.3%, P < .0001). When the lowest quartile group was used for comparison, there was a trend toward greater advanced adenoma detection in the higher polypectomy quartile groups, but this reached statistical significance only in the highest polypectomy quartile (6.3% vs 3.0%, P = .01). The mean number of polyps per patient also increased in endoscopists in higher PR quartile groups. For endoscopists in the lowest quartile, the mean number of polyps per patient was 0.29 compared with 0.49 in quartile 2 (P = .0001), 0.65 in quartile 3 (P < .0001), and 1.1 in quartile 4 (P < .0001).
Table 4.
Performance Measures in women according to endoscopists’ polypectomy rate, in quartiles
| Measure | Endoscopist Group | |||
|---|---|---|---|---|
| Quartile 1 | Quartile 2 | Quartile 3 | Quartile 4 | |
| PR ≤26% | PR 27–37% | PR 38–51% | PR > 51% | |
| Mean PR, % | 19.6 | 32.2* | 42.2* | 58.3* |
| Mean ADR, % | 11.6 | 17.3* | 22.4* | 33.3* |
| Mean Advanced Adenoma rate, % | 3.0 | 3.3 | 4.4 | 6.3* |
| Mean No. of polyps per subject | 0.29 | 0.49* | 0.65* | 1.1* |
Indicates statistical significance, compared to quartile 1 values
P values were calculated using the fourth quartile as the reference group.
When endoscopists were each evaluated comparing their PR and ADR quartiles, there was good agreement, with a weighted kappa of 0.73 (95% CI, 0.61–0.86) in men and a weighted kappa of 0.77 (95% CI, 0.67–0.88) in women (data not shown). The similar assessments of performance found by using either endoscopists’ PR and ADR quartiles also remained when endoscopists’ attainment of PR and ADR benchmarks were compared. Of the 60 study endoscopists in the male cohort, 45 reached the proposed benchmark PR of at least 40% in men. Of these 45 endoscopists, 41 (91%) also attained the established ADR bench- mark for men (25%). Of the 53 endoscopists in the female cohort, 36 reached the proposed benchmark PR of 30% in women. Of these 36 endoscopists, 33 (92%) met the established ADR benchmark in women.
In the top portion of Table 5, the endoscopists are dichotomized according to whether they attained the proposed benchmark PR in men (40%). The mean ADR and advanced ADRs are shown for endoscopists reaching the benchmark and those who did not. Endoscopists reaching the benchmark PR found more adenomas (35.4% vs 19.4%, P < .0001). More importantly, endoscopists reaching the benchmark PR also found more advanced adenomas (7.0% vs 4.6%, P = .037) than did those endoscopists who did not reach this benchmark.
Table 5.
Adenoma and Advanced Adenoma detection among endoscopists, according to whether endoscopists reached gender-specific benchmark polypectomy rates
| Males | |||
|---|---|---|---|
| Male PR ≥ 40% N = 45 |
Male PR < 30% N = 15 |
P value | |
| ADR, % | 35.4 | 19.4 | <.0001 |
| Advanced Adenoma rate, % | 7.0 | 4.6 | .037 |
| Females | |||
| Female PR ≥ 30% N = 36 | Female PR < 30% N = 17 | P value | |
| ADR, % | 25.7 | 12.2 | <.0001 |
| Advanced Adenoma rate, % | 5.0 | 2.9 | .015 |
In the bottom portion of Table 5, similar data are presented for female patients. In women, endoscopists reaching the proposed benchmark PR of 30% had a higher ADR (25.7% vs 12.2%, P < .0001). In women as well, more patients were found to have advanced adenomas (5.0% vs 2.9%, P = .015) by endoscopists reaching the benchmark PR than by endoscopists who did not reach the bench-mark value.
DISCUSSION
Emphasis is growing on measuring and improving the quality of medical care, including procedures such ascolonoscopy.14–22 The ADR is a valuable metric of colonoscopy quality, but it has some significant limitations as the primary means of measuring the quality of colonoscopy services. Aside from the time lag between performance of the colonoscopy and receipt of pathology data needed to calculate the ADR, our current billing system does not incorporate ADRs. As a result, the ADR cannot be used in increasingly important claims-based quality reporting programs like the Physician Quality Reporting System. Additionally, the absence of linkage between most endowriters and pathology databases means that calculation of the ADR requires going back and forth between endoscopy reports and pathology reports. Consequently, calculation of endoscopists’ ADR can be a cumbersome, labor-intensive process that often requires significant resources and is not particularly efficient. Using a large database, we found that PRs correlated strongly with ADRs. Endoscopists with a PR of 40% in men and 30% in women almost always reached the recommended ADR benchmarks of 25% and 15%, respectively and, more importantly, found more advanced lesions.
The findings in this present study mirror the findings in our previous work, done with a smaller number of patients and endoscopists at a single academic institution.13 In their single-institution study, Francis et al23 also found a similar relationship between PR or polyp detection rate and ADR. Beyond simply finding an association between PR and ADR, our previous work also detected a strong correlation between PR and the number of adenomas per patient.13 Furthermore, there was a trend toward greater detection of large adenomas and advanced adenomas among endoscopists reaching benchmark PRs, but that trend did not reach statistical significance. In the present study, there was a statistically significant difference in advanced adenoma detection among endoscopists who reached benchmark PRs and those who did not. Others have argued that polyp detection without polypectomy or biopsy by itself may be used as a quality measure.24,25 However, this practice would measure only seeing a polyp, not its removal, and could potentially lead to gross inaccuracies as a surrogate for ADR, especially in settings where colonoscopy is not done by well-trained experts.
The large number of patients and the large number of endoscopists are important strengths of this study. Another strength of the study deals with the type of endoscopists included. Many studies of quality involve endoscopists at academic institutions, but in this study, the vast majority of endoscopists were community based. One limitation is that the data were gleaned from colonoscopies performed 5 to 6 years ago, around the time when societies were just beginning to make recommendations regarding colonos-copy quality indicators. The impact of this limitation may be minimal, inasmuch as the data in this study were very similar to the data collected in our previous work, which was based on more recent data. Another limitation is that although CORI is a national database, only certain sites submit pathology reports. Previous analysis has shown that the CORI pathology cohort is similar to the CORI consortium with respect to demographics.26 Also, the wide spectrum of performance in this study and the inclusion of over 14,000 patients, 60 endoscopists, and 14 different practice sites suggest that its generalizability extends beyond a particular institution or a narrow group of endoscopists. An additional limitation is the fact that approximately 90% of patients undergoing colonoscopy in this study were white. Although the correlation between ADR and PR may be very similar in other racial/ethnic groups, it is also possible that the correlation may be weaker or stronger in these different groups. At present, some have recommended screening African Americans at younger ages than the general population, but no ADR benchmarks are specific to race or ethnicity.
The use of the PR as a quality measure offers several advantages. First, the PR has been shown to correlate with clinically relevant outcomes (eg, ADR, advanced adenoma detection, number of adenomas per patient, and proximal interval colon cancer). Second, the PR can be calculated by using administrative data or claims data. In essence, it is a measure that is already collected by endoscopists whenever they bill for their procedures. Unlike diagnosis billing codes, procedure billing codes are quite accurate when compared with the clinical record.27 The use of claims data means that potentially, quality data can be both quickly and easily collected and transmitted without the expense of excessive additional financial resources or time. In fact, in the study by Baxter et al,7 administrative claims data were used to demonstrate that high PR was associated with lower proximal interval colon cancer. Third, the PR is available as soon as the procedure is complete; avoiding the time lag required by ADR means immediate feedback for the endoscopist. Fourth, the PR is a simple, user-friendly measure that can be monitored easily by individual endoscopists, even without claims data.
Although the PR offers several advantages as a quality measure, it also has potential disadvantages. Perhaps the most concerning disadvantage of PR as a measure of quality is the potential for an endoscopist to artificially boost his or her PR by increasing the removal rates of small, very likely clinically insignificant polyps (or even normal tissue). Unnecessary polypectomy could potentially lead to additional direct and indirect costs (exposure of patients to more complications). If this occurred on a large scale, it could also weaken the value of PR as a quality measure (ie, lessen the positive predictive value of reaching a PR benchmark). The risk of artificially improving a quality measure or “gaming” the system is possible with PR but is also possible with withdrawal time, cecal intubation, and many other quality measures. Even ADR has the potential for erroneous reporting because it must be generated internally within the endoscopy practice and is difficult to externally validate (the external entity would need access to both endoscopy and pathology reports for each patient), whereas PR may be externally calculated, using claims data. Furthermore, within the current fee-for-service healthcare environment, there is already a risk of endoscopists gaming the system with respect to PRs (greater reimbursement with each procedure in which a polypectomy occurs). Ultimately, the degree of gaming that occurs with PR or any other measure is limited by the magnitude of the incentive gained and the presence or absence of any checks or balances. For PR, this could be accomplished by relatively infrequent audits of the ADR as a check against gaming.
In summary, using a large national database, we found that endoscopists’ PRs correlated well with their ADRs and predicted their detection of advanced adenomas as well. We also confirmed that previously identified PR benchmarks correspond to existing ADR benchmarks. The PR holds potential as a quality measure because it is clinically relevant, user-friendly, and simple to calculate both for individual endoscopists and within our existing billing system. Unlike ADR, the PR is also measurable with the International Classification of Diseases 10 diagnosis codes, which will soon be implemented in the United States. Future studies should assess whether administrative data accurately capture this clinical relationship as well. If the administrative data accurately reflect the clinical data, they could have a significant impact on the measurement of colonoscopy quality. The PR is not a perfect measure, but a perfect measure does not exist. Further refinements in polyp-based measures, such as right-sided polyp detection, number of polyps, or detection by size, should be evaluated in the future. If the PR is used in conjunction with other measures, it may prove very useful in quality measurement. The refinement of these measurement strategies will allow for greater attention to identifying reliable methods of improving endoscopists’ quality.
Abbreviations
- ADR
adenoma detection rate
- CORI
Clinical Outcomes Research Initiative
- PR
polypectomy rate
Footnotes
DISCLOSURE: Dr. Faigel was supported in part by an American Society for Gastrointestinal Endoscopy (ASGE) Quality in Endoscopy Research Award and NIDDK U01DK57132. The Clinical Outcomes Research Initiative (CORI) received support from NIDDK U01DK57132 and from the following commercial entities: AstraZeneca, Novartis, Bard International, Pentax USA, ProVation, Endosoft, GIVEN Imaging, and Ethicon. The commercial entities had no involvement in this research. All authors disclosed no financial relationships relevant to this publication.
References
- 1.Edwards BK, Ward E, Kohler BA, et al. Annual report to the nation on the status of cancer, 1975–2006, featuring colorectal cancer trends and impact of interventions (risk factors, screening, and treatment) to reduce future rates. Cancer. 2010;116:544–73. doi: 10.1002/cncr.24760. [DOI] [PMC free article] [PubMed] [Google Scholar]
- 2.Barclay RL, Vicari JJ, Doughty AS, et al. Colonoscopic withdrawal times and adenoma detection during screening colonoscopy. N Engl J Med. 2006;355:2533–41. doi: 10.1056/NEJMoa055498. [DOI] [PubMed] [Google Scholar]
- 3.Rex DK, Cutler CS, Lemmel GT, et al. Colonoscopic miss rates of adenomas determined by back-to-back colonoscopies. Gastroenterology. 1997;112:24–8. doi: 10.1016/s0016-5085(97)70214-2. [DOI] [PubMed] [Google Scholar]
- 4.Chen SC, Rex DK. Endoscopist can be more powerful than age and male gender in predicting adenoma detection at colonoscopy. Am J Gastroenterol. 2007;102:856–61. doi: 10.1111/j.1572-0241.2006.01054.x. [DOI] [PubMed] [Google Scholar]
- 5.Pickhardt PJ, Nugent PA, Mysliwiec PA, et al. Location of adenomas missed by optical colonoscopy. Ann Intern Med. 2004;141:352–9. doi: 10.7326/0003-4819-141-5-200409070-00009. [DOI] [PubMed] [Google Scholar]
- 6.Brenner H, Hoffmeister M, Arndt V, et al. Protection from right- and left- sided colorectal neoplasms after colonoscopy: population-based study. J Natl Cancer Inst. 2010;102:89–95. doi: 10.1093/jnci/djp436. [DOI] [PubMed] [Google Scholar]
- 7.Baxter NN, Sutradhar R, Forbes SS, et al. Analysis of administrative data finds endoscopist quality measures associated with postcolonoscopy colorectal cancer. Gastroenterology. 2011;140:65–72. doi: 10.1053/j.gastro.2010.09.006. [DOI] [PubMed] [Google Scholar]
- 8.Cooper GS, Xu F, Koroukian S, et al. Prevalence and predictors of new or missed colorectal cancer: a population based, United States study. Gastroenterology. 2010;138:S-24. [Google Scholar]
- 9.Kaminski MF, Regula J, Kraszewska E, et al. Quality indicators for colonoscopy and the risk of interval cancer. N Engl J Med. 2010;362:1795–803. doi: 10.1056/NEJMoa0907667. [DOI] [PubMed] [Google Scholar]
- 10.Bressler B, Paszat LF, Chen Z, et al. Rates of new or missed colorectal cancers after colonoscopy and their risk factors: apopulation-based analysis. Gastroenterology. 2007;132:96–102. doi: 10.1053/j.gastro.2006.10.027. [DOI] [PubMed] [Google Scholar]
- 11.Rex DK, Petrini JL, Baron TH, et al. Quality indicators for colonoscopy. Gastrointest Endosc. 2006;63:S16–28. doi: 10.1016/j.gie.2006.02.021. [DOI] [PubMed] [Google Scholar]
- 12.Rex DK, Bond JH, Winawer S, et al. Quality in the technical performance of colonoscopy and the continuous quality improvement process for colonoscopy: recommendations of the U.S. Multi-Society Task Force on Colorectal Cancer. Am J Gastroenterol. 2002;97:1296–308. doi: 10.1111/j.1572-0241.2002.05812.x. [DOI] [PubMed] [Google Scholar]
- 13.Williams JE, Le TD, Faigel DO. Polypectomy rate as a quality measure for colonoscopy. Gastrointest Endosc. 2011;73:498–506. doi: 10.1016/j.gie.2010.08.008. [DOI] [PubMed] [Google Scholar]
- 14.McGlynn EA, Asch SM, Adams J, et al. The quality of health care delivered to adults in the United States. N Engl J Med. 2003;348:2635–45. doi: 10.1056/NEJMsa022615. [DOI] [PubMed] [Google Scholar]
- 15.Lieberman D. Quality in medicine: raising the accountability bar. Gastrointest Endosc. 2011;73:561–6. doi: 10.1016/j.gie.2011.01.004. [DOI] [PubMed] [Google Scholar]
- 16.Lieberman D. A call to action: measuring the quality of colonoscopy. N Engl J Med. 2006;355:2588–9. doi: 10.1056/NEJMe068254. [DOI] [PubMed] [Google Scholar]
- 17.Petersen BT. Demand the data! Your patients will ask and your practice will need it. Am J Gastroenterol. 2007;102:862–3. doi: 10.1111/j.1572-0241.2007.01050.x. [DOI] [PubMed] [Google Scholar]
- 18.Rex DK. Quality in colonoscopy: cecal intubation first, then what? Am J Gastroenterol. 2006;101:732–4. doi: 10.1111/j.1572-0241.2006.00483.x. [DOI] [PubMed] [Google Scholar]
- 19.Chassin MR, Loeb JM, Schmaltz SP, et al. Accountability measures: using measurement to promote quality improvement. N Engl J Med. 2010;363:683–8. doi: 10.1056/NEJMsb1002320. [DOI] [PubMed] [Google Scholar]
- 20.Inadomi JM. In search of quality colonoscopy. Gastroenterology. 2008;135:1845–7. doi: 10.1053/j.gastro.2008.11.003. [DOI] [PubMed] [Google Scholar]
- 21.Faigel DO, Cotton PB World Organization of Digestive Endoscopy. The London OMED position statement for credentialing and quality assurance in digestive endoscopy. Endoscopy. 2009;41:1069–74. doi: 10.1055/s-0029-1215279. [DOI] [PubMed] [Google Scholar]
- 22.Hewett DG, Rex DK. Improving colonoscopy quality through healthcare payment reform. Am J Gastroenterol. 2010;105:1925–33. doi: 10.1038/ajg.2010.247. [DOI] [PubMed] [Google Scholar]
- 23.Francis DL, Rodriguez-Correa DT, Buchner A, et al. Application of a con- version factor to estimate the adenoma detection rate from the polyp detection rate. Gastrointest Endosc. 2011;73:493–7. doi: 10.1016/j.gie.2011.01.005. [DOI] [PubMed] [Google Scholar]
- 24.Denis B, Sauleau EA, Gendre I, et al. The polyp detection rate can replace the adenoma detection rate to assess the yield of colonoscopy in current practice [abstract] Gastrointest Endosc. 2010;71:AB326. [Google Scholar]
- 25.Hilsden RJ, Rostom A, Dube C, et al. Is polyp detection rate a valid proxy for adenoma detection rate for measuring the technical quality of colonoscopy? Gastroenterology. 2010;138:S-57. [Google Scholar]
- 26.Lieberman D, Moravec M, Holub J, et al. Polyp size and advanced histology in patients undergoing colonoscopy screening: implications for CT colonography. Gastroenterology. 2008;135:1100–5. doi: 10.1053/j.gastro.2008.06.083. [DOI] [PMC free article] [PubMed] [Google Scholar]
- 27.Ko CW, Dominitz JA, Green P, et al. Accuracy of Medicare claims for identifying findings and procedures performed during colonoscopy. Gastrointest Endosc. 2011;73:447–53. doi: 10.1016/j.gie.2010.07.044. [DOI] [PMC free article] [PubMed] [Google Scholar]