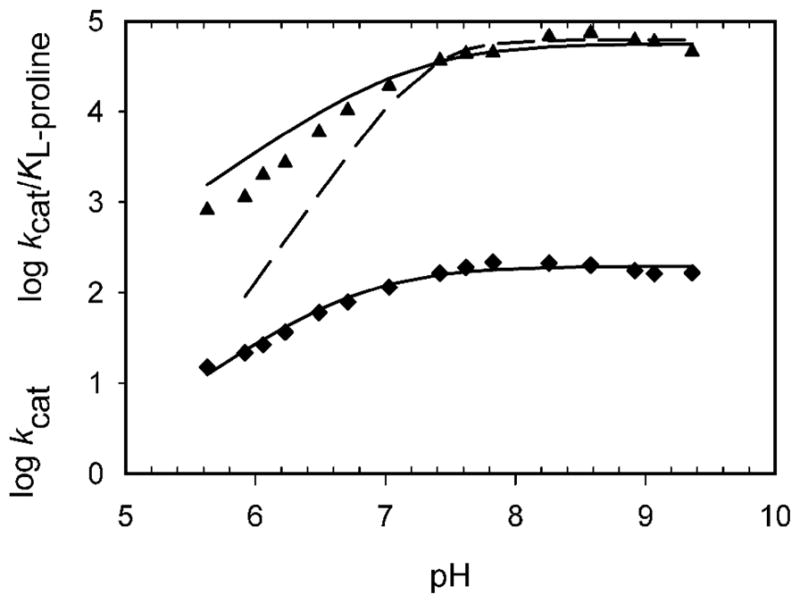
Figure 2.

pH dependence of ProDH. kcat(app) (●) and kcat/KL-pro(app) (▲), determined at saturating DCPIP and varying L-proline concentrations. The solid lines are fits to eq 3, yielding a pKa of 6.8 ± 0.1 for kcat(app) and 7.1 ± 0.2 for kcat/KL-pro(app). The dashed line in the kcat/KL-pro pH profile represents a fit where two groups must be deprotonated.
