
Figure 4.
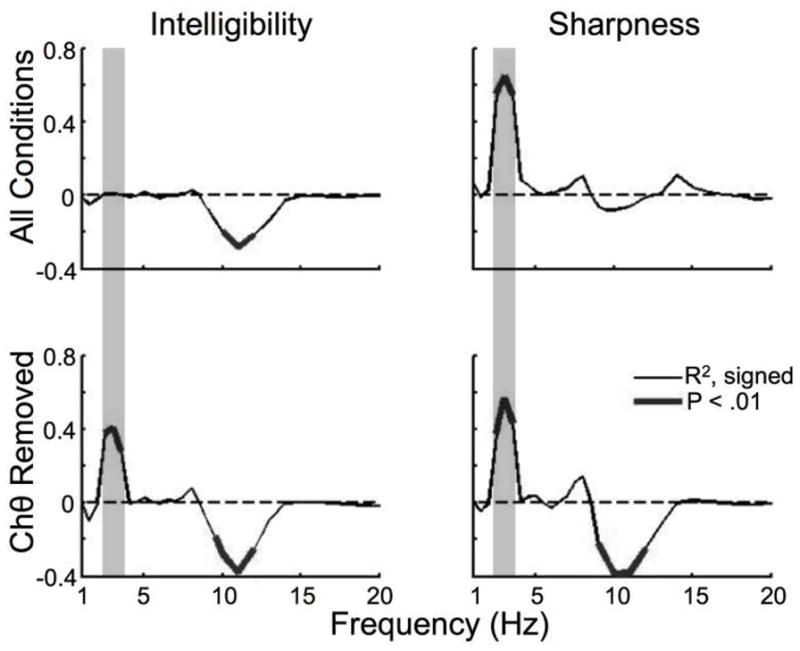
Cerebro-acoustic coherence. CACoh at the syllabic rate of the materials used here (2.5–4 Hz) correlates with both sharpness (right panels) and intelligibility (left). Right panels. Signed R2 values for correlation between CACoh and sharpness. Thick line shows Bonferroni corrected at p < .01. Shaded region shows frequency range of interest. Correlation is robust with inclusion of all stimuli. Left Panels. Correlation between CACoh and Intelligibility ratings. Legend same as right. Correlation at syllabic rate only with inclusion of stimuli containing acoustic-phonetic information.