

Abstract
Thioredoxin reductase (TR) is an oxidoreductase responsible for maintaining thioredoxin in the reduced state, thereby contributing to proper cellular redox homeostasis. The C-terminal active site of mammalian TR contains the rare amino acid selenocysteine, which is essential to its activity. Alterations in thioredoxin-reductase activity due to changes in cellular redox homeostasis are found in clinical conditions such as cancer, viral infection, and various inflammatory processes, and quantification of thioredoxin-activity can therefore be a valuable indicator of clinical conditions. Here we describe a new, direct assay (termed the SC-TR assay) to determine the activity of TR based upon the reduction of selenocystine, a diselenide-bridged amino acid. Rather than being an end-point assay as is in older methods, the SC-TR assay directly monitors the continuous consumption of NADPH at 340 nm by TR as it reduces selenocystine. The SC-TR assay can be used in a cuvette using traditional spectrophotometry, or as a 96-well plate based format using a plate reader. In addition, the SC-TR assay is compatible with the use of non-ionic detergents, making it more versatile than other methods using cell lysates.
Keywords: Thioredoxin reductase, assay, redox homeostasis
INTRODUCTION
The mammalian thioredoxin reductase system is composed of thioredoxin reductase (TR), thioredoxin (Trx), and NADPH. The thioredoxin system, along with the glutaredoxin system, functions as a major antioxidant system in the cell [1]. Mammalian TR is a homodimeric, pyridine nucleotide oxidoreductase that contains the rare amino acid selenocysteine (Sec, U) in the C-terminal catalytic center of the enzyme [2, 3]. The molecular weight of each TR monomer of the head-to-tail dimer is approximately 55 kDa and each subunit contains a FAD prosthetic group that utilizes NADPH as the source of hydride [4]. Trx is the primary TR substrate, and acts as the carrier of reducing equivalents to multiple protein targets within the cell that include ribonucleotide reductase, methionine sulfoxide reductase, protein disulfide isomerase, peroxiredoxins, and multiple transcription factors. [5].
Both TR and Trx are up-regulated in diseases such as cancer, viral infection, and inflammation [6-9]. As such, the detection of TR and Trx in biological tissues and fluids can be useful as a marker of oxidative stress in disease states [10, 11]. The relative abundance of TR and Trx can be detected by either immunoblot analysis or from the activity of TR in cell lysates [11-13]. Detection by immunoblotting is both expensive and time-consuming and does not quantify enzyme activity. Current detection methods of TR enzymatic activity are indirect [11,12], as the primary approach relies on the reduction of the disulfide bonds of insulin added to cell lysates by Trx; Trx in turn is reduced by TR, which uses NADPH as the ultimate source of electrons for the reduction. The newly reduced thiol groups of insulin are then free to react with 5,5 -dithio-bis(2-nitrobenzoic acid) (DTNB) producing a visible, yellow color that can be detected at 412 nm by spectrophotometry. This assay was originally developed for cell lysates as an end-point assay that measures the number of free thiol groups formed by the reduction of insulin [12, 13]. Because it is an end-point assay it can be described as a discontinuous assay as it does not continuously monitor the consumption of NADPH by the thioredoxin system. In this discontinuous mode, the reaction is quenched with a chaotrope such as guanidinium hydrochloride and background activity comes from exposed protein thiol groups that react with DTNB. This assay has been adapted as a continuous assay by commercial sources that makes use of the DTNB-reductase activity of TR [14]. One disadvantage of the commercial, continuous assay is that the cell contains other NADPH oxidoreductases that are capable of reducing DTNB, such as lipoamide dehydrogenase and glutathione reductase [15, 16], and thereby contribute to relatively high background activity that can range from 15-40% [14].
Here we report on the development of a new continuous, direct and highly specific assay of TR in cell lysates that makes use of the reduction of selenocystine (Figure 1). We have termed this assay the SC-TR assay. Selenocystine is a small, commercially available diselenide-containing amino acid that to the best of our knowledge can only be reduced by TR. The SC-TR assay can be performed by either standard spectrophotometry or adapted for use in a 96-well plate format. One advantage of this simple, easy to use assay is that the selenocystine-reductase activity of TR can be measured in the presence of non-ionic detergents such as NP-40, which is a common non-ionic detergent used in a wide variety of buffers to lyse mammalian cells. In our hands the use of NP-40 or other non-ionic detergents inhibit activity in the original insulin endpoint assay. Our report herein demonstrates the utility of the assay as well as the specificity of the reduction of selenocystine by TR by the use of siRNA knockdown, TR overexpression, and inhibition by acrolein, a highly specific selenol-modifying reagent.
Figure 1.
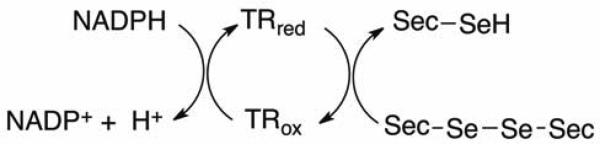
Reduction of selenocystine catalyzed by TR. The ultimate source of reducing equivalents comes from NADPH. The reaction can be monitored by the decrease in absorbance at 340 nm.
MATERIALS AND METHODS
Materials
Selenocystine was purchased from Acros Organics (Morris Plains, New Jersey). All other reagents were purchased from either Fisher Scientific (Fair Lawn, NJ) or Sigma-Aldrich (St. Louis, MO) and were of reagent grade or better. CMRL and DMEM-F12 cell culture media was from Corning Cellgro (Manassas, VA). Wild type TR1 plasmid (WT-TR1) was purchased from Ori-Gene (Rockville, MD, SKU: SC107562). TR1 primers were purchased from Integrated DNA Technologies (Coralville, IA). TR1 si-RNA was designed and purchased from Dharmacon (Pittsburgh, PA). Anti-TR1 antibody was purchased from Santa Cruz Biotechnology, Inc (Dallas, TX) and anti-Trx1 antibody was purchased from AbFrontier (Seoul, Korea). Anti-actin antibody, secondary antibodies, and Enhanced Chemiluminescent™ were purchased from Millipore (Billerica, MA). Auranofin was a gift from Pamela Cassidy of the University of Utah.
Preparation of selenocystine solution
L-selenocystine was purchased from Acros Organics as a technical grade yellow powder, and we recommend that the technical grade material be recrystallized. For recrystallization, the yellow crystals were dissolved in a minimal amount of 6 N HCl and then impurities removed with Whatman filter paper and a Buchner funnel. The filtrate was bright yellow, and next 10 N NaOH was added until yellow crystals appeared; the pH of the solution was then adjusted to 6 – 6.5 and the yellow crystals collected by filtration. The crystals were dried in an oven at 50° C until the crystals did not clump together. Failure to dry the crystals results in an inaccurate gravimetric determination, resulting in inaccurate solution concentrations for the assay. Racemic selenocystine can also be used in the assay as TR reduces both L-selenocystine and racemic selenocystine with equal efficiencies [17]. Because L-selenocystine has very limited solubility in water and does not dissolve easily in aqueous buffer at neutral pH, a 45.3 mM solution of L-selenocystine first was prepared by dissolving 15.3 mg of L-selenocystine in 200 L of 1 N NaOH. To this solution was added 100 L of 1 N HCl and then the solution was diluted to a 1 mL final volume with ddH2O that is first filtered through 0.22 m filters. The selenocystine was used at a final concentration of 800 μM in the assay.
Cell Culture
C10 mouse lung epithelial cells were maintained in CMRL cell culture media supplemented with 10% fetal bovine serum (FBS), 200 mM glutamine, and 0.5% penicillin streptomycin and propagated in a humidified incubator at 37°C and 5% CO2. Cells were trypsinized and re-plated to obtain 75% confluence on the following day for all subsequent experiments. Human malignant mesothelioma (HM, H2373) and immortalized but non-transformed mesothelial (LP9) cells were maintained in DMEM-F12 with hydrocortisone, insulin, transferrin, and selenite with 10% FBS as previously described [18].
Selenocystine TR assay
Cells were plated into 60 mm tissue culture dishes and the following day were washed with ice-cold 1X phosphate buffered saline (PBS) and lysed in the culture dish by adding either TE Buffer (50 mM Tris/HCl pH 7.5, 1 mM EDTA) or NP-40 lysis buffer (150 mM NaCl, 50 mM Tris pH 8.0, 1% NP-40, 1 g/mL leupeptin, 1 g/mL aprotinin, 1 mM NaF, 1 mM NaVO3, 1 mM PMSF) as indicated in the text. Cell lysates were scraped from culture dishes on ice and transferred to 1.5 mL microcentrifuge tubes. TE buffer lysates were sonicated at 4 °C for 30 sec with 1-2 sec pulses using a sonic dismembrator. TE and NP-40 lysates were centrifuged for 10 min at 14,000 rpm at 4 °C and protein concentrations of the supernatants were determined by reading the absorption at 595 nm of Bradford reagent. A total reaction volume of 100 l was assembled in a clear 96-well round bottom microplate containing the following: (i) master mix containing 1 mM NADPH and 2 mM selenocystine (SC) in ddH2O (addition of 40 l of master mix to 100 l reaction volume yields final concentrations of 400 M and 800 M respectively), (ii) 25 g or the largest practical amount of protein, (iii) TE or NP-40 lysis buffer. Controls for each sample included protein only control, protein and NADPH control, and protein and SC control. Control master mixes contained: (i) 2 mM NADPH in ddH2O (addition of 20 l to 100 l reaction volume yields final concentration of 400 M), (ii) 2 mM SC prepared as described above (addition of 40 l to 100 l reaction volume yields final concentration of 800 M). An example of the typical reaction setup is given in Table 1.
Table 1.
Volumes of reaction components for selenocystine assay.
| Sample | Reaction components | |||
|---|---|---|---|---|
| Experimental | Protein Control | NADPH Control | SC Control | |
| 1 | 25.5 L protein | 25.5 L protein | 25.5 L protein | 25.5 L protein |
| 34.5 L lysis buffer | 74.5 L lysis buffer | 54.5 L lysis buffer | 34.5 L lysis buffer | |
| 40 L master mix | 20 L NADPH | 40 l SC solution | ||
| 2 | 21.3 L protein | 21.3 L protein | 21.3 L protein | 21.3 L protein |
| 38.7 L lysis buffer | 78.7 L lysis buffer | 58.7 L lysis buffer | 38.7 L lysis buffer | |
| 40 L master mix | 20 L NADPH | 40 L SC solution | ||
| 3 | 31 L protein | 31 L protein | 31 L protein | 31 L protein |
| 29 L lysis buffer | 69 L lysis buffer | 49 L lysis buffer | 29 L lysis buffer | |
| 40 L master mix | 20 L NADPH | 40 L SC solution | ||
Each master mix was separately placed into a clean, sterile pipet basin and pipetted quickly into the wells of a 96-well microplate with a multichannel pipetter making sure to avoid bubbles. This approach was used in order that each sample was exposed to the master mix at the same time to ensure homogeneity of results. The plate was read in 30 sec intervals over a 20 min time period at 340 nm on a Synergy HT Microplate Reader™ (BioTek). Because the assay monitors the consumption of NADPH at 340 nm, an activity can be calculated by using Beer's Law and an extinction coefficient of 6,220 M−1 cm−1 for NADPH. The activity can be reported as mol NADPH consumed per min. Bradford assays for total protein concentration determination can be performed directly in each well of the 96-well plate (data not shown). If this is done, then the activity can be reported as mol NADPH consumed per min per mg of total protein. For the data presented in Figures 2 and 5, we define 1 unit of TR activity as the amount of TR that will consume 1 nmol of NADPH per min.
Figure 2.

Comparison of the end-point TR assay to SC-TR assay. A) TR activity in C10 whole cell lysates measured with the discontinuous end-point TR assay. Acrolein completely inhibits TR activity. B) TR activity in lysates from (A) measured using the SC-TR assay by monitoring the conversion of NADPH to NADP+ (A340) over time in a spectrophotometer. The activity is 0.35 nmol/min or 11.7 U/mg. Acrolein completely inhibits TR activity. C and D) Overexpression of TR1 and TR2 in C10 cells increases TR activity as measured by both the end-point (C) and SCTR assay (D). The activity of the control reaction in (D) is 0.13 nmol/min or 4.4 U/mg, while the activity of the over expressed enzyme is 0.27 nmol/min or 8.9 U/mg.
Figure 5.

TR expression and activity in human malignant mesothelioma cell and human mesothelial lysates. A) TR1 and Trx1 protein expression in LP9 mesothelial cells, HM cells, and H2373 malignant mesothelioma cells. Actin is used as a loading control. B) Densitometry of immunoblot signals normalized to actin expression (* p<0.05**p<0.01, ***p<0.001, Student's t-test) C) TR activity measured using the SC-TR assay in 30 μg of protein from indicated cell lysates. The TR activity in LP9 mesothelial cells is 0.51 nmole/min or 17.U/mg. The TR activity in HM cells is 1.1 nmol/min or 35.6 U/mg. The TR activity in H2373 malignant mesothelioma cells is 1.14 nmol/min or 38 U/mg.
Discontinuous insulin end-point assay
Cell lysates were prepared in TE buffer as described above and the sonicated lysates were centrifuged for 10 min at 14,000 rpm at 4 °C. Supernatants were transferred to fresh 1.5 mL microcentrifuge tubes and protein concentrations were determined by a Bradford assay. A total reaction volume of 80 L was assembled by addition of 20 L master mix to 20 L of 25 M E. coli Trx solution. The master mix contained 50 mM Tris/Cl pH 7.5, 1 mM EDTA, 900 M NADPH (257 M final), and 4.5 mg/mL insulin (1.3 mg/mL final). An example of the reaction setup for this end-point assay is given in Table 2. After addition of all of the components to a cuvette, the reactions were incubated at room temperature for 60 min and terminated by the addition of 930 L of 6 M guanidine•HCL containing 1 mM 5,5 -dithio-bis(2-nitrobenzoic acid) (DTNB) solution prepared in ethanol; activity was detected by reading absorbance at 412 nm in a spectrophotometer. TR activity was determined by calculating the difference between identical samples +/- Trx. Here the activity is expressed as arbitrary units as determined by the raw A412 reading. Alternatively, the number of units can be calculated by using Beer's Law and an extinction coefficient of 13,600 M−1 cm−1 for the TNB anion. One unit of TR activity is the amount of enzyme catalyzing the reduction of 1 M of DTNB per min (formation of 2 mol TNB anion).
Table 2.
Insulin end-point assay reaction setup.
| Sample | Lysis buffer (L) | Lysate (L) | H2O (L) | Trx stock (L) | Master mix (L) |
|---|---|---|---|---|---|
| Blank + Trx | 40 | 0 | 0 | 20 | 20 |
| Blank - Trx | 40 | 0 | 20 | 0 | 20 |
| Sample #1 + Trx | 15 | 25 | 0 | 20 | 20 |
| Sample #1 - Trx | 15 | 25 | 20 | 0 | 20 |
| Sample #2 + Trx | 10 | 30 | 0 | 20 | 20 |
| Sample #2 -Trx | 10 | 30 | 20 | 0 | 20 |
TR over-expression and gene silencing
Full length TR1 was amplified from pCMV6-XL4 vector by PCR using specific forward (5 -GAAAGTCGAGGAGACAGTTAAGCATG-3 ) and reverse (5 -CACAAGGAAAGGTCATGCTAAAACTG-3 ) primers and subsequently cloned into pcDNA 3.1 mammalian expression vector. Insertion of WT-TR1 full-length cDNA, including the 3’ SECIS element, into pcDNA 3.1 was confirmed by sequencing using the appropriate forward and reverse primer sets (T7 Forward: BGH Reverse). WT-TR1 or empty pcDNA 3.1 vector were transfected into C10 cells according to manufacturer's protocol as previously described [19]. Specific siRNA to TR1 (si-TR1, 5 -CCAUAGAGGGCGAAUUUAAUU-3 ) and a control (“scramble”) RNA (5 -GCUCCUUUCGUCUCACAUAUU-3 ) were introduced into C10 cells following the manufacturers guidelines (Dharmacon).
Immunoblotting
Equal protein amounts from cell lysates were separated on 10% gels by SDS-PAGE. Proteins were transferred to PVDF membrane for immunoblotting, and membranes then were blocked in 5% milk (Tris buffered saline with 0.1% Tween, TBST) for 1 hr at room temperature. Anti-TR1 (1:1000) anti-Trx1 (1:2000) and anti-actin (1:5000) antibodies were diluted in 5% milk/TBST and incubated with membranes for 1 hr at room temperature. Membranes then were washed 5X with TBST and incubated with horseradish peroxidase (HRP) conjugated, secondary antibodies (1:5000) for 1 hr in 5% milk/TBST. Membranes were washed 5X with TBST and HRP secondary antibodies were detected using Enhanced Chemiluminescent™ solution and collected on X-ray film.
RESULTS AND DISCUSSION
Utility of the assay using selenocystine as substrate for TR
To investigate using selenocystine as a substrate for determining thioredoxin reductase (TR) activity in cell lysates we sought to compare the original insulin based method (referred to as end-point TR assay) to our alternative selenocystine TR assay (SC-TR assay). TR activity is determined in the SC-TR assay by monitoring the consumption of NADPH (340 nm) by TR in the reduction of selenocystine. Figure 2A shows the inhibition of total TR activity from C10 cell lysates by the selenol-modifying reagent acrolein using the end-point TR assay. Acrolein directly alkylates nucleophiles, especially cellular thiols, of critical enzymes leading to a drastic reduction in their activity [20, 21]. Using the same cellular lysate from Figure 2A, total TR activity was analyzed using the SC-TR assay. TR activity in untreated controls and complete inhibition of NADPH turnover in the presence of acrolein mimics the results of the end-point TR assay (Figure 2B). These findings indicate that alkylation of TR and possibly other enzymes by acrolein inhibited TR activity as measured by both types of assays.
Specificity of SC-TR assay to thioredoxin reductase-1
Cytosolic TR1 and mitochondrial TR2 both contribute to maintaining a reduced thioredoxin pool, with TR1 responsible for the majority of TR activity in whole cell lysates [22]. We therefore sought to determine the contribution of each type of TR to the reduction of selenocystine as measured in the SC-TR assay. C10 cells were transfected with TR1 and TR2 expression vectors and lysates were prepared in TE buffer to determine total TR activity 24 hrs after transfection (Figure 2C and D). Figure 2C shows an increase in total cellular TR activity using the end-point TR assay while Figure 2D shows a similar increase in TR activity as determined by the SC-TR assay. In both assays over expression of TR1 and TR2 was inhibited to an equal extent by acrolein (Figure 2C and D). Overexpression of TR2 alone did not show an increase in TR activity by either assay (data not shown). Unless mitochondria are isolated free from cytosolic TR1, the modest contribution of mitochondrial TR2 to total TR activity could not be evaluated, further confirming that the contribution of TR2 activity is quite small in whole cell lysates [22]. It is important to note that the buffers in commercially available mitochondrial isolation kits do not interfere with the SC-TR assay (unpublished work).
We further investigated the specificity of the SC-TR assay to cellular TR1 relative to the possible contributions made by other cellular enzymes by reducing the expression of TR1 protein using specific knockdown of TR1 by siRNA. Knockdown of TR1 by siRNA reduced the expression of TR1 for up to 48 hrs (Figure 3E) and reduced TR activity below control levels as measured using the SC-TR assay (Figure 3A). Conversely over-expression of cytosolic TR1 (Figure 3F) increased total cellular TR activity significantly over control levels (Figure 3A). To control for background activity as well as the contribution of the individual master mix constituents to the reaction, we also assayed protein only (Figure 3B), master mix only (Figure 3C) and NADPH only (Figure 3D). These control reactions showed no difference in A340 between the indicated experimental groups. Further, we confirmed that glutathione reductase, which reduces oxidized glutathione (GSSG) using NADPH, does not reduce selenocystine in vitro under the same experimental conditions that TR reduces selenocystine (data not shown). These data strongly suggest that the selenocystine-reductase activity measured in cell lysates is almost entirely due to TR activity and not other enzymatic activities. In addition, alterations in cellular TR protein expression levels correlate with selenocystine-reductase activity in cellular lysates.
Figure 3.

Specificity of SC-TR assay to TR. A) TR activity measured using the SC-TR assay in which TR1 protein expression has been reduced using si-RNA or increased with a TR1 mammalian expression vector. B-D) SC-TR assay with individual component controls, Protein only (B), master mix only (C), and NADPH only (D). E) Western blot of C10 cells transiently transfected with si-RNA against TR1 (si-TR1) or non-specific scrambled si-RNA (scram). (F)C10 cells transfected with pcDNA 3.1 control vector or increasing concentrations of TR1 expression plasmid. Actin is used as a loading control for E and F.
Versatility of SC-TR assay in tissue lysis buffers
The constituents of buffers used in studying cellular signaling pathways often is a limiting factor in downstream assays that an investigator can employ using a single cell lysate. Accommodating different buffer components while obtaining optimal protein recovery for different purposes can be time consuming and technically difficult. Therefore we compared TR activity in samples prepared from whole cells lysed with buffers with or without the detergent NP-40 (a commonly used non-ionic detergent used in numerous cell lysis buffers) or TE buffer. Previous work in our lab indicated that non-ionic detergent based lysis buffers are not compatible with the end-point TR assay (data not shown).
TR activity using the SC-TR assay was measured in lysates from cells treated with or without the specific TR inhibitor auranofin [23] that were prepared with either TE buffer (Figure 4A, left panel) or NP-40 buffer (Figure 4B, left panel). TR activity using the SC-TR assays was nearly identical in either buffer, and the sensitivity to auranofin was also equivalent. To control for any background TR activity not due to the reduction of selenocystine in cell lysates, assays were performed in the presence of master mix (see Materials and Methods) without selenocystine (Figure 4A and 4B, right panels). This result shows that without addition of selenocystine to cell lysates, there is little or no endogenous activity that contributes to consumption of NADPH. We conclude that the constituents of NP-40 lysis buffer, which also includes protease and phosphatase inhibitors, do not interfere with selenocystine-reductase activity in cell lysates, and suggest that this feature provides added flexibility for selecting lysis buffers that are compatible with a variety of downstream assays.
Figure 4.

Versatility of SC-TR assay with lysis buffer containing NP-40. A-B) TR activity of control or auranofin (Aur) treated C10 cell lysates prepared in TE buffer (A) or NP-40 lysis buffer (B). SC- TR assay in the presence of selenocystine (left panel) or without selenocystine (right panel).
TR activity in human mesothelial and malignant mesothelioma cell lines
As noted in the introduction, TR expression levels vary in numerous disease states and may contribute to the progression of these diseases. Differential expression of antioxidant proteins and metabolic reprogramming has been observed in a number of cancers that positively influences proliferation and survival [24]. Recently, the targeting of the altered redox status of cancerous tissues has been identified as a promising therapeutic target through pro-oxidant therapies that overwhelm the already increased tumor cell oxidative environment leading to cell death [25]. We used our SCTR assay to determine if TR activity is increased in malignant mesothelioma (MM) cells as compared to control LP9 mesothelial cells. This has previously been confirmed using the endpoint assay [26]. Using the SC-TR assay, TR1 and Trx1expression levels and total TR activity was measured in cell lysates prepared from MM cell lines (HM, H2373) and LP9 mesothelial cells. Immunoblots for TR1 expression showed MM cells have increased expression levels of TR1 as compared to LP9 cells (Figure 5A). Trx1 is also overexpressed in MM cells, although not to the levels of TR1 (Figure 5B). As a consequence of increased expression levels, TR activity is increased in MM cells compared to LP9 mesothelial control cells (Figure 5C). Using our SC-TR assay we can determine that MM cell lines have twice the TR activity as compared to control LP9 cells as quantified by the SC-TR assay (35.6 U/mg and 38 U/mg for HM and H2373 cells, respectively, compared to 17.1 U/mg for LP9 cells). These findings confirm our previously published results that TR expression levels correlate with activity in MM cells, and support the use of the SC-TR assay for determining total TR activity from whole cell lysates [26].
CONCLUSIONS
The data presented herein describe a new assay for quantifying TR activity in whole cell lysates. The SC-TR assay uses selenocystine as a substrate for TR specific reduction, which to our knowledge is not as substrate for other NADPH cellular reductases. NADPH is consumed during the course of this reaction and can be monitored by spectrophotometry using either a cuvette, or in a 96 well plate reader. The 96 well plate format allows for the analysis of multiple experimental parameters at once, making the SC-TR amenable to experimental formats that require high throughput. Distinct advantages of the SC-TR assay include: (i) compatibility with buffers that contain non-ionic detergents, (ii) being a continuous and direct assay that can be used in kinetic assays to calculate activity (iii) high specificity to TR, and (iv) being both less complex and less expensive to perform. Because the assay uses a direct substrate of TR, there is no need to supply exogenous Trx, insulin, and DTNB to the reaction mixture. We suggest that for many applications the SC-TR assay can substitute for the end-point TR assay and may be advantageous in many contexts due to its adaptability to high throughput conditions.
ACKNOWLEDGEMENT
We wish to acknowledge grant GM094172 from the National Institute of General Medical Science to RJH for funding this work. Brian Cunniff was supported by a UVM Department of Pathology fellowship. We also wish to thank the Advanced Genomic Technology Core of the Vermont Cancer Center DNA Analysis Facility for sequencing services.
Footnotes
Publisher's Disclaimer: This is a PDF file of an unedited manuscript that has been accepted for publication. As a service to our customers we are providing this early version of the manuscript. The manuscript will undergo copyediting, typesetting, and review of the resulting proof before it is published in its final citable form. Please note that during the production process errors may be discovered which could affect the content, and all legal disclaimers that apply to the journal pertain.
These studies were supported by National Institutes of Health Grant GM094172 to RJH.
REFERENCES
- 1.Holmgren A. Antioxidant function of thioredoxin and glutaredoxin systems. Antioxid. Redox Signal. 2000;2:811–820. doi: 10.1089/ars.2000.2.4-811. [DOI] [PubMed] [Google Scholar]
- 2.Bock A, Forchhammer K, Heider J, Leinfelder W, Sawers G, Veprek B, Zinoni F. Selenocysteine: the 21st amino acid. Mol. Microbiol. 1991;5:515–520. doi: 10.1111/j.1365-2958.1991.tb00722.x. [DOI] [PubMed] [Google Scholar]
- 3.Gladyshev VN, Jeang KT, Stadtman TC. Selenocysteine, identified as the penultimate C-terminal residue in human T-cell thioredoxin reductase, corresponds to TGA in the human placental gene. Proc. Natl. Acad. Sci. U.S.A. 1996;93:6146–6151. doi: 10.1073/pnas.93.12.6146. [DOI] [PMC free article] [PubMed] [Google Scholar]
- 4.Mustacich D, Powis G. Thioredoxin reductase. Biochem. J. 2000;346:1–8. [PMC free article] [PubMed] [Google Scholar]
- 5.Holmgren A, Lu J. Thioredoxin and thioredoxin reductase: Current research with special reference to human disease. Biochem. Biophys. Res. Commun. 2010;396:120–124. doi: 10.1016/j.bbrc.2010.03.083. [DOI] [PubMed] [Google Scholar]
- 6.Bertini R, Howard OM, Dong HF, Oppenheim JJ, Bizzarri C, Sergi R, Caselli G, Pagliei S, Romines B, Wilshire JA, Mengozzi M, Nakamura H, Yodoi J, Pekkari K, Gurunath R, Holmgren A, Herzenberg LA, Herzenberg LA, Ghezzi P. Thioredoxin, a redox enzyme released in infection and inflammation, is a unique chemoattractant for neutrophils, monocytes, and T cells. J. Exp. Med. 1999;189:1783–1789. doi: 10.1084/jem.189.11.1783. [DOI] [PMC free article] [PubMed] [Google Scholar]
- 7.Holmgren A, Lu J. Thioredoxin and thioredoxin reductase: Current research with special reference to human disease. Biochem. Biophys. Res. Commun. 2010;396:120–124. doi: 10.1016/j.bbrc.2010.03.083. [DOI] [PubMed] [Google Scholar]
- 8.Gromer S, Urig S, Becker K. The thioredoxin system, from science to clinic. Med. Res. Rev. 2004;24:40–89. doi: 10.1002/med.10051. [DOI] [PubMed] [Google Scholar]
- 9.Lilig CH, Holmgren A. Thioredoxin and related molecules, from biology to health and disease. Antioxid. Redox. Signal. 2007;9:25–47. doi: 10.1089/ars.2007.9.25. [DOI] [PubMed] [Google Scholar]
- 10.Burke-Gaffney A, Callister MEJ, Nakamura H. Thioredoxin: friend or foe in human disease? Trends Pharm. Sci. 2005;26:398–404. doi: 10.1016/j.tips.2005.06.005. [DOI] [PubMed] [Google Scholar]
- 11.Soderberg A, Sahaf B, Rosen A. Thioredoxin reductase, a redox-active selenoprotein, is secreted by normal and neoplastic cells: Presence in human plasma. Cancer Res. 2000;60:2281–2289. [PubMed] [Google Scholar]
- 12.Arnér ES, Zhong L, Holmgren A. Preparation and assay of mammalian thioredoxin reductase. Methods Enzymol. 1999;300:226–239. doi: 10.1016/s0076-6879(99)00129-9. [DOI] [PubMed] [Google Scholar]
- 13.Arnér ES, Holmgren A. Measurement of thioredoxin and thioredoxin reductase. Curr. Protoc. Toxicol. 2001 doi: 10.1002/0471140856.tx0704s05. Unit 7.4. [DOI] [PubMed] [Google Scholar]
- 14. Please see the description of the Sigma thioredoxin reductase assay at: http://www.sigmaaldrich.com/etc/medialib/docs/Sigma/Bulletin/1/cs0170bul.Par.0001.File.tmp/cs0170bul.pdf.
- 15.Brigelius R, Muckel C, Akerboom TP, Sies H. Identification and quantitation of glutathione in hepatic protein mixed disulfides and its relationship to glutathione disulfide. Biochem. Pharmacol. 1983;32:2529–2534. doi: 10.1016/0006-2952(83)90014-x. [DOI] [PubMed] [Google Scholar]
- 16.Biewenga GP, Dorstijn MA, Verhagen JV, Haenen GR, Bast A. Reduction of lipoic acid by lipoamide dehydrogenase. Biochem. Pharmacol. 1996;51:233–238. doi: 10.1016/0006-2952(95)02124-8. [DOI] [PubMed] [Google Scholar]
- 17.Bjornstedt M, Kumar S, Bjorkhem L, Spyrou G, Holmgren A. Selenium and the thioredoxin and glutaredoxin systems. Biomed. Environ. Sci. 1997;10:271–279. [PubMed] [Google Scholar]
- 18.Shukla A, Jung M, Stern M, Fukagawa NK, Taatjes DJ, Sawyer D, Van Houten B, Mossman BT. Asbestos induces mitochondrial DNA damage and dysfunction linked to the development of apoptosis. Am. J. Physiol. Lung Cell Mol. Physiol. 2003;285:1018–1025. doi: 10.1152/ajplung.00038.2003. [DOI] [PubMed] [Google Scholar]
- 19.Phalen TJ, Weirather K, Deming PB, Anathy V, Howe AK, Van der Vliet A, Jönsson TJ, Poole LB, Heintz NH. Oxidation state governs structural transitions in peroxiredoxin II that correlate with cell cycle arrest and recovery. J. Cell Biol. 2006;175:779–789. doi: 10.1083/jcb.200606005. [DOI] [PMC free article] [PubMed] [Google Scholar]
- 20.Yang X, Wu X, Choi YE, C Kern J, P Kehrer J. Effect of acrolein and glutathione depleting agents on thioredoxin. Toxicology. 2004;204:209–218. doi: 10.1016/j.tox.2004.06.056. [DOI] [PubMed] [Google Scholar]
- 21.Hristova M, Spiess PC, Kasahara DI, Randall MJ, Deng B, Van der Vliet A. The tobacco smoke component, acrolein, suppresses innate macrophage response by direct alkylation of c-Jun N-terminal kinase. Am. J. Respir. Cell Mol. Biol. 2012;46:23–33. doi: 10.1165/rcmb.2011-0134OC. [DOI] [PMC free article] [PubMed] [Google Scholar]
- 22.Patenaude A, Ven Murthy MR, Mirault ME. Mitochondrial thioredoxin system: effects of TrxR2 overexpression on redox balance, cell growth, and apoptosis. J. Biol. Chem. 2004;279:27302–27314. doi: 10.1074/jbc.M402496200. [DOI] [PubMed] [Google Scholar]
- 23.Marzano C, Gandin V, Folda A, Scutari G, Bindoli A, Rigobello MP. Inhibition of thioredoxin reductase by auranofin indices apoptosis in cisplatin-resistant human ovarian cancer cells. Free Radic. Biol. Med. 2007;42:872–881. doi: 10.1016/j.freeradbiomed.2006.12.021. [DOI] [PubMed] [Google Scholar]
- 24.Cairns RA, Harris IS, W Mak T. Regulation of cancer cell metabolism. Nat. Rev. Cancer. 2011;11:85–95. doi: 10.1038/nrc2981. [DOI] [PubMed] [Google Scholar]
- 25.Wondrak GT. Redox-Directed cancer therapeutics: molecular mechanisms and opportunities. Antioxid. Redox. Signal. 2009;11:3013–3069. doi: 10.1089/ars.2009.2541. [DOI] [PMC free article] [PubMed] [Google Scholar]
- 26.Newick K, Cunniff B, Preston K, Held P, Arbiser J, Pass HI, Mossman BT, Shukla A, Heintz NH. Peroxiredoxin 3 is a redox-dependent target or thiostrepton in malignant mesothelioma cells. PLoS One. 2012;7:e39404. doi: 10.1371/journal.pone.0039404. [DOI] [PMC free article] [PubMed] [Google Scholar]