Abstract
Emerging evidence indicates memory donor-reactive T cells are detrimental to transplant outcome and that quantifying the frequency of IFNγ-producing, donor-reactive PBMCs by ELISPOT has potential utility as an immune monitoring tool. Nonetheless, differences in assay performance among laboratories limit the ability to compare results. In an effort to standardize assays, we prepared a panel of common cellular reagent standards, developed and cross validated a standard operating procedure (SOP) for alloreactive IFNγ ELISPOT assays in several research laboratories supported by the NIH funded, Clinical Trials in Organ Transplantation (CTOT) Consortium. We demonstrate that strict adherence to the SOP and centralized data analysis results in high reproducibility with a coefficient of variance (CV) of ~30%. This standardization of IFNγ ELISPOT assay will facilitate interpretation of data from multicenter transplantation research studies and provide the foundation for developing clinical laboratory testing strategies to guide therapeutic decision-making in transplant patients.
Keywords: alloreactive T cells, biomarker, cytokine secretion assay, ELISPOT, flow cytometry, guidelines
Introduction
While acute morbidity and 1 year graft survival for all transplanted organs have improved significantly since the 1980s, long term outcomes following solid organ transplantation remain suboptimal (1–5). The causes of late graft failure are multiple and complex, driven by genetic predisposition as well as immunologic and non-immunologic mechanisms. Current transplantation research efforts are testing whether individualized treatment strategies, rather than universal immunosuppressant protocols, can improve long term graft survival. Personalized medicine necessitates defining specific mechanisms of ongoing injury in each patient, and identifying surrogate markers for the injury capable of reliably segregating transplant recipients into low and high risk subsets (6).
Alloreactive T cells are central mediators of allograft rejection (7, 8). Multiple studies have shown that T cell alloimmunity derives from both the naïve and memory T cell pools (9–12). Compared to their naïve counterparts, effector and memory T cells have lower activation thresholds, can more rapidly engage effector functions and are resistant to many immunosuppressants (13–17). Consistent with these features, increasing evidence indicates that higher frequencies of alloreactive memory T cells correlate with worse transplant outcomes, independent of other risk factors (18, 19). These observations suggest that laboratory assays capable of reliably quantifying alloreactive and/or donor reactive memory T cells could become useful biomarkers to guide clinical decision-making in transplant recipients.
By taking advantage of the fact that effector and memory T cells, but not naïve T cells, produce effector cytokines (including IFNγ) following short term in vitro stimulation, several groups have tested cytokine ELISPOT assays (20–22) and flow cytometry-based cytokine capture assays as a sensitive method to quantify the frequency of alloreactive IFNγ-producing T cells in transplant patients. Reports in which memory cells were quantified in cohorts of kidney transplant recipients have indeed found strong associations between the frequencies of IFNγ-producing cells as detected by ELISPOT and the risk of experiencing a subsequent acute rejection and or a significant decrement in post-transplant renal function over time (19, 23–25).
Despite the apparent sensitivity and utility of these assays, SOPs have not been established and reproducibility of results among laboratories has not been well characterized. This information is essential to compare results obtained from various studies and develop these assays into clinically useful tests.
The NIH-funded CTOT consortium is a collaborative group of transplant centers in North America performing multicenter transplant research studies to identify biomarkers, test novel treatment strategies and evaluate associated mechanisms of injury in solid organ transplant recipients. Among the objectives of the consortium are to test and cross validate laboratory assays as potential tools to predict transplant outcomes. Toward this goal, we produced a panel of allogeneic B cell lines as reagent standards for common use, developed SOPs for cytokine ELISPOT assays and identified key variables that limit reproducibility of results among laboratories, defined the assay variance among trained laboratories and compared the ELISPOT results to those obtained with a flow cytometry cytokine capture method. The results will facilitate standardizing cytokine ELISPOT assays for use in clinical trials and will set the stage for developing reliable measurements of alloreactive memory T cells for use in day-to-day patient management.
Materials and Methods
Study Design
This is an interactive series of experiments with an initial “pilot” phase involving experienced laboratories where the ELISPOT assay protocol was standardized and the variables contributing to observed differences were carefully studied. This was followed by a “validation” phase where the ELISPOT SOP was shared with an additional site for the purpose of cross-validation experiments.
Cellular Samples and Standards
Cellular standards for both stimulator and responder cells were developed at a central site and distributed to the remaining sites under similar shipping conditions. Responder cells consisted of 30 unique sets of PBMCs isolated from buffy coats of anonymous individual blood bank donor samples (NY Blood Bank, NY) in addition to 8 transplant recipients from the Clinical Trials of Organ Transplantation CTOT01 observational study that were frozen and later shipped to individual sites. Stimulator cells consisted of 21 unique B cell lines isolated and expanded from individual blood bank samples using CD40L transfected fibroblasts and interleukin-4. B cell lines were not EBV transformed and were all tested to document expression of Class I and II HLA and CD80 by flow cytometry, and the ability to stimulate allogeneic T cells. CTOT01 transplant donor B cells were processed and isolated from blood (living donor) or spleen (deceased donor) and expanded in the same manner as above. A subset of the lines were HLA-typed (PCR-RSSO DNA typing, Immunogenetics Lab UCLA, supplemental Table 1). All clinical samples were collected with informed consent and ethics approval by local institutional review boards.
ELISPOT Assay
In the pilot phase, ELISPOT assays were performed as previously described (7, 22). Large quantities from the same reagent lot were purchased to avoid lot-to-lot variability and aliquots were distributed to participating centers. All participating laboratories performed manual cell counting using trypan blue dye exclusion of dead cells. An automated cell counter device (GUAVA, Millipore, MA) was used in a series of sub-experiments.
A SOP was developed and refined (Supplemental Appendix 1) following the initial runs and prior to deployment across the final participating centers. The validation phase focused on troubleshooting operator inconsistencies with the final SOP, and fine-tuning ELISPOT plate image acquisition and analysis software (ImmunoSpot ®) settings at the various sites. This was followed by digital upload of final assay plate images to a central online repository to be re-analyzed and quality checked by a single investigator to eliminate inter-operator variability. The developed physical plates from all participating centers were later mailed to a central site to be re-imaged and re-analyzed by a single investigator to eliminate inter-ELISPOT reader hardware/software variability. Quality check of automated counting was performed at the central site where individual wells were scaled down to 80–90% upon counting to exclude artifacts and normalized back to full coverage of the well. Sensitivity settings were adjusted to ensure correct spot counting.
Statistical Analysis
Statistical parameters of mean, standard deviation, and CV of IFNγ spot counts from triplicate wells for each responder/stimulator pair were calculated using either site reported counts or centralized counts. Scatterplots were generated to compare results from different sites and correlations of coefficients (r) were calculated with GraphPad Prism. CVs of responder/stimulator pairs with a minimum average of 25 spots across sites were depicted on a bar graph. The Mann-Whitney test was used to compare sensitivity of different antibody clones. To calculate concordance of results, results were converted to a binary format looking for complete agreement between all sites for results either above or below the specified threshold. This binary result was then tallied and represented as a percentage.
Results
Establishing SOPs for alloreactive IFNγ ELISPOT
We performed a pilot study comparing results from laboratories with several years of experience performing IFNγ ELISPOT assays, in which each site used common cellular reagents but employed their own established protocol (Fig 1). While the laboratories studied IFNγ production by the same responder/stimulator pairs, the quality of the assays (Fig 1A) and the quantitative results (Fig 1B) differed markedly.
Figure 1.
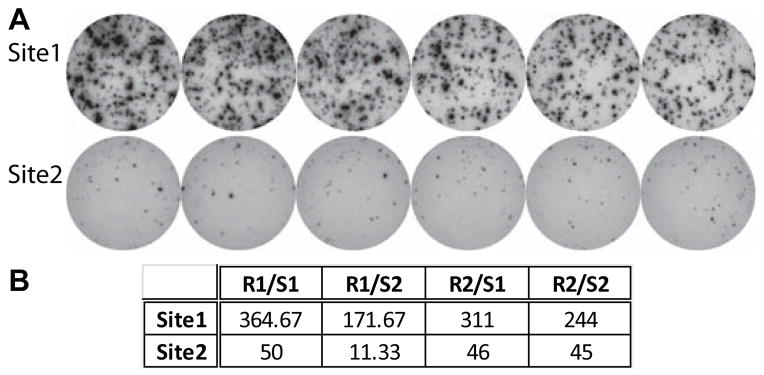
Alloreactive IFNγ ELISPOT assays performed without SOP. A. Representative replicate wells of IFNγ ELISPOT assays performed using aliquots of the same PBMC responders and B cell stimulators at 2 different sites according to site specific laboratory protocols. B. Quantified ELISPOT results of 4 different responder stimulator pairs as performed at 2 different laboratories.
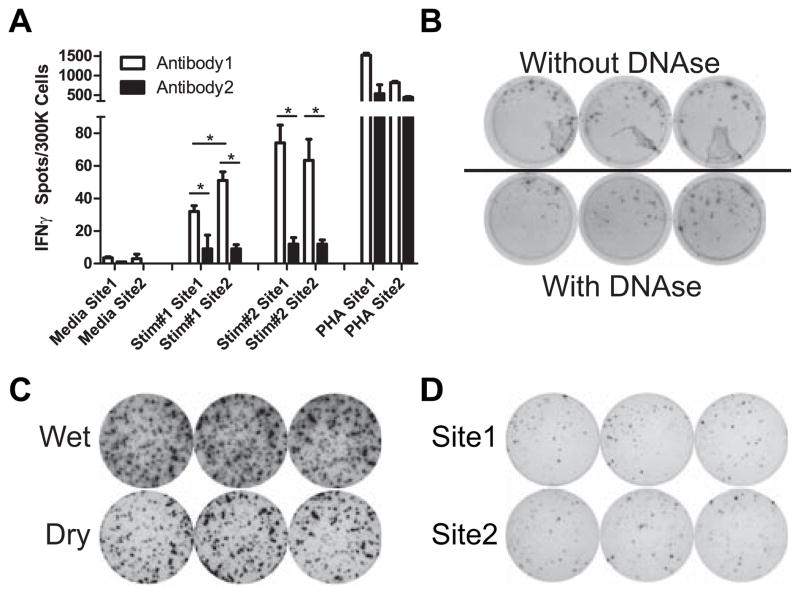
When we compared assay protocols we identified numerous variables that could contribute to the observed differences. We made efforts to standardize each of these variables (Table 1). We compared 2 distinct sets of capture/detection anti-IFNγ antibody pairs obtained from different commercial sources (each specified for use in ELISPOT assays) using the same responder/stimulator pairs and observed that the 2 antibody sets yielded significantly different results (Fig 2A). Among several additional factors tested in side by side comparisons, we found that including DNAse during cell thawing improved cell yield, reduced cell clumping, and removed accompanying artifacts in the assay wells (Fig 2B). We noted that removing the plastic gasket on the back of the assay plate at the end of the procedure improved spot resolution (Fig 2C). Based on these results, among many others, we prepared a detailed SOP (Supplemental Appendix 1) to cover all aspects of the assay including: sources and concentrations of antibodies and developing reagents, buffers, washes, standardized procedures for cell thawing and plating, and standardized timing for each step of the assay. In contrast to differences in assay quality observed originally (Fig 1A), assays performed with strict adherence to the SOP were qualitatively similar between laboratories (Fig 2D).
Table 1.
Variables Addressed Within ELISPOT SOP
| Cell Thawing | Timing of frozen cell pellet transfer into thawing media |
| Inclusion of DNAse in thaw media | |
| Cell Plating | Cell concentrations per well |
| Size of pipette tip orifice | |
| Assay Procedures | Incubation times. |
| Specified number of washes and buffers | |
| Requirement of full drying of plate prior to analysis | |
| Reagents | Antibody: Commercial source, clone and lot numbers |
| Source of developing reagent | |
| Source/recipes of buffers and wash solutions |
Figure 2.
Alloreactive IFNγ ELISPOT assay quality determined by multiple technical factors. A. 2 sets of IFNγ ELISPOT assays were compared using 2 different responder stimulator pairs at each of the 2 sites. Results represent means + SD of quadruplicate wells. *p<0.05. B. Representative assay wells of one responder stimulator pair without DNAse added during cell thawing showing typical artifacts (top) or with the addition of DNAse (bottom) C. Captured images of wells from the same plate allowed to dry without removal of the plastic gasket with the wells still slightly wet (top) and after removal of plastic gasket when the wells are fully dry (bottom). D. Representative replicate assay wells performed at 2 sites using the same responder stimulator pairs following the newly devised SOP.
Assay variance among sites is reduced by central analysis
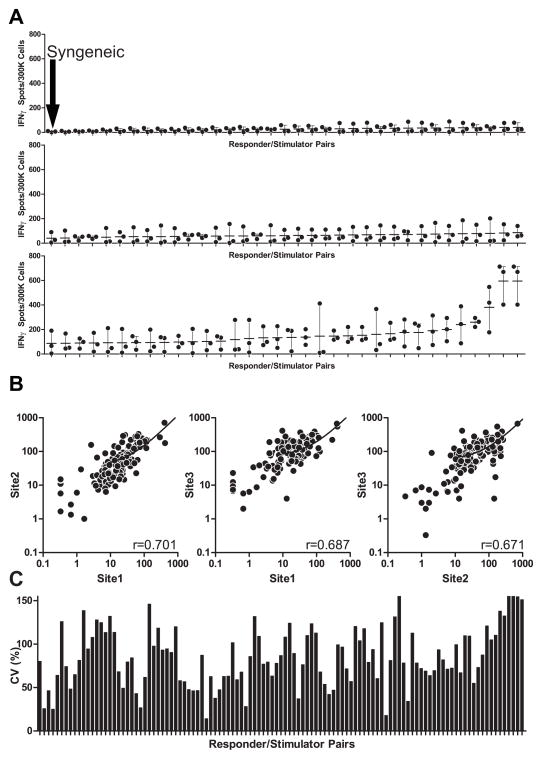
In an effort to quantify assay variance among test sites, we enlisted an additional laboratory. Each group performed ELISPOT assays using common responders and stimulators, strictly adhering to the SOP. Each site performed >6 individual assays in which the frequency of IFNγ-producing cells was assessed with 103 different responder/stimulator pair combinations. The assays included one syngeneic pair to serve as a negative control. Initial quantification was performed locally. The quantitative results of these assays (Fig 3A) revealed that for all sites, syngeneic responder/stimulator pairs produced essentially no IFNγ and those pairs that produced high frequencies of IFNγ ELISPOTs as detected by one site were detected as strong responder/stimulator pairs by all sites. Nonetheless, correlation coefficients between any 2 sites were relatively low (Fig 3B) and assay CVs were >85% (Fig 3C), well above the 30–50% previously reported from repeat assays performed at a single site (21).
Figure 3.
Site reported results show significant variability. A. Site reported frequencies of IFNγ producing cells for each of 103 responder stimulatory pairs using common reagents, SOP at 3 different sites (each dot is the mean of triplicate wells performed at a single site). Dash is the mean value of the 3 sets of data from the 3 sites. All sites detected essentially no response for a syngeneic responder stimulator pair (top graph, first data point). B. 2 way comparisons of results among sites with correlation coefficients shown in the lower right of each graph. C. Coefficients of variance for each responder stimulator pair using site reported data.
We hypothesized that a portion of the observed residual variability (despite following the SOP) derived in part from differences in ELISPOT image analyzers and analysis software algorithms. To test the impact of each of these variables we a) reanalyzed digital files that were obtained at each site using a single analysis protocol at a central site, and b) we obtained the original ELISPOT plates from each site and performed a central analysis of the primary data using a single automated ELISPOT reader and common software.
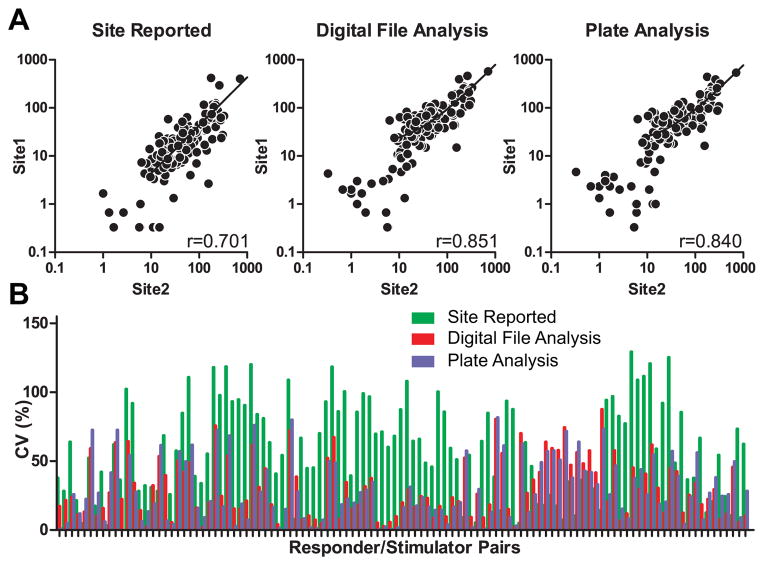
We observed that centralized data analysis improved the correlation coefficient (r) from 0.701, when data were analyzed locally, to 0.851 and 0.840 when the analysis was performed centrally on either digital files or physical plates, respectively (Fig 4A). Notably, correlation coefficients were highest between the 2 sites with the most laboratory experience with the assay. Similarly, the CV improved from 60.5% (local analysis) to 30.3% (centralized analysis, Fig 4B). Correlation coefficients and CVs were similar regardless of whether the centralized analysis was performed on digital files acquired locally, or acquisition and analysis of primary data was performed at a centralized location.
Figure 4.
Centralized data analysis reduces assay variance. A. Representative comparisons and correlation coefficients of site reported results (left, same data as shown in lower left of Fig 3C), results of analysis of digital files captured by the site from assays performed at the site but analyzed by a single core lab (middle) and results of central analysis of plates obtained from each lab (right). B. Coefficients of variance for each responder/stimulator pair as determined by each methods (only those with a response of ≥ 25 spots were included in this analysis).
Strong Concordance of strong vs. weak responders
While reproducible quantification of the IFNγ-producing alloreactive T cells is the goal of standardizing ELISPOT assays, the available data from several sources suggest that pretransplant anti-donor alloresponses above a given threshold, approximately 25 IFNγ-producing cells per 300,000 PBMCs, may be most informative in identifying patients at an elevated risk for poor posttransplant outcomes (20, 26). A frequency distribution analysis of the results of each site (Fig 5) shows similar patterns (particularly between experienced sites 1 and 2) with ~80–85% of responder/stimulator pairs yielding responses ≥ 25. Using this threshold of 25 spots, we observed 72% total concordance among sites (74 of 102 response pairs). Using a higher threshold of ≥125 IFNγ producers per 300,000 responders (defining the highest 20% of responders, Fig 5), we observed a 78% concordance rate (80 of 102 response pairs).
Figure 5.
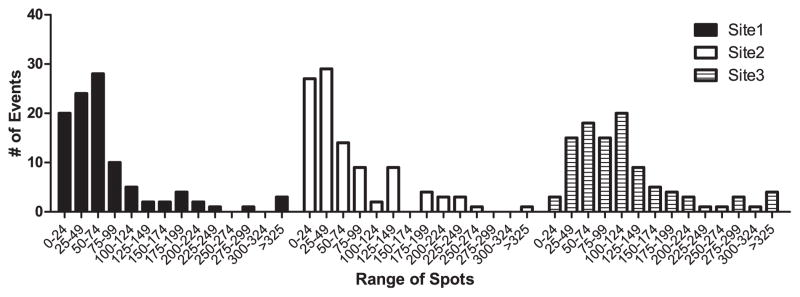
SOPs result in concordance of strong alloresponses among sites. Frequency distribution of assays performed at each of the 3 sites but analyzed centrally of the physical plates.
Automated Cell Counting does not improve variance
We hypothesized that variability in user interpretation of live vs. dead cells during cell counting and initial plating, as determined by trypan blue exclusion, could contribute to assay variance. To address this issue we compared results of ELISPOT assays performed by 3 different individuals at one site using common cellular reagents, in which one set of assays was done with cells counted “manually” (trypan blue) and a second set was done using automated cell counting as determined by a common machine. Interestingly, the CVs were not significantly different and in fact we observed a trend toward a lower CV with manual counting (Table 2).
Table 2.
IFNγ ELISPOT results of “manual” trypan blue vs automated cell counts.
| Trypan Blue | Automated (Guava) | ||||||
|---|---|---|---|---|---|---|---|
| Responder | Stimulator | mean | SD | CV | mean | SD | CV |
| Resp1 | Stim1 | 51.28 | 18.69 | 36.45 | 54.89 | 20.87 | 38.03 |
| Resp1 | Stim2 | 54.83 | 8.76 | 15.98 | 66.94 | 17.63 | 26.33 |
| Resp2 | Stim1 | 56.39 | 16.97 | 30.09 | 57.50 | 27.78 | 48.31 |
| Resp2 | Stim2 | 60.61 | 14.12 | 23.29 | 59.25 | 19.11 | 32.25 |
Donor reactive ELISPOTs in transplant recipients are similarly concordant
To test whether the observed consistency applied to clinical samples, we used cells obtained from transplant recipients and donors from the multicenter CTOT01 study (www.ctotstudies.org) and performed validation tests between two laboratory sites. Both sites were able to obtain interpretable results using stored (frozen) aliquots of patient responder PBMCs. Responses to donor stimulators were low at both sites while a few of the responder cells produced IFNγ to 3rd party (unmatched) donor stimulators (Fig 6A). Centralized analysis of the results revealed a correlation coefficient of 0.75 (Fig 6B) and a concordance rate of 73% between sites.
Figure 6.
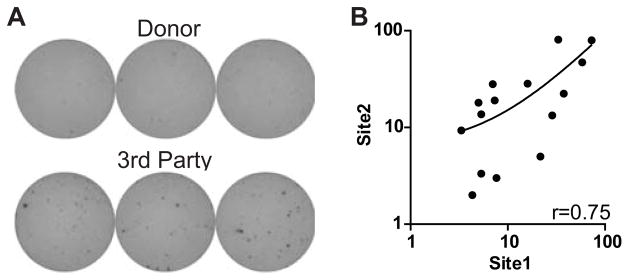
Assays using stored clinical samples show similarly low variance. A. Representative assay wells of transplant recipient responder cells stimulated with matched donor (top) or 3rd party donor (bottom). B. 2-way comparison of results from sites with correlation coefficient.
Flow cytometer cytokine secretion assays (FCCS) differ from ELISPOT assays
Finally, we compared results of IFNγ ELISPOT to IFNγ FCCS assays using the same donor recipient pairs (Supplemental Figure 1). We observed significant differences in assay results, likely related to differences in assay methodology, although the strongest responders were reproducibly identified by both assays in the majority of patients.
Discussion
In this work, we provide a detailed SOP for performing alloreactive IFNγ ELISPOT assays for use in transplantation clinical trials (Supplemental Appendix 1). We demonstrate that using common cellular reagents, strict adherence to the SOP, and centralized data analysis, we can obtain reproducible results with a CV of ~30%. While several other studies have compared ELISPOT assay variability in the context of vaccine/infection trials (27, 28), ours is the first to detail the key parameters required for standardization, and is the only study to address harmonization of assays for alloreactive T cells.
We identified a number of key technical aspects that contribute to inter-assay variability. These include simple steps such as using wide orifice tips for cell plating (presumably gentler on the responding T cells), removing the plastic gasket to permit complete drying, and defining time windows for each assay step, all of which contribute to improving reproducibility. The importance of testing and validating specific sets of antibodies for cytokine detection cannot be overstated. Individual coating and secondary anti-IFNγ antibody clones have intrinsic differences in sensitivity (e.g. binding constants) and or epitope specificities. Because antibodies sold commercially for ELISPOT assays are produced as research tools, and are not specifically produced under good manufacturing practice guidelines for clinical use, individual aliquots of antibodies of the same clone can perform differently in ELISPOT assays. As a consequence, we strongly recommend all ELISPOT assays be performed using the same antibody pairs. Moreover, each new antibody lot should be tested and titrated against the previous lot in controlled experiments to minimize differences in assay variability over time.
The findings reported herein indicate that centralized data analysis is another important factor that improves consistency of assay performance (Fig 4A). While automated image analysis using commercially available ELISPOT “readers” is less labor intensive than manually counting spots under a microscope, the quality of the results depends on the software parameters used to define a “spot.” These parameters including size, density, spot separation/contrast, among others, can be influenced by a number of variables such as the quality of the digital files, lighting used to obtain the images, and artifacts associated with cell clumping at edges of the wells. Differences in analysis algorithms used by individual software programs also contribute to inconsistent detection even if each parameter is standardized among different programs. In the context of multicenter trials, our data indicate that the impact of these variables can be minimized through centralized analysis (Fig 4B). Further standardization will ultimately be required to meet CLIA standards to reliably use ELISPOT assay in the clinical setting.
Our study also highlights the utility of preparing common reagent standards (B cells and PBMCs from healthy volunteers) to use as controls. The development and sharing of these cellular standards allows for continued monitoring of alloreactive ELISPOT assay performance, and we suggest they be used as quality controls for all clinical trials. Having common reagents permitted us to assess the variability of IFNγ-secreting alloreactive cells using 2 different assays (ELISPOT and FCCS). While both can provide clinically informative results, our data suggest that results from the two assays are not easily comparable, making it difficult to interpret different clinical studies that do not employ the same testing strategies.
It is important to note that assays performed with stored cells obtained from transplant recipients are similarly reproducible to those obtained with cells from healthy donors. We detected weak responses in assays performed with posttransplant PBMC stimulated with their donors (all samples derived from stable transplant recipients without rejection). Despite the challenge of limited available donor and recipient cells in available in clinical trials, we and others have demonstrated that recipient PBMC and donor B cell stimulators can be isolated (and for B cells, expanded) from living and deceased donors for use in these assays (29).
In conclusion, despite the multistep complexity of cytokine ELISPOT assays used to detect IFNγ-producing alloreactive T cells, strict adherence to a detailed SOP with common cellular reagents and centralized data analysis can minimize assay variability among experienced laboratories to CVs of ~30%. The ability to reproducibly detect alloreactive memory T cells through a standardized IFNγ ELISPOT approach demonstrated the feasibility for further development of this assay as a risk assessment tool to guide the management of transplant recipients.
Supplementary Material
Acknowledgments
We thank Denise Peace, Tina Yao, Brian Smith, Tiffany Smith, Giovanni Lopez, and Nancy Steward for technical assistance; Yvonne Morrison for project management; Dr. Nancy Bridges for review of the manuscript.
This research was performed as part of an American Recovery and Reinvestment (ARRA) funded project under Award Number U0163594 (awarded to P Heeger), from the National Institute of Allergy and Infectious Diseases. The work was carried out by members of the Clinical Trials in Organ Transplantation (CTOT) and Clinical Trials in Organ Transplantation in Children (CTOT-C) consortia. The content is solely the responsibility of the authors and does not necessarily represent the official views of the National Institute of Allergy And Infectious Diseases or the National Institutes of Health.
Abbreviations
- ELISPOT
Enzyme-linked immunosorbent spot assay
- IFNγ
Interferon-gamma
- PBMC
peripheral blood mononuclear cell
- SOP
standard operating procedure
- NIH
National Institutes of Health
- CTOT
Clinical Trials in Organ Transplantation
- CV
coefficient of variance
- HLA
human leukocyte antigen
- PCR-RSSO
polymerase chain reaction – reverse sequence specific oligonucleotide
- FCCS
flow cytometric cytokine secretion assay
Footnotes
Disclosure
The authors of this manuscript have no conflicts of interest to disclose as described by the American Journal of Transplantation.
Additional Supporting Information may be found in the online version of this article.
Supplemental Appendix 1. Detailed IFNγ ELISPOT SOP
Supplemental Table 1. HLA Profiling of Expanded non-transformed B cell panel
Supplemental Figure 1. Comparison of IFNγ ELISPOT and Flow Cytometry Cytokine Secretion assays.
References
- 1.Lamb KE, Lodhi S, Meier-Kriesche HU. Long-term renal allograft survival in the United States: a critical reappraisal. Am J Transplant. 2011 Mar;11(3):450–62. doi: 10.1111/j.1600-6143.2010.03283.x. [DOI] [PubMed] [Google Scholar]
- 2.Lodhi SA, Lamb KE, Meier-Kriesche HU. Solid organ allograft survival improvement in the United States: the long-term does not mirror the dramatic short-term success. Am J Transplant. 2011 Jun;11(6):1226–35. doi: 10.1111/j.1600-6143.2011.03539.x. [DOI] [PubMed] [Google Scholar]
- 3.Meier-Kriesche HU, Schold JD, Kaplan B. Long-term renal allograft survival: have we made significant progress or is it time to rethink our analytic and therapeutic strategies? Am J Transplant. 2004 Aug;4(8):1289–95. doi: 10.1111/j.1600-6143.2004.00515.x. [DOI] [PubMed] [Google Scholar]
- 4.Meyers BF, de la Morena M, Sweet SC, Trulock EP, Guthrie TJ, Mendeloff EN, et al. Primary graft dysfunction and other selected complications of lung transplantation: A single-center experience of 983 patients. J Thorac Cardiovasc Surg. 2005 Jun;129(6):1421–9. doi: 10.1016/j.jtcvs.2005.01.022. [DOI] [PubMed] [Google Scholar]
- 5.Suthanthiran M, Strom TB. Renal transplantation. N Engl J Med. 1994 Aug 11;331(6):365–76. doi: 10.1056/NEJM199408113310606. [DOI] [PubMed] [Google Scholar]
- 6.Sawitzki B, Schlickeiser S, Reinke P, Volk HD. Monitoring tolerance and rejection in organ transplant recipients. Biomarkers. 2011 Jul;16(Suppl 1):S42–50. doi: 10.3109/1354750X.2011.578754. [DOI] [PubMed] [Google Scholar]
- 7.Najafian N, Salama AD, Fedoseyeva EV, Benichou G, Sayegh MH. Enzyme-linked immunosorbent spot assay analysis of peripheral blood lymphocyte reactivity to donor HLA-DR peptides: potential novel assay for prediction of outcomes for renal transplant recipients. J Am Soc Nephrol. 2002 Jan;13(1):252–9. doi: 10.1681/ASN.V131252. [DOI] [PubMed] [Google Scholar]
- 8.Poggio ED, Roddy M, Riley J, Clemente M, Hricik DE, Starling R, et al. Analysis of immune markers in human cardiac allograft recipients and association with coronary artery vasculopathy. J Heart Lung Transplant. 2005 Oct;24(10):1606–13. doi: 10.1016/j.healun.2004.12.110. [DOI] [PubMed] [Google Scholar]
- 9.Brook MO, Wood KJ, Jones ND. The impact of memory T cells on rejection and the induction of tolerance. Transplantation. 2006 Jul 15;82(1):1–9. doi: 10.1097/01.tp.0000226082.17507.da. [DOI] [PubMed] [Google Scholar]
- 10.Dollinger MM, Howie SE, Plevris JN, Graham AM, Hayes PC, Harrison DJ. Intrahepatic proliferation of ‘naive’ and ‘memory’ T cells during liver allograft rejection: primary immune response within the allograft. FASEB J. 1998 Aug;12(11):939–47. doi: 10.1096/fasebj.12.11.939. [DOI] [PubMed] [Google Scholar]
- 11.Ibrahim S, Dawson DV, Sanfilippo F. Predominant infiltration of rejecting human renal allografts with T cells expressing CD8 and CD45RO. Transplantation. 1995 Mar 15;59(5):724–8. doi: 10.1097/00007890-199503150-00015. [DOI] [PubMed] [Google Scholar]
- 12.Le Moine A, Goldman M, Abramowicz D. Multiple pathways to allograft rejection. Transplantation. 2002 May 15;73(9):1373–81. doi: 10.1097/00007890-200205150-00001. [DOI] [PubMed] [Google Scholar]
- 13.Curtsinger JM, Lins DC, Mescher MF. CD8+ memory T cells (CD44high, Ly-6C+) are more sensitive than naive cells to (CD44low, Ly-6C−) to TCR/CD8 signaling in response to antigen. J Immunol. 1998 Apr 1;160(7):3236–43. [PubMed] [Google Scholar]
- 14.Mondino A, Khoruts A, Jenkins MK. The anatomy of T-cell activation and tolerance. Proc Natl Acad Sci U S A. 1996 Mar 19;93(6):2245–52. doi: 10.1073/pnas.93.6.2245. [DOI] [PMC free article] [PubMed] [Google Scholar]
- 15.Pihlgren M, Dubois PM, Tomkowiak M, Sjogren T, Marvel J. Resting memory CD8+ T cells are hyperreactive to antigenic challenge in vitro. J Exp Med. 1996 Dec 1;184(6):2141–51. doi: 10.1084/jem.184.6.2141. [DOI] [PMC free article] [PubMed] [Google Scholar]
- 16.Viola A, Lanzavecchia A. T cell activation determined by T cell receptor number and tunable thresholds. Science. 1996 Jul 5;273(5271):104–6. doi: 10.1126/science.273.5271.104. [DOI] [PubMed] [Google Scholar]
- 17.Morelon E, Lefrancois N, Besson C, Prevautel J, Brunet M, Touraine JL, et al. Preferential increase in memory and regulatory subsets during T-lymphocyte immune reconstitution after Thymoglobulin induction therapy with maintenance sirolimus vs cyclosporine. Transpl Immunol. 2010 May;23(1–2):53–8. doi: 10.1016/j.trim.2010.04.004. [DOI] [PubMed] [Google Scholar]
- 18.Nickel P, Presber F, Bold G, Biti D, Schonemann C, Tullius SG, et al. Enzyme-linked immunosorbent spot assay for donor-reactive interferon-gamma-producing cells identifies T-cell presensitization and correlates with graft function at 6 and 12 months in renal-transplant recipients. Transplantation. 2004 Dec 15;78(11):1640–6. doi: 10.1097/01.tp.0000144057.31799.6a. [DOI] [PubMed] [Google Scholar]
- 19.van den Boogaardt DE, van Miert PP, de Vaal YJ, de Fijter JW, Claas FH, Roelen DL. The ratio of interferon-gamma and interleukin-10 producing donor-specific cells as an in vitro monitoring tool for renal transplant patients. Transplantation. 2006 Sep 27;82(6):844–8. doi: 10.1097/01.tp.0000229448.64363.18. [DOI] [PubMed] [Google Scholar]
- 20.Augustine JJ, Siu DS, Clemente MJ, Schulak JA, Heeger PS, Hricik DE. Pre-transplant IFN-gamma ELISPOTs are associated with post-transplant renal function in African American renal transplant recipients. Am J Transplant. 2005 Aug;5(8):1971–5. doi: 10.1111/j.1600-6143.2005.00958.x. [DOI] [PubMed] [Google Scholar]
- 21.Gebauer BS, Hricik DE, Atallah A, Bryan K, Riley J, Tary-Lehmann M, et al. Evolution of the enzyme-linked immunosorbent spot assay for post-transplant alloreactivity as a potentially useful immune monitoring tool. Am J Transplant. 2002 Oct;2(9):857–66. doi: 10.1034/j.1600-6143.2002.20908.x. [DOI] [PubMed] [Google Scholar]
- 22.Heeger PS, Greenspan NS, Kuhlenschmidt S, Dejelo C, Hricik DE, Schulak JA, et al. Pretransplant frequency of donor-specific, IFN-gamma-producing lymphocytes is a manifestation of immunologic memory and correlates with the risk of posttransplant rejection episodes. J Immunol. 1999 Aug 15;163(4):2267–75. [PubMed] [Google Scholar]
- 23.Andree H, Nickel P, Nasiadko C, Hammer MH, Schonemann C, Pruss A, et al. Identification of dialysis patients with panel-reactive memory T cells before kidney transplantation using an allogeneic cell bank. J Am Soc Nephrol. 2006 Feb;17(2):573–80. doi: 10.1681/ASN.2005030299. [DOI] [PubMed] [Google Scholar]
- 24.Poggio ED, Augustine JJ, Clemente M, Danzig JM, Volokh N, Zand MS, et al. Pretransplant cellular alloimmunity as assessed by a panel of reactive T cells assay correlates with acute renal graft rejection. Transplantation. 2007 Apr 15;83(7):847–52. doi: 10.1097/01.tp.0000258730.75137.39. [DOI] [PubMed] [Google Scholar]
- 25.Tary-Lehmann M, Hricik DE, Justice AC, Potter NS, Heeger PS. Enzyme-linked immunosorbent assay spot detection of interferon-gamma and interleukin 5-producing cells as a predictive marker for renal allograft failure. Transplantation. 1998 Jul 27;66(2):219–24. doi: 10.1097/00007890-199807270-00014. [DOI] [PubMed] [Google Scholar]
- 26.Bestard O, Nickel P, Cruzado JM, Schoenemann C, Boenisch O, Sefrin A, et al. Circulating alloreactive T cells correlate with graft function in longstanding renal transplant recipients. J Am Soc Nephrol. 2008 Jul;19(7):1419–29. doi: 10.1681/ASN.2007050539. [DOI] [PMC free article] [PubMed] [Google Scholar]
- 27.Gill DK, Huang Y, Levine GL, Sambor A, Carter DK, Sato A, et al. Equivalence of ELISpot assays demonstrated between major HIV network laboratories. PLoS One. 2010;5(12):e14330. doi: 10.1371/journal.pone.0014330. [DOI] [PMC free article] [PubMed] [Google Scholar]
- 28.Janetzki S, Panageas KS, Ben-Porat L, Boyer J, Britten CM, Clay TM, et al. Results and harmonization guidelines from two large-scale international Elispot proficiency panels conducted by the Cancer Vaccine Consortium (CVC/SVI) Cancer Immunol Immunother. 2008 Mar;57(3):303–15. doi: 10.1007/s00262-007-0380-6. [DOI] [PMC free article] [PubMed] [Google Scholar]
- 29.Augustine JJ, Poggio ED, Heeger PS, Hricik DE. Preferential benefit of antibody induction therapy in kidney recipients with high pretransplant frequencies of donor-reactive interferon-gamma enzyme-linked immunosorbent spots. Transplantation. 2008 Aug 27;86(4):529–34. doi: 10.1097/TP.0b013e31818046db. [DOI] [PMC free article] [PubMed] [Google Scholar]
Associated Data
This section collects any data citations, data availability statements, or supplementary materials included in this article.


