Abstract
Miniaturized gas chromatography (GC) systems can provide fast, quantitative analysis of chemical vapors in an ultrasmall package. We describe a chemical sensor technology based on resonant nanoelectromechanical systems (NEMS) mass detectors that provides the speed, sensitivity, specificity, and size required by the microscale GC paradigm. Such NEMS sensors have demonstrated detection of subparts per billion (ppb) concentrations of a phosphonate analyte. By combining two channels of NEMS detection with an ultrafast GC front-end, chromatographic analysis of 13 chemicals was performed within a 5 s time window.
Keywords: NEMS, gas chromatography, gas detectors, mass sensing
Over the past several decades, microtechnology has evolved from the era of small-scale, lab-produced prototypes to the realization of foundry-level, mass-produced products suitable for integration into complex microsystems. This development has had a tremendous impact in all areas of the physical sciences, as new paradigms are enabled by shrinking well-established analytical tools into small, cheap, and low-power packages. One such paradigm is based on developing a miniaturized version of one of the workhorse tools of analytical chemistry, gas chromatography (GC). The realization of micro-GC capabilities would provide the sensitivity and discrimination ability of a lab-based instrument, while offering portable chemical analysis on the time scale of seconds rather than minutes to hours. Such a system could dramatically expand the fields of use of chromatographic chemical analysis in applications ranging from airport security to environmental monitoring and biomedical diagnostics.1–5 Although progress has been made in the development of micro-GC systems through the use of microfabricated columns and various microscale detectors,3–7 a bottleneck to the overall performance of micro-GC systems has been the lack of an optimal back-end detector technology. A wide variety of miniaturized chemical detectors has been investigated for microanalytical systems, including chemiresistors,3,8,9 carbon nanotube (CNT) chemi-capacitors,10 surface acoustic wave (SAW) devices,5,11,12 miniaturized mass spectrometers,2,13 and microcantilevers and arrays thereof.14–16
Recently, mass detectors based upon nanoelectromechanical systems (NEMS) resonators have demonstrated mass sensitivities in vacuum at the zeptogram scale (10−21 g)17 and below18,19 and sensitivities at atmospheric pressures below the attogram scale (10−18 g).20 The sensitivities of these nanoscale structures suggest that, given the proper functionalization, NEMS resonators should enable the detection of extremely minute amounts of chemical vapors and could allow such detection within the nanoliter-scale flow volumes that are required for optimal chromatographic performance in micro-GC systems. We demonstrate herein that polymer-functionalized high-frequency NEMS resonators, and arrays thereof, can provide sensitive detection of high-speed chromatographs and offer unique capabilities that are critical for future integration into portable microanalytical systems.
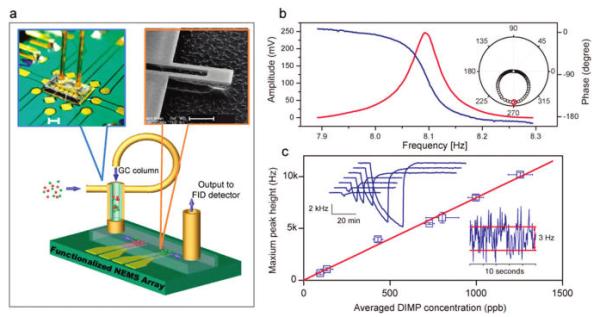
The resonators were self-sensing silicon nitride nanocantilevers (Figure 1a) that had an integrated piezoresistive readout. Details of the device fabrication and transduction have been described previously.20 Typical frequencies for the fundamental mechanical resonances of these devices were 8–10 MHz with a quality factor of ~100–200 at atmospheric pressure. Each resonator had a mass capture area of ~1.5 μm2 (Figure 1b). To enable selective absorption of the target vapor species, 10 nm thick films were formed by drop-coating a polymer onto each NEMS cantilever. As the polymer film absorbed an analyte, the total mass of the resonator increased by Δm, resulting in a proportional shift of the NEMS resonance frequency Δf, given by Δf = (f0/2Meff) Δm, where f0 and Meff are the resonance frequency and the effective modal mass of the resonator, respectively. A phase-locked loop was employed to track the resonance frequency of the cantilever in real time (Figure 1b).20 For chemical sensing at equilibirum, the mass resolution was translated into a vapor concentration sensitivity through the partition coefficient, Kp, defined as the ratio between the concentration of analyte molecules inside the absorptive polymer film (cpoly) and the concentration of analyte in the gas phase (cgas): Kp = cpoly/cgas. DKAP, a silicone copolymer that has strong hydrogen-bond acidic functionality, was used for the preferential absorption of a group of organophosphate nerve agent simulants.5,22 The estimated partition coefficient Kp ~ 107 for DIMP (diisopropylmethyl phosphonate) absorbed into DKAP.23
FIGURE 1.

Experimental setup and NEMS resonator gas sensing performance. (a) Schematic view of an array of NEMS resonators encapsulated in a micromachined flow channel, connected with a GC column (parts are not drawn to scale). The channel total volume is 15 nL. Left inset: photo of an actual assembly of the system. Scale bar: 1 mm. Right inset: Scanning electron micrograph of a cantilever NEMS resonator with an integrated piezoresistive transducer having dimensions of length, 2.5 μm; width, 0.8 μm; and thickness, 0.13 μm. Scale bar: 1 μm. (b) Amplitude (red) and phase (blue) resonant response of the cantilever at atmospheric pressure, displaying a quality factor of 200. Inset: polar plot of the same resonant response, where the axial axis is amplitude, and the radial axis is phase. The red marker shows the phase-locking point at the maximum response amplitude. (c) Time-dependent response of a polymer-coated NEMS resonator to varying concentrations of DIMP. Upper inset: chromatogram peaks obtained at various DIMP concentrations using a 10 m column. Lower inset: short-term frequency fluctuations of the NEMS resonator showing a rms amplitude of 1.5 Hz. At a signal-to-noise ratio of 3:1, this corresponds to a limit of detection for DIMP at equilibrium of 0.6 parts per billion.
To measure the performance of a NEMS device as a GC detector, the devices were tested with a modified commercial GC system that had a standard capillary column outlet fed into the NEMS enclosure (discussed further below). The outlet flow from the NEMS enclosure was connected to a high-speed flame ionization detector (FID, sampling rate of 1 kHz) for serial downstream benchmarking (Figure 1a). To enable greater high-speed separation performance, hydrogen was used as the carrier gas, due to its low viscosity and the high diffusivity of analytes in hydrogen.
For high-speed micro-GC gas analysis, the detector enclosure ideally should match the small flow dimensions within the column itself, thereby minimizing the gas-phase diffusive broadening of the GC elution peaks.21 Because of the extremely small footprint of the NEMS detectors, such an enclosure was readily constructed by bonding a microfluidic gas channel directly onto the surface of the NEMS chip (Figure 1a). The channel consisted of a 20 μm deep, 250 μm wide, and 2.5 mm long etched patterned groove that was formed along one surface of a glass chip with two machined through holes comprising a gas inlet and outlet, respectively. The resulting enclosure had a cross-sectional area close to that of the GC column itself (100 μm inner diameter), eliminating the presence of any potential dead volumes that would degrade the chromatographic performance.
The equilibrium sensitivity of the resonators was evaluated within the microfluidic channel by injecting sample solutions of DIMP at various concentrations into a 9 m column that was maintained at a temperature of 40 °C. To ensure that the sensors fully reached equilibrium with the analyte of interest, a low carrier flow rate was generated to allow long (~1200 s) analyte exposures. The average DIMP gas-phase dimensionless concentration during these long peaks can be calculated from the expression c ) (clVlVmSR)/(MWFΔt), where cl is the mass density of DIMP in the liquid sample, Vl is the liquid volume of sample injected into the column, Vm (= 25.7 L/mol) is the molar volume of an ideal gas at the column outlet temperature (40 °C), SR is the injection split ratio, MW is the molecular weight of the analyte, Δt is the peak width in time, and F is the column flow rate. Figure 1c displays a NEMS chromatogram recorded for several analyte concentrations of DIMP, showing real-time frequency shifts, Δf(t), of the NEMS resonator as the analyte was absorbed in, and then reversibly desorbed from, the coated NEMS detector. Figure 1c also depicts the average value of the maximum frequency shift of these chromatograms, showing a linear dependence on the analyte concentration with a slope of 8 Hz per part per billion (ppb) concentration. The rms frequency noise of the resonator was 1.5 Hz during a 10 s measurement period. Assuming a minimum SNR of 3, the smallest detectable concentration at equilibrium was thus estimated to be ~0.6 ppb.
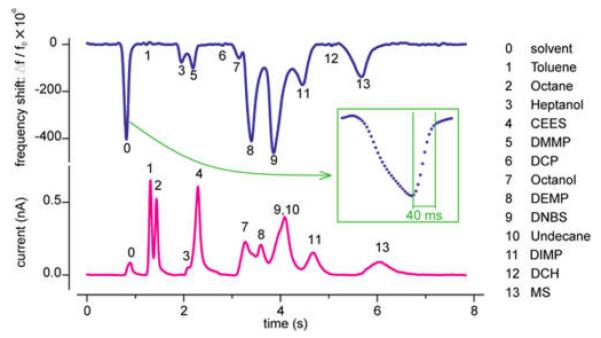
To explore the performance of the NEMS sensors under conditions of high-speed GC, the long column was replaced with a 1 m capillary column that had length and cross-sectional dimensions similar to those of currently available micromachined silicon columns.4,5 A mixture consisting of eight organophosphates/sulfates and five volatile organic compounds (VOCs) was used for the test (see Supporting Information). Figure 2 displays the temperature-programmed chromatograms within a 5 s time window that were obtained simultaneously from the NEMS resonator and the FID detector. The absorption selectivity of the DKAP polymer resulted in the generation of large NEMS responses upon exposure to certain analytes (primarily the organophosphates), while other analytes did not produce any detectable response in the NEMS chromatogram. Because of the zero-dead-volume NEMS enclosure (designed to minimize peak broadening), the dense, high-speed chromatogram was readily resolved by both the NEMS and the downstream FID. For the narrowest peak, the 90% recovery time was <40 ms.
FIGURE 2.

Rapid chromatographic separation and nanomechanical detection of thirteen mixed chemical compounds. Chromatograms from a NEMS resonator (top, blue) and a downstream FID detector (bottom, magenta) acquired simultaneously for comparison. The DKAP polymer-coated NEMS resonator showed high selectivity to organophosphate compounds such as DMMP, DEMP, and DIMP, as shown by the correspondingly strong peaks. Inset: Expanded view of the solvent peak, showing a 90% sensor recovery time of 40 ms.
The maximum high-speed response of the NEMS device displayed in Figure 2 to, for example, DIMP, is considerably smaller than that expected from the equilibrium response measurements shown in Figure 1b, which indicates that the sensor did not fully reach equilibrium with the analyte during the short duration of the elution peak. This behavior can be ascribed to the low diffusivity of phosphonates in acid-functionalized polymers such as DKAP.23 Additionally, the presence of DKAP on inactive regions of the NEMS chip could reduce the ability of small amounts of analyte to reach the sensor within the duration of the peak. The equilibration times should be reduced considerably by optimization of the sensor chemistry and coating procedures; however, even with the limitations described above, the data demonstrate that high-speed detection of GC separations is feasible with NEMS sensors.
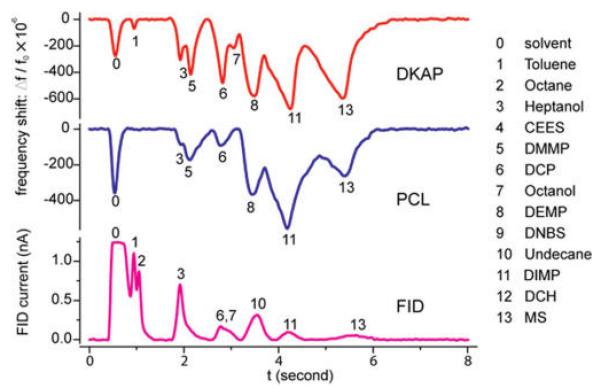
The chemical specificity of the sensor can be tuned by varying the type of polymer deposited on the NEMS. To demonstrate this, two NEMS sensors, one coated with DKAP and another coated with polycaprolactone (PCL), a less chemically selective absorber, were packaged within the same enclosure, so that the resonators could respond simultaneously to sequential incoming pulses of analytes. Figure 3 shows three simultaneous chromatogram traces that were obtained from the PCL and DKAP-coated resonators, as well as from the downstream FID. The PCL-coated device responded to most of the polar chemicals, whereas the DKAP-coated device responded primarily to organophosphates.
FIGURE 3.

Differentially functionalized dual NEMS resonators and rapid chromatographic separation. Simultaneous chromatogram traces of a 13-analyte mixture, recorded from two NEMS resonators coated with DKAP (red, top) and PCL (blue, middle) polymeric films, and from a FID detector (magenta, bottom).
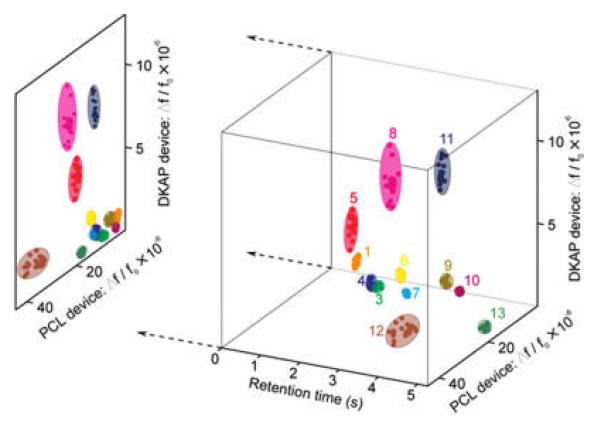
Combined with GC separation, the distinct response pattern of the differentially functionalized NEMS array provided significant chemical recognition ability. Twenty injections of each of twelve analytes (see Supporting Information) were introduced into the GC system, and the responses from both resonators (normalized to 1 mg m−3 mass concentration in the flow), along with the retention time in the column, were recorded, with the resulting data displayed in a three-dimensional space (Figure 4). For normalized concentrations, the twelve chemicals occupied distinct, independent volumes in recognition space. To provide a comparison with the recognition ability of the sensor array alone (without separation by the GC), the three-dimensional data plot was projected onto the plane generated by use of only the sensor responses. Several groups of similar chemical components were clustered, such as toluene/DNBS/undecane and heptanol/octanol/CEES, precluding their facile recognition using the NEMS responses alone. However, with the addition of the chromatographic separation stage the overlapping sensor responses were sufficiently separated to independently identify the analytes within the 5 s measurement window.
FIGURE 4.

Three-dimensional recognition plot of the 13 analytes, using the DKAP-coated NEMS peak sensor response, the PCL-coated NEMS sensor response, and the GC retention time as the three axes. Each chemical compound was measured individually with the measured frequency shift response normalized to a mass concentration of 1 mg/m 3; each cluster corresponds to twenty independent measurements. The advantages of combining chromatographic separation with multisensor detection can be seen by examining the two-dimensional sensor response space, shown as the projection of the 3D plot. The overlapping sensor responses to several analytes in the 2D space were separated by the third axis of retention time.
A noteworthy aspect of the NEMS sensors is their potential benefit in the development of a fully integrated analysis system for which the sample collection, GC separation, and detection stages must be combined on a single substrate.5,24 Such integrated designs enable high-speed analysis, as the elimination of fluidic interconnects between analytical stages minimizes dead volumes and uncontrolled surface interactions that can degrade the high-speed chromatographic performance. However, no overall system performance benefit is to be gained by monolithic integration if the detector is not sufficiently sensitive and cannot retain, much less enhance, the temporally dense analytical content of high-speed chromatograms. The demonstrated high-speed performance of the NEMS sensors described herein thus provides motivation and opportunity to address the design of integrated GC analysis systems.
Supplementary Material
Acknowledgment
The authors thank X. L. Feng and I. Bargatin for useful discussions and S. Stryker for machining assistance. We gratefully acknowledge support from the Defense Advanced Research Projects Agency via DARPA/MTO-MGA Grant NBCH1050001 and from the Department of Homeland Security. Sandia is a multiprogram laboratory operated by Sandia Corporation, a Lockheed Martin Company, for the United States Department of Energy under contract DE-AC04-94AL85000.
Footnotes
Supporting Information Available. A description of the NEMS sensor fabrication and details of the operation of the gas chromatograph and the preparation of the chemicals used are provided. This material is available free of charge via the Internet at http://pubs.acs.org.
REFERENCES AND NOTES
- (1).Manz A, Graber N, Widmer HM. Sens. Actuators, B. 1990;1:244–248. [Google Scholar]
- (2).Janasek D, Franzke J, Manz A. Nature. 2006;442:374–380. doi: 10.1038/nature05059. [DOI] [PubMed] [Google Scholar]
- (3).Lu C-J, Steinecker WH, Tian W-C, Oborny MC, Nichols JM, Agah M, Potkay JA, Chan HKL, Driscol J, Sacks RD, Wise KD, Pang SW, Zellers ET. Lab Chip. 2005;5:1123–1131. doi: 10.1039/b508596a. [DOI] [PubMed] [Google Scholar]
- (4).Agah M, Lambertus GR, Sacks R, Wise K. J. Microelectromech. Syst. 2006;15:1371–1378. [Google Scholar]
- (5).Lewis PR, Manginell RP, Adkins DR, Kottenstette RJ, Wheeler DR, Sokolowski SS, Trudell DE, Byrnes JE, Okandan M, Bauer JM, Manley RG, Frye-Mason GC. IEEE Sens. J. 2006;6:784–795. [Google Scholar]
- (6).Terry SC, Jerman JH, Angell JB. IEEE Trans. Electron Devices. 1979;26:1880–1886. [Google Scholar]
- (7).Reston RR, Kolesar ES. J. Microelectromech. Syst. 1994;3:134–146. [Google Scholar]
- (8).Lonergan MC, Severin EJ, Doleman BJ, Beaber SA, Grubbs RH, Lewis NS. Chem. Mater. 1996;8:2298–2312. [Google Scholar]
- (9).Albert KJ, Lewis NS, Schauer CL, Sotzing GA, Stitzel SE, Vaid TP, Walt DR. Chem. Rev. 2000;100:2595–2626. doi: 10.1021/cr980102w. [DOI] [PubMed] [Google Scholar]
- (10).Snow ES, Perkins FK, Houser EJ, Badescu SC, Reinecke TL. Science. 2005;307:1942–1945. doi: 10.1126/science.1109128. [DOI] [PubMed] [Google Scholar]
- (11).Grate JW, Rosepehrsson SL, Venezky DL, Klusty M, Wohltjen H. Anal. Chem. 1993;65:1868–1881. [Google Scholar]
- (12).Grate JW. Chem. Rev. 2000;100:2627–2647. doi: 10.1021/cr980094j. [DOI] [PubMed] [Google Scholar]
- (13).Blain MG, Riter LS, Cruz D, Austin DE, Wu G, Plass WR, Cooks RG. Int. J. Mass. Spec. 2004;236:91–104. [Google Scholar]
- (14).Lavrik NV, Sepaniak MJ, Datskos PG. Rev. Sci. Instrum. 2004;75:2229–2253. [Google Scholar]
- (15).Lang HP, Baller MK, Berger R, Gerber Ch., Gimzewski JK, Battiston FM, Fornaro P, Ramseyer JP, Meyer E, Guntherodt J. Anal. Chim. Act. 1999;393:59–65. [Google Scholar]
- (16).Chapman PJ, Vogt F, Dutta P, Datskos PG, Devault GL, Sepaniak MJ. Anal. Chem. 2007;79:364–370. doi: 10.1021/ac061389x. [DOI] [PubMed] [Google Scholar]
- (17).Yang YT, Callegari C, Feng XL, Ekinci KL, Roukes ML. Nano Lett. 2006;6:583–586. doi: 10.1021/nl052134m. [DOI] [PubMed] [Google Scholar]
- (18).Chiu H-Y, Hung P, Postma H. W. Ch., Bockrath M. Nano Lett. 2008;8:4342. doi: 10.1021/nl802181c. [DOI] [PubMed] [Google Scholar]
- (19).Jensen K, Kim K, Zettl A. Nat. Nanotechnol. 2008;3:533–537. doi: 10.1038/nnano.2008.200. [DOI] [PubMed] [Google Scholar]
- (20).Li M, Tang HX, Roukes ML. Nat. Nanotechnol. 2007;2:114–120. doi: 10.1038/nnano.2006.208. [DOI] [PubMed] [Google Scholar]
- (21).McNair HM, Miller JM. Basic gas chromatography. Wiley; New York: 1998. [Google Scholar]
- (22).Grate JW, Kaganove SN, Patrash SJ, Craig R, Bliss M. Chem. Mater. 1997;9:1201–1207. [Google Scholar]
- (23).Zimmermann C, Mazein P, Rebiere D, Dejous C, Pistre J, Planade R. IEEE Sens. J. 2004;4:479–488. [Google Scholar]
- (24).Terry SC, Angell JB. In: Theory, design, and biomedical applications of solid state chemical sensors. Cheung PW, Fleming DG, editors. CRC Press; Boca Raton, FL: 1978. [Google Scholar]
Associated Data
This section collects any data citations, data availability statements, or supplementary materials included in this article.


