

Summary
Forebrain circuits rely upon a relatively small but remarkably diverse population of GABAergic interneurons to bind and entrain large principal cell assemblies for network synchronization and rhythmogenesis. Despite the high degree of heterogeneity across cortical interneurons, members of a given subtype typically exhibit homogeneous developmental origins, neuromodulatory response profiles, morphological characteristics, neurochemical signatures, and electrical features. Here we report a surprising divergence amongst hippocampal oriens-lacunosum moleculare (O-LM) projecting interneurons that have hitherto been considered a homogeneous cell population. Combined immunocytochemical, anatomical, and electrophysiological interrogation of Htr3a-GFP and Nkx2-1-cre:RCE mice revealed that O-LM cells parse into caudal ganglionic eminence-derived 5-HT3AR-expressing, and medial ganglionic eminence- derived 5-HT3AR-lacking subpopulations. These two cohorts differentially participate in network oscillations with 5-HT3AR-containing O-LM cell recruitment dictated by serotonergic tone. Thus, members of a seemingly uniform interneuron population can exhibit unique circuit functions and neuromodulatory properties dictated by disparate developmental origins.
Introduction
Network information coding requires precision in the extent and synchrony of activity within glutamatergic principal cell assemblies that is largely orchestrated by local circuit inhibitory interneurons. Though sparse, representing only 15–25% of cortical neurons, individual interneurons typically have extensive axonal arborizations innervating thousands of postsynaptic targets providing an economical system for rapid network synchronization1,2. Precision in this coordination relies upon a remarkable diversity within the interneuron population allowing for exquisite spatiotemporal control of principal cell excitability. Indeed distinct interneuron subtypes with unique developmental, morphological, neurochemical, and electrophysiological profiles are differentially recruited by active circuits to rapidly entrain principal cell populations into patterns of rhythmic activity such as theta and gamma oscillations3. Despite the high degree of interneuron heterogeneity, members of a given subtype typically exhibit homogeneous developmental origins as well as anatomical, molecular, and electrical features that allow them to perform the same functional roles within divergent forebrain microcircuits. The fine control over network dynamics by a minority of cells offers an efficient substrate for neuromodulatory signals to be transmitted and amplified for regulation of circuit activity4. One system that has exploited this arrangement is the ascending subcortical projection path originating from serotonin (5-HT) containing neurons of the median raphe nucleus. These serotonergic fibers densely innervate the hippocampal formation where they terminate on specific subtypes of interneurons5,6 to rapidly modulate hippocampal activity in a manner dependent upon recruitment of GABAergic signaling7,8.
Of significance is the observation that serotonergic afferent target specificity is paralleled by the restricted expression of 5-HT3 receptors (5-HT3Rs) to subsets of cortical interneurons9,10. Although seven main classes of 5-HT receptors exist, 5-HT3Rs represent the only fast signaling ionotropic receptors within the family making them likely molecular candidates to mediate the rapid modulation of network dynamics by behavioral state driven changes in serotonergic input.
Two recent studies characterizing Htr3a-GFP reporter transgenic mice found that in the neocortex 5-HT3AR expression is highly restricted to caudal ganglionic eminence- (CGE-) derived calretinin (Calr), vasoactive intestinal peptide (VIP), cholecystokinin (CCK), neuropeptide Y (NPY), and reelin expressing interneurons with minimal expression by medial ganglionic eminence- (MGE-) derived parvalbumin (Parv) and somatostatin (SOM) cell populations9–11. Indeed developmental studies have all revealed significant 5-HT3AR expression within cells emerging from the CGE, but not MGE, progenitor zones9,11. Here, we confirm the expression of 5-HT3AR in all prototypical CGE-derived hippocampal interneurons including CalrCR, VIP, reelin, and CCK expressing cohorts. However, we additionally discovered a prominent subpopulation of hippocampal SOM-containing interneurons that express functional 5-HT3ARs. This divergence extended to anatomically and electrophysiologically confirmed oriens-lacunosum moleculare (O-LM) interneurons parsed into 5-HT3AR-containing and -lacking subpopulations. Moreover, these two O-LM subsets were found to differentially participate in hippocampal network oscillations with the degree of 5-HT3AR-containing O-LM cell recruitment being regulated by serotonergic tone. Our findings reveal a remarkable divergence within what has until now been considered an anatomically, neurochemically, and electrically, homogeneous interneuron subtype with singular developmental origin indicating that individual members of seemingly uniform interneuron populations may have unique circuit functions and neuromodulatory properties dictated by disparate developmental origins.
Results
A population of Htr3a-GFP+ hippocampal interneurons express somatostatin
We initially determined the migratory routes and time course for hippocampal invasion by the Htr3a-GFP-expressing cells throughout development. In the embryo, tangentially migrating streams of labeled cells were evident in the marginal and subventricular zones (MZn, SVZ; Fig. 1a). The first Htr3a-GFP labeled cells entered the hippocampal anlage at E13.5 (Fig. 1a, c) and their density increased during subsequent development (E13.5 to E18.5) with peak values measured around the day of birth (P0; Fig. 1a, c). During the first postnatal week, a 10-fold decrease in whole hippocampal density occurred with levels reaching stability at approximately P20-P30 (Fig. 1a, c). This reduction likely reflects the combined effects of dilution, due to expanding brain volume, and neuronal death as previously described12, 13. In general the migratory routes, time course, and biphasic density profile of Htr3a-GFP-expressing cells populating the hippocampus parallel our prior observations for invasion of hippocampal interneurons obtained in different interneuron reporter lines14. Importantly, the ultimate density of Htr3a-GFP-expressing cells in mature Htr3a-GFP mice is approximately twice that measured previously in a CGE reporter line (GAD65-GFP) that we estimated to reveal only 50% of all CGE-derived hippocampal interneurons12. Thus, as for the neocortex9,11, it appears that the Htr3a-GFP line comprehensively reports CGE-derived interneurons of the hippocampus.
Figure 1. Migration, hippocampal invasion and immunocytochemical profiles of GFP expressing cells in Htr3a-GFP mice.

(a) Representative images illustrating the migration of Htr3a-GFP-reported cells during embryonic and postnatal development (E13.5 to P30; MZ-marginal zone, SVZ-subventricular zone). (b) Representative images of P30 hippocampal sections showing extent of co-localization of Htr3a-GFP-reported interneurons and various immunocytochemical markers. (c) Average density of total hippocampal Htr3a-GFP-reported interneurons during development (n = 3 – 4 mice and cells were counted from a total of 10 – 25 hippocampal sections per developmental time point. (d) Percentage of marker-expressing cells that were GFP + in the CA1 hippocampal subfield of Htr3a-GFP mice. (e) Percentage of Htr3a-GFP-reported cells in the CA1 subfield of hippocampus that co-labeled with the indicated marker. In (d) and (e), n = 3 – 4 mice and cell counts were from 16 – 25 hippocampal sections per marker. The total number of Htr3a-GFP-reported cells counted were 6428 (CCK), 2512 (Calr), 4488 (VIP), 4081 (reelin), 4174 (Parv) and 3412 (SOM). Box-and-whisker plots are constructed as follows: circle and line within box denotes mean and median, respectively; upper and lower limits of box and capped lines indicate SEM and min/max data points, respectively.
We next examined the neurochemical identity of Htr3a-GFP-expressing cells in hippocampal sections by performing immunocytochemical analyses employing well-established markers. For these experiments we used sections from Htr3a-GFP mice obtained at P30, a developmental stage where labeled cells have reached a steady state density (Fig. 1c). Focusing on the CA1 subfield we found that GFP was expressed by the majority of CCK+ (78±7%), Calr+ (74±9%) and VIP+ (75±7%) cells (Fig. 1b, d) all of which arise from CGE progenitors12,15. Similarly, a high percentage of reelin+ cells (67±7%) co-expressed GFP, particularly in stratum lacunosum moleculare (St.LM) where reelin expressing cells likely comprise the CGE-derived subset of neurogliaform interneurons14,16 (Fig. 1b, d). Virtually no expression of GFP was noted in hippocampal Parv+ interneurons (2±2%; Fig. 1b, d) in agreement with observations in the necortex of Htr3a-GFP mice9,11. However, in striking contrast to neocortical observations, we found that a number of hippocampal SOM+ cells were GFP labeled in Htr3a-GFP mice (32±15%; Fig. 1b, d) which accounted for approximately 10% of all GFP expressing cells located within CA1 (Fig. 1e). A sub-population of O-A interneurons are known to express both Parv and SOM17. From the minimal overlap of Htr3a-GFP and Parv described above (Fig, 2c) it is unlikely that this subset are CGE-derived. Nevertheless, we directly tested this using double immunofluorescent staining of Parv and SOM in both Htr3a-GFP and MGE reporter Nkx2-1-cre:RCE mouse lines and confirmed that all Parv+/SOM+ interneurons are MGE-derived (Supplementary Fig. 1).
Neocortical interneurons display a patterned laminar distribution, with CGE-derived interneurons being predominantly located in superficial layers and MGE-derived interneurons being more prominent in deep layers9,11,18,19. Consistent with the superficial layer preference of CGE-derived interneurons, we found that most GFP labeled cells in the CA1 of Htr3a-GFP mice localized to St.LM, where they typically co-expressed the CGE markers reelin, CCK, Calr, or VIP but not the prototypical MGE markers Parv or SOM (Fig. 2a–c). While only a minority of GFP labeled cells populated the deeper stratum radiatum (St.R) and pyramidale (St.P) layers, a relatively large number of labeled cells localized to the deepest hippocampal layer within stratum oriens/alveus (O-A) revealing a divergence from the stratification of Htr3a-GFP expressing interneurons of the neocortex9 (Fig. 2a, b). Within O-A almost half of the GFP labeled cells were immunopositive for SOM (39 ± 5%) indicating that the CGE-derived SOM+ interneurons are prevalent and exhibit a stratification preference similar to their MGE-derived counterparts12 (Fig. 2c). In addition to reporting putative reelin+, St.LM restricted CGE-derived neurogliaform cells14,16, the Htr3a-GFP transgenic mouse also revealed a population of reelin+ interneurons in O-A (Fig. 1b), a lamina that we now show contains a marked population of Htr3a-GFP reported SOM+ interneurons (Fig. 2c). In fact, a large percentage of the SOM+ Htr3a-GFP-expressing cells were also found to contain reelin (68±22%; data not shown), consistent with the common colocalization of reelin and SOM in neocortical and hippocampal interneurons9,16,18. In the neocortex a subset of SOM+ interneurons co-express Calr20, 21, but this neurochemical signature is not prevalent in the hippocampus. Indeed, although Htr3a-GFP mice report the vast majority of hippocampal Calr+ cells (Fig. 1b, c) we did not observe substantial overlap with the SOM+ population of GFP labeled cells in this line (3.5±2.8%; data not shown).
Figure 2. A persistent subpopulation of GFP expressing interneurons co-express somatostatin in CA1 stratum oriens of Htr3a-GFP mice.

(a, b) Representative image and quantification of the distribution of Htr3a-GFP-reported interneurons in the varying lamina of the CA1 subfield (O-A- stratum oriens/alveus; St.P – stratum pyramidale; St.R – stratum radiatum; St.LM – stratum lacanosum moleculare; n = 4 mice and a total of 8 hippocampal sections per mice were examined for counting; total cells counted for O-A, St.P, St.R and St.LM were 1009, 638, 537 and 1420, respectively. (c) Percentage of O-A (black) and St.LM (gray) Htr3a-GFP–reported interneurons that express the various immunocytochemical markers as indicated (n = 3 – 4 mice and a total of 25 – 47 hippocampal sections were examined per marker; number of cells counted for O-A and St.LM were 1621,2062 (CCK); 658,1015 (Calr); 1121,1875 (VIP); 974,1645 (Reelin); 944,1751 (Parv); 744,1335 (SOM), respectively. (d, e) Representative images and quantification illustrating the co-localization between Htr3a-GFP driven GFP and somatostatin in CA1 O-A subfield across a range of postnatal developmental time points (n = 3 – 4 mice and a total of 9 – 11 hippocampal sections were examined per developmental time point; number of cells counted for P5–10, P20, P30 and P60 were 2059, 933, 336, 571 and 476, respectively.). (f) Representative image demonstrating co-localization of somatostatin and GFP-expressing CA1 O-A interneuron (arrow) in the Mash1Cre:RCE reported mouse line following tamoxifen adminstration at E12.5. (g, h) Percentage co-localization between somatostatin and GFP in CA1 O-A interneurons of the Mash1Cre:RCE reported mouse line following tamoxifen administration at varying embryonic developmental stages (n = 3 mice; total number of cells counted at E12.5, E14.5, E16.5 for (g) were 312, 587, 509 and for (h) were 59, 82, 48, respectively). In all cases immunocytochemistry was performed at P30. Box-and-whisker plots are constructed as follows: circle and line within box denotes mean and median, respectively; upper and lower limits of box and capped lines indicate SEM and min/max data points, respectively.
As previously highlighted (Fig. 1c), a dramatic reduction in the density of Htr3a-GFP cells was noted during postnatal development. To determine whether the proportion of SOM+ GFP-expressing cells observed in the Htr3a-GFP mouse remains constant throughout this period we examined the extent of overlap at various postnatal ages. Our data show that the percentage of Htr3a-GFP GFP+ cells that co-expressed SOM in O-A remains constant between P5 and P60 demonstrating the persistence of this interneuron subpopulation (Fig. 2d, e).
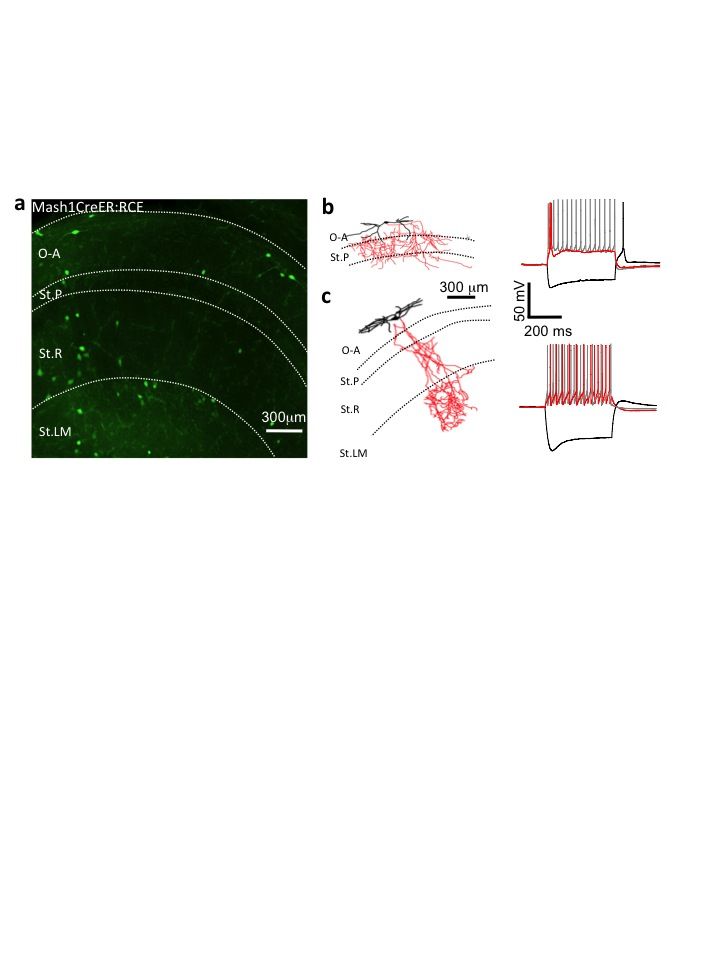
To verify the existence of a putative CGE-derived hippocampal SOM+ interneuron cohort, we employed an alternate strategy to label CGE-derived interneurons. To this end we examined the Mash1CreER:RCE mouse line12,18 in which GFP expression is limited to subpopulations of CGE-derived interneurons born within approximately 1 day of maternal tamoxifen administration during embryogenesis. Our data demonstrates the presence of GFP+ O-A interneurons that are co-labeled with SOM following tamoxifen administration at E12.5, E14.5, or E16.5 (Fig. 2f–h). These findings confirm the existence of CGE-derived SOM+ cells with temporal origins that are delayed relative to MGE-derived SOM+ cells consistent with the overall delayed pattern of CGE neurogenesis relative to that in the MGE12,18,19.
Properties of somatostatin-expressing interneurons reported in Htr3a-GFP mice
While the laminar positioning (O-A preference) and neurochemical profiles (reelin+/Calr−) of SOM-expressing cells reported in Htr3a-GFP mice are similar to MGE-derived SOM+ hippocampal interneurons, it remains possible that the CGE contributes a unique subset of O-A SOM+ cells with distinct features. Indeed, in addition to unique immunocytochemical signatures, distinct interneuron subtypes may be parsed based on their anatomical and physiological characteristics22. Moreover, considerable diversity is known to exist within the SOM expressing cohort of cortical interneurons12,23,24. We therefore performed patch-clamp recordings in acute hippocampal slices of Htr3a-GFP mice targeting individual GFP labeled cells in CA1 O-A to determine the functional and anatomical features of the CGE-derived SOM+ interneuron cohort. Out of 58 O-A GFP labeled interneurons cells recorded in the Htr3a-GFP line, 38 were found to be SOM+ (i.e. 52%), a value in close agreement with the overall degree of co-localization between SOM and GFP in the O-A region of these mice (Fig. 2c, e), and subsequent analyses was restricted to this subset. Although, a population of cells exhibited low input resistance with fast-spiking stuttering firing properties similar to a group of SOM expressing interneurons described in layer IV neocortex23 (e.g. Fig. 3a), the majority exhibited12, 24, 25 high input resistances, slow membrane time constants, notable depolarizing sag upon hyperpolarization and slow accommodating action potentials12,24,25 (Fig. 3b–d, and Table 1). Anatomical recovery following whole cell recordings revealed that all SOM+/GFP+ cells possessed horizontally oriented dendrites primarily within O-A and axonal projections that targeted O-A, St.R, and St.LM (Fig. 3a–d). Of particular note was the recovery of SOM+/GFP+ interneurons with significant axonal ramification in St.LM, a distinctive feature of the O-LM subtype of interneuron (Fig. 3d), a cell type that is also reported in Nkx2-1-cre:RCE MGE reporter mice25. To independently verify the existence of a CGE-derived cohort of O-LM interneurons we examined whether these interneurons comprise a portion of the SOM+ cells reported by the Mash1CreER:RCE CGE mouse line. GFP+ O-A interneurons in juvenile Mash1CreER:RCE mice exposed to tamoxifen at E14.5 (Supplementary Fig. 2a) were targeted for whole-cell recording and subsequent anatomical recovery. As expected for a CGE-reporter mouse line, a large proportion of recovered cells were non-fast spiking (presumably CCK) basket cells12 (Supplementary Fig. 2b). However, 8/58 GFP+ O-A cells tested were anatomically identified as O-LM interneurons with passive membrane and firing properties similar to Htr3a-GFP and Nkx2-1-cre:RCE reported O-LM cells (Supplementary Fig. 2c) further confirming that a subpopulation of hippocampal O-LM cells originate from the CGE.
Figure 3. Morphological and firing properties of SOM+ Htr3a-GFP-reported O-A interneurons.

(a–d) Single examples of SOM+/GFP+ interneurons located in CA1 O-A from which intrinsic membrane and firing properties were measured via whole cell patch clamp recordings in slices from Htr3a-GFP mice. Confocal images show Htr3a-GFP-driven GFP expression (top panels; green), biocytin conjugated immunofluorescence (middle panels; red), and SOM immunoreactivity (bottom panels; blue). Corresponding anatomical reconstructions of SOM+/GFP+ interneurons showing the dendritic (black) and axonal (red) arborizations are also shown. Below each reconstructed interneuron are electrophysiological membrane and action potential firing responses for hyperpolarizing, near threshold and, 2×threshold somatic current injections as indicated (single examples were taken from a total of 29 post-hoc confirmed SOM+/Htr3a-GFP+ cells recorded in 13 mice) (e–g) Representative images depicting the co-localization of 5-HT3ARCre activity reported by tdTomato fluorescence (see methods) with somatostatin (SOM) immunoreactivity in CA1 O-A. (h) Pooled data of the percentage co-localization of 5-HT3ARCre:tdTOM fluorescence and SOM immunoreactivity in CA1 O-A interneurons (n = 3 mice and cell counts were performed in a total of 8 hippocampal sections; total number of cells counted were 109 and 125 for black and gray data, respectively). Box-and-whisker plots are constructed as follows: circle and line within box denotes mean and median, respectively; upper and lower limits of box and capped lines indicate SEM and min/max data points, respectively.
Table 1.
Comparision of the membrane and firing properties of CGE-derived SOM+ cells, CGE- and MGE-derived O-LMs.
| Parameter | Group I Htr3a-GFP+ SOM+ Cells (n=29) | Group 2 Htr3a -GFP+ O-LM Cells (n=33) | Group 3 Nkx2-1-cre:RCE O-LM cells (n=25) | Statistical Comparison (p<0.05; ANOVA) |
|---|---|---|---|---|
| Resting potential (mV) | −66 ± 2 | −65 ± 2 | −64 ± 2 | ns |
| Input Resistance (mΩ) | 364 ± 43 | 306 ± 22 | 242 ± 24 | 1>3 |
| Time Constant (ms) | 38 ± 3 | 38 ± 3 | 34 ± 3 | ns |
| Sag Index | 0.85 ± 0.02 | 0.85 ± 0.02 | 0.86 ± 0.01 | ns |
| Frequency at 2 × Threshold (Hz) | 18 ± 2 | 21 ± 3 | 15 ± 2 | ns |
| Adaptation Ratio at 2 × Threshold | 0.67 ± 0.04 | 0.63 ± 0.03 | 0.57 ± 0.04 | ns |
| First Spike Threshold (mV) | −40 ± 0.9 | −41 ± 0.8 | −40 ± 1.2 | ns |
| First Spike Amplitude (mV) | 63 ± 2 | 64 ± 2 | 68 ± 3 | ns |
| First Time to Repolarize (ms) | 3.9 ± 0.4 | 4.5 ± 0.5 | 4 ± 0.4 | ns |
| First Maximal Decay Slope (ms) | −106 ± 6 | −98 ± 5 | −101 ± 9 | ns |
| First AHP Amplitude (ms) | 21.4 ± 1.2 | 17.6 ± 0.9 | 18.3 ± 0.7 | 1>2 |
| First AHP half-width (ms) | 72 ± 14 | 77 ± 13 | 68 ± 7 | ns |
Parameters for membrane and firing properties were obtained as outlined in the methods. For group 1, only Htr3a-GFP-expressing O-A cells that were post-hoc immunoytochemically confirmed to express SOM were included. For group 2 and group 3 cells, only anatomically identified O-LM interneurons from the Htr3a-GFP or Nkx2-1-cre:RCE-reported mice were included, respectively. n values in parantheses refer to the number of cells tested taken from 13, 16 and 14 mice for Groups 1, 2 and 3 respectively. ANOVA analysis was performed to determine statistical significance between the means of each group. All values are given as mean ± SEM. > denotes mean is significantly higher at the p<0.05 confidence level; ANOVA test. ns denotes no significant difference was observed.
Early and protracted expression of SOM by hippocampal Htr3a-GFP+ cells
The major difference between MGE- and CGE-derived SOM+ cells defined in our study relates to 5-HT3AR promoter activity, and thus, presumably 5-HT3AR expression. However, the Htr3a-GFP transgenic mouse exploited in this study does not label cells in a permanent fate-mapped manner, yielding expression of GFP only in the cohort of cells with 5-HT3AR promoter activity at the time of examination. Thus, although the SOM+/GFP+ population of cells reported in Htr3a-GFP line is stable from early postnatal time points into adulthood (Fig. 2d–e), it remains possible that all hippocampal SOM expressing interneurons, including the entire O-LM subpopulation, transition through a phase of 5-HT3AR expression with many of them down-regulating these receptors. To assay this possibility we crossed a Htr3a-cre mouse (GENSAT26) with a floxed tdTomato reporter line27 (Ai14) to permanently label all cells that have expressed 5-HT3AR-promoter driven cre-activity at any point during their lifespan. As for the Htr3a-GFP transgenic line the resulting Htr3a-cre:tdTOM offspring reported only a subset of O-A SOM expressing interneurons at P30–60 (42 ± 5%; Fig. 3e–h) confirming that just over half of the O-A SOM interneuron population had never exhibited 5-HT3AR promoter activity. Since O-LM interneurons represent the dominant subset of hippocampal O-A SOM-expressing interneurons28, these findings are consistent with the parsing of O-LM interneurons into a subset that stably expresses 5-HT3ARs (CGE-derived) and another that never expresses these receptors (MGE-derived).
One potential explanation for the apparent dual origins of O-LM interneurons could be that the Htr3a-GFP and Nkx2-1-cre:RCE transgenic lines overlap in reporting this cell type. Despite segregation of the GFP expressing cells to MGE and CGE progenitor zones in Nkx2-1-cre:RCE and Htr3a-GFP embryos respectively9,11,20,29, it is possible that a subset of MGE-derived O-LM interneurons from the Nkx2-1 lineage are induced to express 5-HT3ARs during migration or after taking up residence in the hippocampus. To initially examine this possibility we crossed the Htr3a-GFP mouse line with an Nkx2-1-cre:tdTOM line to determine the extent of overlap between the genetically reported cells amongst O-A interneurons (Fig. 4a). Importantly, the low overall percentage overlap of Nkx2-1-cre-tdTOM and Htr3a-GFP reported cells (7.7 % ± 3.6 %; Fig. 4a, b) is in agreement with observations in the neocortex9. Specifically examining the SOM+ cohort of O-A interneurons we found that approximately 60% are derived from Nkx2-1 progenitors with the remainder being reported by the Htr3a-GFP (Fig. 4a, c) consistent with our previous data in the individual mouse lines12 (Fig. 2c). Even when limiting evaluation of overlap to this SOM immunopositive population within O-A we observed that only 11.3 % ± 5.1 % of SOM+ cells dually expressed Nkx2-1-cre:tdTOM and Htr3a-GFP (Fig. 4a, c). Therefore the vast majority (approximately 90%) of Htr3a-GFP-reported O-LMs do not possess Nkx2-1-cre activity during any point in their development consistent with our previous data demonstrating a lack of 5HT3AR mRNA in hippocampal interneurons reported in the Nkx2-1-cre:RCE mouse line, including O-LM interneurons12.
Figure 4. Htr3a-GFP- and Nkx2-1-cre-reported O-LM interneurons are largely non-overlapping subpopulations that are parsed by the functional expression of 5-HT3ARs.

(a) Representative images of SOM immunoreactivity in the CA1 O-A region in transgenic mice reporting both Htr3a-GFP and Nkx2-1-cre:tdTOM. (b, c) Degree of overlap between Htr3a-GFP- and Nkx2-1-cre:tdTOM throughout O-A (b) and specfically within the O-A SOM+ cohort of cells (c). n = 4 mice and counts were performed from a total of 16 hippocampal sections; total number of cells counted in (b) and (c) were 337 and 168, respectively. Box-and-whisker plots are constructed as follows: circle and line within box denotes mean and median, respectively; upper and lower limits of box and capped lines indicate SEM and min/max data points, respectively. (d–g) Representative morphologies of Htr3a-GFP- and Nkx2-1-cre:tdTOM-reported O-LM interneurons. Below each example are electrophysiological membrane and action potential firing responses for hyperpolarizing, near threshold, and 2 × threshold somatic current injections as indicated. Also shown for each O-LM interneuron are traces depicting current responses under voltage-clamp upon puffing of either 1 μM mCPBG or 100μM nicotine (NIC) in the absence or presence of the antagonists 10 nM ondansetron (OND) or 10 nM methyllycaconitine (MLA). (h) Percentage of Htr3a-GFP- and Nkx2-1-cre:tdTOM-reported OLM interneurons that displayed a response to mCPBG or nicotine puff application (the number of cells that responded out of all anatomically confirmed O-LM cells tested are indicated above the bars; data are from 4 – 9 mice). (i) Single data and mean values of peak amplitude of responses to mCPBG or nicotine puff in the absence and presence of OND and MLA, respectively. (*, Wilcoxon Signed-Rank test, p < 0.05). Error bars in (i) denote SEM.
Electrophysiological comparison of CGE- and MGE-derived O-LMs
We next investigated whether MGE- and CGE-derived O-LM interneurons diverged in their physiological properties. The two populations of O-LM interneurons exhibited high input resistances, slow membrane time constants, notable membrane depolarizing sag upon hyperpolarization, slow action potentials and moderate frequency accommodating spike discharges upon sustained depolarization. Thus, O-LM interneurons derived from the MGE and CGE, respectively, could not be differentiated based on any of the passive membrane and firing parameters tested (Fig. 4d–g; Table 1). Recruitment of O-LM interneurons via muscarinic receptors, in particular M1 and M3 subtypes, may play an important role in the entrainment of the hippocampal network during physiological relevant rhythms25,30. We therefore tested whether functional expression of muscarinic receptors was confined exclusively to either MGE or CGE-derived O-LM interneurons. Our data showed that both MGE- and CGE-derived O-LM interneurons display the previously observed muscarinic receptor-mediated increases in firing and the emergence of a pronounced after-depolarization following a train of action potentials41 (Supplementary Fig. 3). Another stereotypical feature of O-LM interneurons is the expression of group 1 metabotropic glutamate receptors31, particularly the mGlu1a subtype17. Expression of mGlur1a protein was observed in a subset of both MGE- and CGE-derived SOM+ O-A cells (Supplementary Fig. 4a–b). Moreover, all GFP+ O-LM cells tested in Htr3a-GFP+ (n=3) or Nkx2-1-cre:RCE (n=4) mice responded to bath applied DHPG (Supplementary Fig. 4c–e). Thus, MGE- and CGE-derived O-LM cells cannot be distinguished based on basic membrane and spiking properties or muscarinic and mGlu1/5 response profiles.
To this point, other than origin, the only identifiable difference between MGE- and CGE-derived O-LM cells relates to Htr3a-GFP expression. Therefore, we tested whether the two subsets of O-LM cells functionally segregate with respect to 5-HT3AR-activation. Post-hoc morphological analyses were performed and only cells that displayed typical O-LM anatomies were included in the dataset (e.g. Fig. 4d–g). In 14 out of 15 Htr3a-GFP reported O-LM interneurons, local somatic application of the 5-HT3AR specific agonist, (mCBPG; 1 μM) elicited a fast inward current under voltage-clamp conditions at a holding potential of −60 mV (Fig. 4d, h, i). In all cells tested, this response was significantly inhibited by the 5-HT3AR-specific antagonist, ondansetron (Wilcoxin Signed-Rank test, p < 0.05; Fig. 4d, i), thus, confirming the presence of functional 5-HT3AR expression in the CGE-derived subset of O-LM interneurons. Furthermore, in 4/5 Htr3a-GFP reported O-LM interneurons local application of 100μM nicotine also produced a fast inward current that was significantly blocked by the specific receptor antagonist methyllycaconitine (Wilcoxin Signed-Rank test, p < 0.05; MLA; Fig. 4e, h, i) demonstrating the additional expression of functional nicotinic receptors in agreement with previous studies of neocortical Htr3a-GFP interneurons9. In contrast, no O-LM interneurons reported in Nkx2-1-cre:RCE mice responded to mCPBG (Fig. 4f–h), although they did exhibit robust nicotinic receptor mediated responses that were also significantly blocked by MLA (Wilcoxin Signed-Rank test, p < 0.05; Fig. 4g–i). These data clearly confirm a divergence between MGE- and CGE-derived O-LM interneurons with respect to functional 5-HT3AR expression. Due to this distinction it is expected that CGE-derived interneurons O-LM interneurons will be preferentially recruited over O-LM interneurons derived from the MGE during behavioural states that engage the raphe nucleus.
Recruitment of MGE- and CGE-derived O-LMs during hippocampal network activity
An additional feature used to define distinct interneuron subtypes relates to the temporal structure of their firing during discrete circuit rhythms3,32. Thus, we investigated whether MGE- and CGE-derived O-LM cells differentially participated in hippocampal network oscillations. Brief local application of 1 mM kainate within the CA1 St.R readily produced gamma oscillations33,34 (Supplementary Fig. 5) during which we monitored the firing of CGE- or MGE-derived O-LM cells (Fig. 5a, b). While none of the O-LM cells fired under basal conditions, most (85%) fired during kainate-induced gamma oscillations (Fig. 5c–e) consistent with previously reported participation of O-LM cells in carbachol induced gamma oscillations in vitro35. CGE-derived O-LM cells (n=30) exhibited a mean firing probability per gamma cycle of 0.033 ± 0.008 which was significantly lower than that measured in MGE-derived O-LM cells (n=16, comprised of 5 Nkx2-1-cre:RCE cells and 11 5 Htr3a-GFP-negative cells) that displayed a mean firing probability per gamma cycle of 0.158 ± 0.029 (Fig. 5e; p = < 0.0001, Mann-Whitney U-test). Importantly, the mean gamma-band power in recordings between Htr3a-GFP (1.013 ± 0.21 μV2/Hz; n=28) and Nkx2-1-cre:RCE (1.02 ± 0.28 μV2/Hz; n=11) mice was not significantly different (Supplementary Fig. 6a, b; p = 0.413, Mann-Whitney U-test), nor was the mean gamma frequency (70.6 ± 1.1 Hz vs. 73.0 ± 1.9 Hz in slices from Htr3a-GFP and Nkx2-1-cre:RCE, respectively; p = 0.413, Mann-Whitney U-test; Supplementary Fig. 6c). To better control for any potential slice to slice variability in oscillations we simultaneously recorded CGE- and MGE-derived O-LM cells in the same slice in a subset of experiments by dually recording from GFP+ (CGE-derived) and a GFP-negative (presumed MGE-derived) O-LM interneurons in Htr3a-GFP mice. Under such experimental conditions where MGE- and CGE-derived O–LM interneurons were subject to the same kainate-induced gamma -band power simultaneously, a difference in mean firing probability during the oscillations was still evident (GFP+ CGE O-LM vs GFP- MGE O-LM: 0.027 ± 0.011 vs 0.061 vs 0.010, t = 5.76, p = 0.0104, paired t-test, Supplementary Fig.7). These data firmly exclude any potential differences in kainate-induced gamma power and frequency between slices as the underlying cause of the divergent recruitment of MGE- and CGE-derived O-LM interneurons. Considering the phase preference of the gamma oscillation for O-LM cell peak firing (20° bins), CGE-derived O-LMs were weakly but significantly phase-locked at 211° with a mean firing probability of 0.004 (R = 1.05, p < 0.05, Moore’s non-parametric second order one-sample test, Fig. 5f, h). In contrast MGE-derived O-LMs exhibited phase-locking at 177° with a mean firing probability of 0.021 (R = 1.43, p < 0.002, Moore’s non-parametric second order one-sample test, Fig. 5g, h). The phase preference of these two cohorts was significantly different (U2 =0.46, p = 0.0002, Watson’s circular U2 test) such that MGE- and CGE-derived O-LMs had a preference near the peak and the descending phase of the field gamma oscillation, respectively (Fig. 5f–h). In summary, these data illustrate that MGE- and CGE-derived O-LM interneurons differentially participate in kainate-induced gamma oscillations and exhibit unique phase preferences revealing that these two O-LM cell populations provide unique functional contributions to network dynamics.
Figure 5. Differential participation of CGE- and MGE-derived O-LM cells during kainate-induced gamma oscillations.

(a, b) Reconstructions of representative O-LM cells recorded in Htr3a-GFP (a) and Nkx2-1-cre:RCE mice (b) during kainate induced gamma oscillations. (c, d) Whole cell current-clamp (above) and simultaneous field recording traces (below) obtained while monitoring the O-LM cells illustrated in panels A and B demonstrating their participation during gamma oscillations induced by application of 1mM kainate (at time indicated by arrows) in the stratum radiatum. Expanded traces delineated by red dotted boxes are also shown for each subtype of O-LM cell. (e) Individual and pooled data values for the probability of spike firing in Htr3a-GFP-expressing or Htr3a-GFP-negative and Nkx2-1-cre:RCE O-LMs interneurons during a gamma cycle (****, Mann-Whitney U-test, p < 0.0001). Inset shows cumulative frequency distribution of firing probability per gamma cycle for CGE-derived (i.e. Htr3a-GFP-expressing; green line) and MGE-derived (i.e. Htr3a-GFP-negative or Nkx2-1-cre:RCE; blue line) O-LM interneurons. (f, g) Mean firing probability of Htr3a-GFP-expressing or Htr3a-GFP-negative and Nkx2-1-cre:RCE O-LMs interneurons during a gamma cycle (20° bins), relative to the phase of the field oscillation (red line). (h) Polar plots showing preferred phase and firing probability of individual Htr3a-GFP-expressing (left panel; symbols) or Htr3a-GFP-negative and Nkx2-1-cre:RCE O-LMs (right panel; symbols) interneurons and the corresponding mean vector (arrows) during gamma cycle. The n values for Htr3a-GFP+, Nkx2-1-cre:RCE and Htr3a-GFP–ve datasets are 30, 11, and 4 cells taken from 20, 7 and 4 mice, respectively. Error bars denote SEM.
The selective expression of 5-HT3ARs by CGE-derived O-LM interneurons could permit their preferential recruitment to participate in rhythmic network activity during behavioral states associated with increased serotonergic tone. To test this hypothesis we investigated whether activation of 5-HT3ARs influences O-LM interneuron firing during gamma oscillations. We concurrently applied the selective 5HT3AR agonist mCPBG (1μM) locally within O-A during the same brief period that we applied kainate in St.R to induce the gamma oscillations (Supplementary Fig. 5). Remarkably, 5HT3AR activation doubled the firing probability of CGE-derived O-LM cells during each gamma cycle without altering their phase preference (Fig. 6a, c, e; kainate only: 0.043 ± 0.017 vs kainate + mCPBG: 0.092 ± 0.038, n=8, W = −30, p=0.0391, Wilcoxon Signed-Rank test). In contrast, mCPBG did not alter the firing probability or phase preference of MGE-derived O-LM cells during gamma oscillations (Fig. 6b, d, f; kainate only: 0.236 ± 0.063 vs kainate + mCPBG: 0.201 ± 0.067, n=5, W = 7, p = 0.4375, Wilcoxon Signed-Rank test) confirming a selective recruitment of CGE-derived O-LM cells by 5-HT3AR activation.
Figure 6. 5HT3AR activation during gamma oscillations increases the firing probability of CGE-derived O-LM cells but not MGE-derived O-LM cells.

(a, b) Representative example recordings obtained in Htr3a-GFP (a) and Nkx2-1-cre:RCE (b) mice illustrating the response profiles of CGE- and MGE-derived O-LM cells during gamma oscillations induced by kainate (1mM) application without (black traces, left) and with (blue traces, right) co-application of mCPBG (1μM). (c, d) Firing probabilities during the kainate-induced gamma cycle (20° bins, averaged over 3 trials) for the neurons shown in A and B without (black trace) or with (blue trace) co-application of mCPBG. (e, f) Individual and group summary data illustrating the probability of spike firing in Htr3a-GFP or Nkx2-1-cre:RCE-reported O-LM interneurons during kainate-induced gamma cycles in the absence and presence of mCPBG (*, Wilcoxon Signed-Rank test, p < 0.05; ns, not significant). The n values for Htr3a-GFP+ and Nkx2-1-cre:RCE datasets are 8 and 5 cells taken from 4 and 5 mice, respectively. Error bars denote SEM.
Discussion
Here, we have demonstrated that hippocampal interneurons expressing Htr3a-GFP consist of CCK+, VIP+, Calr+, reelin+ subtypes. Given that 5-HT3AR-GFP expression in this mouse line serves as a marker for all neocortical CGE-derived interneurons9,11, this expression profile in hippocampus was not surprising since we previously found these markers to principally affiliate with CGE-derived interneurons such as CCK+ basket cells, Schaffer collateral associated cells, and a subset of neurogliaform cells12,14. However, a novel finding in the current study, verified in 3 independent mouse lines (Htr3a-GFP, Mash1Cre:RCE and Htr3a-cre:tdTOM), was the identification of a population of SOM+/Htr3a-GFP-expressing hippocampal O-A interneurons. This observation was unexpected since both neocortical and hippocampal SOM+ interneurons have been, until now, reported to arise primarily from MGE progenitors12,19,20,36. Moreover, 5-HT3AR expression is extremely rare in neocortical SOM+ cells9,11 and 5-HT3AR mRNA was never encountered in hippocampal SOM+ interneurons of MGE lineage12. Taken together, these data strongly indicate that a cohort of SOM+, 5-HT3AR GFP-expressing interneurons originate from the CGE and populate the hippocampus while essentially avoiding the neocortex. Recently, we employed the Nkx2-1-cre:RCE transgenic reporter line of mice and demonstrated an MGE origin for anatomically, electrophysiologically, and neurochemically confirmed hippocampal SOM+ interneurons12. Therefore, hippocampal SOM+ interneurons are derived from both CGE and MGE progenitor pools. Of particular note is the fact that the dual origins of these O-A SOM+ interneurons extend to one of the most recognizable and well-characterized dendritic targeting hippocampal interneuron subtype, the O-LM cell. This is in contrast with the neocortex where the closely related Martinotti cells have been repeatedly demonstrated to arise solely from the MGE19,20,37. A recently identified transcription factor, Satb1, is exclusively expressed by MGE-derived Parv+ and SOM+ interneurons in the neocortex where it plays a central role in their migration, terminal differentiation, maturation and survival38,39. Furthermore, in preliminary studies, we found that all SOM+ cells in O-A of hippocampus (and therefore O-LM interneurons), including those that are Htr3a-GFP-positive and hence CGE-derived express Satb1 protein (Supplementary Fig. 8), revealing a further divergence between neocortex and hippocampus. Thus, it is clear that differences of the developmental programs in neocortex and hippocampus with regard the relationship between embryonic origin and ultimate interneuron identity exist, stressing the importance of specifically investigating distinct brain regions rather than applying dogmatic rules established in one brain region to another.
The presence of GFP in neocortical interneurons of Htr3a-GFP mice corresponds to their functional expression of this receptor9. Here we confirm that this is also the case for Htr3a-GFP–expressing hippocampal interneurons including those of the O-LM subtype. The differential expression of receptors for neuromodulatory substances such as 5-HT, acetylcholine, and cannabinoids between distinct classes of interneurons has been widely appreciated in both neocortex and hippocampus4,32. However, individual members of a given interneuron subtype are typically reported to exhibit homogeneous neuromodulator receptor complements and response profiles40–42. Our current findings reveal an unexpected separation in the 5-HT response profiles of two subpopulations of O-LM cells that have until now been considered a homogeneous interneuron subtype because of their equivalent neurochemical, anatomical, and electrical features.
Precise spatiotemporal control over large ensembles of excitatory principal neurons is a key feature of interneuron function within neural circuits. The varied anatomical, membrane and synaptic characteristics of interneurons can greatly impact the role that each particular subtype plays in driving inhibition-based neuronal rhythms such as those characterized by theta, gamma, and sharp wave ripple oscillations3,43. For example, although basket interneurons originating from MGE and CGE expressing either Parv or CCK, respectively, display similar axonal patterns that target the perisomatic regions of excitatory principal neurons, they possess a number of distinct membrane and synaptic properties that promote differential participation in circuit activity44. As a consequence, both subtypes of basket cells behave and contribute to network oscillations in markedly different manners highlighting a division of labor by distinct subtypes of interneurons3,45,46. In vivo recordings in anaesthetized rats demonstrate that O-LM interneurons are uniformly silenced during sharp wave ripple events and rhythmically recruited during theta oscillations47. Although the sample size in this study was small (n=3) the lack of variance in these response profiles offers no evidence for discrete O-LM cell subsets. However, in vivo studies in both anesthetized and head-fixed awake rodents, demonstrate that only a proportion (2/6) of O-LM interneurons tested were entrained during hippocampal gamma oscillations suggestive of a divergence of function within this particular interneuron population45, 48. Furthermore, in vitro recordings from acute hippocampal slices have revealed two divergent response profiles of O-LM cells during high frequency oscillations49. Here we demonstrate that MGE and CGE-derived O-LM cells are differentially recruited during hippocampal gamma oscillations in acute slices from Htr3a-GFP and Nkx2.1Cre:RCE mice using a model of kainate application to induce the network rhythm33,34. Furthermore, our findings clearly show that the participation of only the CGE-derived O-LM interneurons in synchronized hippocampal network activity can be rapidly modified by serotonergic tone consistent with a report that 5-HT3AR antagonism with ondansetron reduces the recruitment of some hippocampal interneurons in network oscillations recorded in freely moving rats50.
In summary, we reveal a previously unrecognized diversity in hippocampal O-A SOM-expressing interneurons. We have identified: 1) a 5-HT3AR lacking SOM+ interneuron cohort lineally related to Nkx2-1 driven progenitors within the MGE, and 2) a 5-HT3AR expressing SOM+ interneuron cohort specified independent of Nkx2-1, and thus, likely derived from CGE progenitors. Due to this distinction, we show that serotonergic tone may preferentially recruit CGE-derived O-LM interneurons over their MGE-derived counterparts during hippocampal circuit oscillations via activation of 5-HT3ARs. Importantly, the current findings illustrate that dual embryonic origins for a given cell type does not simply equate to cellular redundancy within the hippocampal circuit. Rather, the disparate origins confer unique circuit roles and neuromodulatory properties upon otherwise identical interneurons, perhaps providing a rational basis for the perplexing array of divergent response profiles of anatomically overlapping cell populations to common neuromodulators such as 5-HT, and acetylcholine.
Experimental Procedures
Animals
All experiments were conducted in accordance with animal protocols approved by the National Institutes of Health. Breeding, tamoxifen treatment and genotyping were performed as described previously12, 14. For staging of embryos, noon on the day of the appearance of a vaginal plug was treated as embryonic day 0.5 (E0.5), and the day of birth was considered P0. For studies using the Mash1CreER:RCE inducible line pregnant females were administered 4 mg of tamoxifen (Sigma, St. Louis, MO) in corn oil (20 mg/ml) by oral gavage on E12.5, E14.5 or E16.5.
Immunofluorescence
For embryonic characterization pups were dissected from anesthetized dams by cesarean, rinsed in cold phosphate buffered saline (PBS) and incubated in 4% paraformaldehyde in PBS for 1–3 hrs at 4°C. Tissue was then washed thoroughly in cold PBS 3×30 min and cryoprotected in a 25% sucrose / PBS solution at 4°C overnight. Brains were embedded in Tissue Freezing Medium (Triangle Biomedical Sciences, Durham, NC), frozen in a dry ice / ethanol bath and stored at −80°C. Slices were cut on a cryostat (Leica Microsystems, Bannockburn, IL) to a thickness of 20–30 μm directly onto microslides and processed immediately for immunohistochemistry. Tissue was first washed in PBS for 30 minutes. Slices were then transferred to a ProHisto Amplifier Tray (ProHisto, Columbia, SC) to be incubated in Amplifying IHC Wash Buffer (ProHisto) + 10% goat serum to block for 2 hrs. Subsequently, slices were incubated in chicken anti-GFP antibody (1:2000; Aves Labs, Tigard, OR) for 24–48 hours at 4°C. Samples were then rinsed in wash buffer for 3 × 30 min and then transferred to secondary antibody goat anti-chicken alexafluor 488 (1:1000) (Invitrogen, Carlsbad, CA). Tissue was again rinsed 3×30 minutes and slides were mounted and counterstained with Vectashield + DAPI (Vector Laboratories, Inc, Burlingame, CA). Immunofluorescence was imaged using an Olympus Provis AX70 microscope (Olympus America, Center Valley, PA) and images were captured using QCapture Suite (QImaging, Surrey, BC). In order to ensure that our measurements are not biased by the rapidly increasing size of the mouse brain during this period all measurements are presented as cells/mm3. To achieve this, the surface area of the region of interest was measured using ImageJ software (National Institutes of Health, Bethesda, Maryland, USA) and multiplied by the thickness of the slice. GFP+ interneurons were then manually counted using the cell counter plugin of ImageJ.
For postnatal immunohistochemical characterization of all markers except vasoactive intestinal peptide (VIP) and somatostatin (SOM) mice were perfused transcardially using a 0.1 M PBS solution containing 4% paraformaldehyde followed by overnight postfixation at 4 degrees celsius. For VIP and SOM staining, we used 4% paraformadehyde in PB 0.1M as fixative and postfixed for 2 hours at room temperature. Brains were then cryoprotected using 20–30% sucrose/PBS solution, sliced to 50 μm thickness using a freezing microtome, and kept at 4°C in PBS. After washing in PBS, free-floating sections were blocked for 2h at room temperature in a PBS/0.5% Triton X-100/ 1% BSA/10% normal goat serum (NGS) solution before being incubated overnight at 4°C with primary antibodies diluted in a PBS/0.5% Triton X-100/1% BSA/1% NGS solution (BGT-PBS). Slices were washed with BGT-PBS before being incubated for 2 h at room temperature with secondary antibodies diluted in BGT-PBS. Nuclear counterstaining was performed with 100 ng/ml 4′, 6-diamidino-2-phenylindole (DAPI, Invitrogen, Carlsbad, CA) solution in PBS for 20 min. After extensive washing in PBS, slices were mounted on gelatin-coated slides in Prolong Gold (Invitrogen, Carlsbad, CA). Antibodies were used in the following concentrations: mouse anti-parvalbumin (Parv) (1:2500; Sigma), rabbit anti-Parv (1:2500; Swant, Bellinzona, Switzerland), rabbit anti-SOM (1:1000; DAKO, Carpinteria, CA), rat anti-SOM (1:200; Millipore, Billerica, MA), guinea pig anti-VIP (1:1000; Bachem, Torrance, CA), rabbit anti-calretinin (Calr) (1:1000; Millipore), mouse anti-reelin (1:1000, clone G10; Millipore), rabbit anti-Satb1 (1:1000; Abcam, Cambridge, MA), chicken anti-green fluorescent protein (GFP) (1:2000; Aves Labs, Tigard, OR), goat anti-chicken Alexa Fluor 488, F(ab)2 fragment of goat anti-rabbit Alexa Fluor555, goat anti-guinea pig Alexa Fluor 555, goat anti-rat Alexa Fluor 555 and goat anti-mouse Alexa Fluor 555 (1:500; Invitrogen). Fluorescent images were captured using a Retiga 4000R cooled CCD camera (Qimaging, Surrey, Canada). Cholecystokinin (CCK) staining was performed using mouse ABC elite kit (Vector Laboratories) with tetramethylrhodamine conjugated tyramide (Perkin Elmer) as fluorogen. After washing in PBS sections were treated with 3% H2O2 for 30min in PBS then washed 3×15min in PBS. Blocking and washing steps were the same as above. After incubation for 2 nights at 4°C with mouse anti-CCK (1/1000; CURE, UCLA), sections were incubated with biotinylated goat anti mouse (1/200, Vector Laboratories). After 3×15min wash in PBS, sections were incubated for 1h at room temperature with freshly prepared ABC complex in PBS 0.1% triton X-100 then washed again 3×15min in PBS. Staining was developed for 5 min by applying tetramethylrhodamine conjugated tyramide diluted at 1/75 in amplification plus reagent then stopped by several extensive washes in PBS. For all embryonic and postnatal stages counting was performed on a minimum of 6 hippocampal sections from at least 2 animals. Adjacent serial sections were never counted for the same marker to avoid any potential double counting of hemisected neurons.
Electrophysiology
Characterization of intrinsic membrane and spiking properties
P14-P21 Htr3a-GFP or Nkx2-1-cre:RCE mice were anesthetized with isoflurane, and the brain dissected out in ice-cold saline solution containing (in mM): 130 NaCl, 25 NaHCO3, 1.25 NaH2PO4, 3.5 KCl, 4.5 MgCl2, 0.5 CaCl2, 10 glucose, saturated with 95% O2 and 5% CO2 (pH 7.4). Transverse hippocampal slices (300 μm) were cut using a VT-1000S vibratome (Leica Microsystems, Bannockburn, IL) and incubated in the above solution at 35°C for recovery (1 h), after which they were kept at room temperature until use. Individual slices were transferred to an upright microscope and visualized with infrared differential interference contrast microscopy (Axioscope FS2; Zeiss, Oberkochen, Germany). Slices were perfused (2 ml/min) with extracellular solution composed of (in mM) 130 NaCl, 24 NaHCO3, 3.5 KCl, 1.25 NaH2PO4, 2.5 CaCl2, 1.5 MgCl2, and 10 glucose, saturated with 95% O2 and 5% CO2 (pH 7.4). Recordings were performed at 32–34°C with electrodes (3–5 MΏ) pulled from borosilicate glass (World precision instruments) filled with 150mM K-gluconate, 3 MgCl2, 0.5 EGTA, 2 MgATP, 0.3 Na2GTP and 10 HEPES plus 2 mg/ml biocytin (Sigma). The pH was adjusted to 7.4 with KOH (~300 mOsm, free K+ ~ 155mM). Whole-cell patch-clamp recordings were made using a Multiclamp 700A or 700B amplifier (Molecular Devices, Sunnyvale, CA). Signals were filtered at 3 kHz (Bessel filter; Frequency Devices, Haverhill, MA) and digitized at 20 kHz (Digidata 1322A or 1440A and pClamp 9.2 or 10.2 Software; Molecular Devices). Recordings were not corrected for a liquid junction potential. To accurately determine neuronal resting membrane potential without disrupting the cell’s intracellular environment, we monitored potassium-channel activation during depolarizing voltage ramps (from −100 to +200 mV) applied to cell-attached patches prior to breakthrough into the whole-cell configuration 12. After breaking into whole-cell configuration, membrane potential was biased to −60mV by constant current injection. Input resistance (Rm) was measured using a linear regression of voltage deflections (± 15 mV from resting potential, ~60 mV) in response to 2 s current steps of six to ten different amplitudes (increment 5 pA). Membrane time constant (τm) was calculated from the mean responses to 20 successive hyperpolarizing current pulses (−20pA; 400 ms) and was determined by fitting voltage responses with a single exponential function. Action potential threshold was defined as the voltage at which the slope trajectory reaches 10 mV/ms. Action potential (AP) amplitude was defined as the difference in membrane potential between threshold and the peak. Afterhyperpolarization (AHP) amplitude was defined as the difference between action potential threshold and the most negative membrane potential attained during the AHP. These properties were measured for the first action potential elicited by a depolarizing 800 ms-long current pulse of amplitude just sufficient to bring the cell to threshold for AP generation. The adaptation ratio was defined as the ratio of the average of the last 2–3 interspike intervals relative to the first interspike interval during a 800-ms-long spike train elicited using twice the current injection necessary to obtain a just suprathreshold response. Firing frequency was calculated from the number of spikes observed during the same spike train. In some interneurons injection of hyperpolarizing current pulses induces pronounced “sag” indicative of a hyperpolarization-activated cationic current (Ih) that activates following the initial peak hyperpolarization. To determine the sag index of each cell we used a series of 800ms negative current steps to create V-I plots of the peak negative voltage deflection (Vhyp) and the steady state voltage deflection (average voltage over the last 200 ms of the current step; Vsag) and used the ratio of Vrest−Vsag/Vrest−Vhyp for current injections corresponding to Vsag=−80mV determined from polynomial fits of the V-I plots12. All electrophysiological parameters were measured in pClamp or using procedures written in Igor 6 (Wavemetrics, Portland, OR). In a subset of recordings, local pressure application (Picospritzer III, Parker Instruments, Fair- field, NJ) of either the 5HT3AR agonist mCPBG (1μM) or nicotine (100μM) was performed via an electrode placed 5–20μm from the cell soma. Current responses to pressure application of agonists were monitored under voltage-clamp conditions in the absence or presence of bath applied 5HT3AR or nicotinic receptor antagonists odansetron (OND; 10nM) and methyllycaconitine (MLA; 10nM), respectively. The extracellular solution was routinely supplemented with DL-AP5 (100μM) DNQX (10μM) and SR95531 (gabazine; 5μM) for these experiments.
Following biocytin filling during whole-cell recordings slices were fixed in 4% paraformaldehyde and stored at 4°C. Sections were washed in PBS (3×20 mins) and then treated for two hours at RT with a blocking solution of the following composition; 0.5% Triton X-100 (Sigma), 11% goat serum (Life Technologies), 1% BSA (Sigma), and 0.05% NaN3 (Sigma) in PBS. The sections were then incubated at 4°C overnight in a carrier solution of 1% BSA and 1% goat serum, 0.5% Triton X-100, 0.05% NaN3 in PBS and rabbit polyclonal anti-somatostatin antibody (Dako) at a dilution of 1:1000. Sections were then washed at RT (3×20 mins), incubated in secondary antibody Alexa Fluor goat anti-rabbit 633 (Life Technologies) and Alexa Fluor 555 streptavidin (Life Technologies) both at a dilution of 1:500 for two hours at RT. The sections were finally washed (3×30mins) in PBS at RT. Following cryoprotection in 10% glycerol and 25% sucrose dissolved in PBS for 45 mins at RT or overnight at 4° C, the slices were re-sectioned (70 μm) on a freezing microtome (Microm), mounted on gelatin-coated slides, dried overnight, and cover-slipped with Mowiol (Calbiochem) mounting medium. Stacked z-section images of recorded cells revealed by biocytin conjugation and somatostatin immunostaining were obtained with a Leica TCS SP2 RS confocal microscope. Two-dimensional reconstructions were then traced from stacked z-section images obtained from the single section containing the soma using Neurolucida (MicroBrightField, Williston, VT).
Hippocampal Gamma Oscillations
Transverse hippocampal slices were obtained from P14-P21 Htr3a-GFP or Nkx2-1-cre:RCE mice as described above. For these experiments 400 μM sections were employed and following an incubation period in a holding chamber at 34°C for 45 mins, slices were cooled to room temperature where they rested for at least a further 15 mins before being transferred to the recording chamber. Incubation and recording were in aCSF containing (mM): 126 NaCl, 3 KCl, 26 NaHC03, 2 MgSO4, 2 CaCl2, 1.25 NaH2PO4 and 10 glucose saturated with 95% O2 and 5% CO2 (pH 7.4). Experiments were performed at 32 – 34°C in a submerged recording chamber, superfused with aCSF at a flow rate of 3 – 5 ml/min. For each experiment an extracellular field electrode pulled from borosilicate glass filled with aCSF (3 – 4 MΩ resistance) was placed in stratum radiatum (note: the oscillations recorded with this electrode placement will show opposite polarity relative to those recorded from stratum pyramidale35). Simultaneous whole-cell patch-clamp recordings from GFP positive interneurons in stratum oriens from either Htr3a-GFP or Nkx2-1-cre:RCE mice were made in current clamp mode with electrodes of resistance ranging between 6 – 8 MΩ when filled with an intracellular solution of the following composition (mM): 150 K-Gluconate, 3 MgCl2, 0.5 EGTA, 2 MgATP, 0.3 Na2GTP, 10 HEPES and 2mg/ml biocytin. Following attainment of the dual recording configuration, gamma oscillations were induced by pressure application (Picospritzer III, Parker Instruments, Fair- field, NJ) of 1mM kainate above stratum radiatum of CA1 (within 200μm of the field electrode) as previously described33, 34. Extracellular field potentials were low-pass filtered at 2 kHz, recorded using an Axon Multiclamp 700A (Molecular Devices, CA) and digitized using an Axon Digidata 1440A with a PC running PClamp 10 (Molecular Devices, CA). A Hum Bug (Quest Scientific, BC, Canada) was used to eliminate 60Hz line noise from the field recordings. Action potential firing of stratum oriens interneurons was monitored during kainate-induced gamma oscillations. During some trials, an additional pipette was used to pressure-apply the specific 5HT3AR agonist, mCPBG (1μM), directly above stratum oriens during the kainate-evoked gamma oscillations. Following each experiment the slices were processed as described above for morphological reconstruction of the stratum oriens interneuron from which recordings were performed. In the current study subsequent analyses was only carried out from Htr3a-GFP-expressing, Htr3a-GFP-negative or Nkx2-1-cre:RCE positive interneurons in which O-LM morphology was confirmed. To identify periods of gamma activity, extracellular field recordings were band-pass filtered between 30 and 120 Hz to reveal the local field potential. The RMS of the field potential before kainate application was measured, and epochs of gamma were defined as those where the field potential RMS was at least two absolute mean deviations above baseline. For analysis of the firing phase of O-LMs cells, individual gamma cycles were detected as follows. Firstly, x-axis crossings were identified in the filtered local field potential and our analysis algorithm then detected peaks and troughs on either side of these zero values. Troughs were designated as 0 and 360 degrees and peaks were designated as 180 degrees to identify the firing phase of individual spikes. Cycles with trough-to-peak amplitudes of less than baseline RMS plus 4 times the mean deviation, or those occurring at a frequency outside of the gamma band (30 – 120Hz), were rejected. Typically, data were collected for 100 to 500 cycles of gamma and these data were used to calculate the gamma firing probability. When neurons entered depolarizing block, after kainate application, analysis was carried out only on the portion of the recording where spikes were still clearly identifiable. To analyze the phase of firing, action potentials were grouped into bins of 20 degrees. For spike phase analysis, circular statistics were used as described previously51,52. All data were analyzed with Igor Pro (Wavemetrics, OR) using custom-written procedures.
Supplementary Material
Acknowledgments
This work was supported by an NICHD intramural award to C.J.M. We thank Daniel Abebe for expert technical assistance. We are grateful to Drs. Stuart Anderson (Uni. Pennsylvania) and Gord Fishell (NYU) for providing the Nkx2-1-cre and the RCE reporter mouse lines, respectively. The GENSAT BAC-Cre driver line (Htr3a-NO152) mice were obtained from Dr. Charles Gerfern (NIMH). We would also like to thank Dr. Ed Mann (Uni. Oxford, UK) for providing the code for the wavelet analyses.
Footnotes
Contributions
R.C., M.T.C., A.M., S.C.B. and K.A.P. conducted the electrophysiological recordings. M.T.C. generated the hippocampal oscillation data. X.Y, S.G, L.T, B.E, C.M.L, B.J.L. and B.W.J., performed the imuunocytochemical analyses. R.C., K.A.P and C.McB. designed the study and wrote the manuscript.
References
- 1.McBain CJ, Fisahn A. Interneurons unbound. Nat Rev Neurosci. 2001;2:11–23. doi: 10.1038/35049047. [DOI] [PubMed] [Google Scholar]
- 2.Freund TF, Buzsaki G. Interneurons of the hippocampus. Hippocampus. 1996;6:347–470. doi: 10.1002/(SICI)1098-1063(1996)6:4<347::AID-HIPO1>3.0.CO;2-I. [DOI] [PubMed] [Google Scholar]
- 3.Klausberger T, Somogyi P. Neuronal diversity and temporal dynamics: the unity of hippocampal circuit operations. Science. 2008;321:53–57. doi: 10.1126/science.1149381. [DOI] [PMC free article] [PubMed] [Google Scholar]
- 4.Freund TF. Interneuron Diversity series: Rhythm and mood in perisomatic inhibition. Trends Neurosci. 2003;26:489–495. doi: 10.1016/S0166-2236(03)00227-3. [DOI] [PubMed] [Google Scholar]
- 5.Freund TF, Gulyas AI, Acsady L, Gorcs T, Toth K. Serotonergic control of the hippocampus via local inhibitory interneurons. Proc Natl Acad Sci U S A. 1990;87:8501–8505. doi: 10.1073/pnas.87.21.8501. [DOI] [PMC free article] [PubMed] [Google Scholar]
- 6.Halasy K, Miettinen R, Szabat E, Freund TF. GABAergic Interneurons are the Major Postsynaptic Targets of Median Raphe Afferents in the Rat Dentate Gyrus. Eur J Neurosci. 1992;4:144–153. doi: 10.1111/j.1460-9568.1992.tb00861.x. [DOI] [PubMed] [Google Scholar]
- 7.Varga V, et al. Fast synaptic subcortical control of hippocampal circuits. Science. 2009;326:449–453. doi: 10.1126/science.1178307. [DOI] [PubMed] [Google Scholar]
- 8.Ropert N, Guy N. Serotonin facilitates GABAergic transmission in the CA1 region of rat hippocampus in vitro. J Physiol. 1991;441:121–136. doi: 10.1113/jphysiol.1991.sp018742. [DOI] [PMC free article] [PubMed] [Google Scholar]
- 9.Lee S, Hjerling-Leffler J, Zagha E, Fishell G, Rudy B. The largest group of superficial neocortical GABAergic interneurons expresses ionotropic serotonin receptors. J Neurosci. 2010;30:16796–16808. doi: 10.1523/JNEUROSCI.1869-10.2010. [DOI] [PMC free article] [PubMed] [Google Scholar]
- 10.Rudy B, Fishell G, Lee S, Hjerling-Leffler J. Three groups of interneurons account for nearly 100% of neocortical GABAergic neurons. Dev Neurobiol. 2011;71:45–61. doi: 10.1002/dneu.20853. [DOI] [PMC free article] [PubMed] [Google Scholar]
- 11.Vucurovic K, et al. Serotonin 3A receptor subtype as an early and protracted marker of cortical interneuron subpopulations. Cereb Cortex. 2010;20:2333–2347. doi: 10.1093/cercor/bhp310. [DOI] [PMC free article] [PubMed] [Google Scholar]
- 12.Tricoire L, et al. A blueprint for the spatiotemporal origins of mouse hippocampal interneuron diversity. J Neurosci. 2011;31:10948–10970. doi: 10.1523/JNEUROSCI.0323-11.2011. [DOI] [PMC free article] [PubMed] [Google Scholar]
- 13.Verney C, Takahashi T, Bhide PG, Nowakowski RS, Caviness VS., Jr Independent controls for neocortical neuron production and histogenetic cell death. Dev Neurosci. 2000;22:125–138. doi: 10.1159/000017434. [DOI] [PubMed] [Google Scholar]
- 14.Tricoire L, et al. Common origins of hippocampal Ivy and nitric oxide synthase expressing neurogliaform cells. J Neurosci. 2010;30:2165–2176. doi: 10.1523/JNEUROSCI.5123-09.2010. [DOI] [PMC free article] [PubMed] [Google Scholar]
- 15.Wierenga CJ, et al. Molecular and electrophysiological characterization of GFP-expressing CA1 interneurons in GAD65–GFP mice. PLoS One. 2010;5:e15915. doi: 10.1371/journal.pone.0015915. [DOI] [PMC free article] [PubMed] [Google Scholar]
- 16.Fuentealba P, et al. Expression of COUP-TFII nuclear receptor in restricted GABAergic neuronal populations in the adult rat hippocampus. J Neurosci. 2010;30:1595–1609. doi: 10.1523/JNEUROSCI.4199-09.2010. [DOI] [PMC free article] [PubMed] [Google Scholar]
- 17.Ferraguti F, et al. Immunolocalization of metabotropic glutamate receptor 1alpha (mGluR1alpha) in distinct classes of interneuron in the CA1 region of the rat hippocampus. Hippocampus. 2004;14:193–215. doi: 10.1002/hipo.10163. [DOI] [PubMed] [Google Scholar]
- 18.Miyoshi G, et al. Genetic fate mapping reveals that the caudal ganglionic eminence produces a large and diverse population of superficial cortical interneurons. J Neurosci. 2010;30:1582–1594. doi: 10.1523/JNEUROSCI.4515-09.2010. [DOI] [PMC free article] [PubMed] [Google Scholar]
- 19.Miyoshi G, Butt SJ, Takebayashi H, Fishell G. Physiologically distinct temporal cohorts of cortical interneurons arise from telencephalic Olig2-expressing precursors. J Neurosci. 2007;27:7786–7798. doi: 10.1523/JNEUROSCI.1807-07.2007. [DOI] [PMC free article] [PubMed] [Google Scholar]
- 20.Sousa VH, Miyoshi G, Hjerling-Leffler J, Karayannis T, Fishell G. Characterization of Nkx6-2-derived neocortical interneuron lineages. Cereb Cortex. 2009;19 (Suppl 1):i1–10. doi: 10.1093/cercor/bhp038. [DOI] [PMC free article] [PubMed] [Google Scholar]
- 21.Fogarty M, et al. Spatial genetic patterning of the embryonic neuroepithelium generates GABAergic interneuron diversity in the adult cortex. J Neurosci. 2007;27:10935–10946. doi: 10.1523/JNEUROSCI.1629-07.2007. [DOI] [PMC free article] [PubMed] [Google Scholar]
- 22.Ascoli GA, et al. Petilla terminology: nomenclature of features of GABAergic interneurons of the cerebral cortex. Nat Rev Neurosci. 2008;9:557–568. doi: 10.1038/nrn2402. [DOI] [PMC free article] [PubMed] [Google Scholar]
- 23.Ma Y, Hu H, Berrebi AS, Mathers PH, Agmon A. Distinct subtypes of somatostatin-containing neocortical interneurons revealed in transgenic mice. J Neurosci. 2006;26:5069–5082. doi: 10.1523/JNEUROSCI.0661-06.2006. [DOI] [PMC free article] [PubMed] [Google Scholar]
- 24.Oliva AA, Jr, Jiang M, Lam T, Smith KL, Swann JW. Novel hippocampal interneuronal subtypes identified using transgenic mice that express green fluorescent protein in GABAergic interneurons. J Neurosci. 2000;20:3354–3368. doi: 10.1523/JNEUROSCI.20-09-03354.2000. [DOI] [PMC free article] [PubMed] [Google Scholar]
- 25.Lawrence JJ, Statland JM, Grinspan ZM, McBain CJ. Cell type-specific dependence of muscarinic signalling in mouse hippocampal stratum oriens interneurones. J Physiol. 2006;570:595–610. doi: 10.1113/jphysiol.2005.100875. [DOI] [PMC free article] [PubMed] [Google Scholar]
- 26.Gong S, et al. Targeting Cre recombinase to specific neuron populations with bacterial artificial chromosome constructs. J Neurosci. 2007;27:9817–9823. doi: 10.1523/JNEUROSCI.2707-07.2007. [DOI] [PMC free article] [PubMed] [Google Scholar]
- 27.Madisen L, et al. A robust and high-throughput Cre reporting and characterization system for the whole mouse brain. Nat Neurosci. 2010;13:133–140. doi: 10.1038/nn.2467. [DOI] [PMC free article] [PubMed] [Google Scholar]
- 28.Maccaferri G. Stratum oriens horizontal interneurone diversity and hippocampal network dynamics. J Physiol. 2005;562:73–80. doi: 10.1113/jphysiol.2004.077081. [DOI] [PMC free article] [PubMed] [Google Scholar]
- 29.Xu Q, Tam M, Anderson SA. Fate mapping Nkx2.1-lineage cells in the mouse telencephalon. J Comp Neurol. 2008;506:16–29. doi: 10.1002/cne.21529. [DOI] [PubMed] [Google Scholar]
- 30.Lawrence JJ, Grinspan ZM, Statland JM, McBain CJ. Muscarinic receptor activation tunes mouse stratum oriens interneurones to amplify spike reliability. J Physiol. 2006;571:555–562. doi: 10.1113/jphysiol.2005.103218. [DOI] [PMC free article] [PubMed] [Google Scholar]
- 31.Mcbain CJ, Dichiara TJ, Kauer JA. Activation of Metabotropic Glutamate Receptors Differentially Affects 2 Classes of Hippocampal Interneurons and Potentiates Excitatory Synaptic Transmission. Journal of Neuroscience. 1994;14:4433–4445. doi: 10.1523/JNEUROSCI.14-07-04433.1994. [DOI] [PMC free article] [PubMed] [Google Scholar]
- 32.Somogyi P, Klausberger T. Defined types of cortical interneurone structure space and spike timing in the hippocampus. J Physiol. 2005;562:9–26. doi: 10.1113/jphysiol.2004.078915. [DOI] [PMC free article] [PubMed] [Google Scholar]
- 33.Dugladze T, Schmitz D, Whittington MA, Vida I, Gloveli T. Segregation of axonal and somatic activity during fast network oscillations. Science. 2012;336:1458–1461. doi: 10.1126/science.1222017. [DOI] [PubMed] [Google Scholar]
- 34.Gloveli T, et al. Differential involvement of oriens/pyramidale interneurones in hippocampal network oscillations in vitro. J Physiol. 2005;562:131–147. doi: 10.1113/jphysiol.2004.073007. [DOI] [PMC free article] [PubMed] [Google Scholar]
- 35.Hajos N, et al. Spike timing of distinct types of GABAergic interneuron during hippocampal gamma oscillations in vitro. J Neurosci. 2004;24:9127–9137. doi: 10.1523/JNEUROSCI.2113-04.2004. [DOI] [PMC free article] [PubMed] [Google Scholar]
- 36.Wonders CP, Anderson SA. The origin and specification of cortical interneurons. Nat Rev Neurosci. 2006;7:687–696. doi: 10.1038/nrn1954. [DOI] [PubMed] [Google Scholar]
- 37.Fishell G, Rudy B. Mechanisms of inhibition within the telencephalon: “where the wild things are”. Annu Rev Neurosci. 2011;34:535–567. doi: 10.1146/annurev-neuro-061010-113717. [DOI] [PMC free article] [PubMed] [Google Scholar]
- 38.Close J, et al. Satb1 is an activity-modulated transcription factor required for the terminal differentiation and connectivity of medial ganglionic eminence-derived cortical interneurons. J Neurosci. 2012;32:17690–17705. doi: 10.1523/JNEUROSCI.3583-12.2012. [DOI] [PMC free article] [PubMed] [Google Scholar]
- 39.Denaxa M, et al. Maturation-promoting activity of SATB1 in MGE-derived cortical interneurons. Cell Rep. 2012;2:1351–1362. doi: 10.1016/j.celrep.2012.10.003. [DOI] [PMC free article] [PubMed] [Google Scholar]
- 40.Lawrence JJ. Cholinergic control of GABA release: emerging parallels between neocortex and hippocampus. Trends Neurosci. 2008;31:317–327. doi: 10.1016/j.tins.2008.03.008. [DOI] [PubMed] [Google Scholar]
- 41.Cea-del Rio CA, McBain CJ, Pelkey KA. An update on cholinergic regulation of cholecystokinin-expressing basket cells. J Physiol. 2012;590:695–702. doi: 10.1113/jphysiol.2011.225342. [DOI] [PMC free article] [PubMed] [Google Scholar]
- 42.Freund TF, Katona I. Perisomatic inhibition. Neuron. 2007;56:33–42. doi: 10.1016/j.neuron.2007.09.012. [DOI] [PubMed] [Google Scholar]
- 43.Whittington MA, Cunningham MO, LeBeau FE, Racca C, Traub RD. Multiple origins of the cortical gamma rhythm. Dev Neurobiol. 2011;71:92–106. doi: 10.1002/dneu.20814. [DOI] [PubMed] [Google Scholar]
- 44.Bartos M, Elgueta C. Functional characteristics of parvalbumin- and cholecystokinin-expressing basket cells. J Physiol. 2012;590:669–681. doi: 10.1113/jphysiol.2011.226175. [DOI] [PMC free article] [PubMed] [Google Scholar]
- 45.Tukker JJ, Fuentealba P, Hartwich K, Somogyi P, Klausberger T. Cell type-specific tuning of hippocampal interneuron firing during gamma oscillations in vivo. J Neurosci. 2007;27:8184–8189. doi: 10.1523/JNEUROSCI.1685-07.2007. [DOI] [PMC free article] [PubMed] [Google Scholar]
- 46.Gulyas AI, et al. Parvalbumin-containing fast-spiking basket cells generate the field potential oscillations induced by cholinergic receptor activation in the hippocampus. J Neurosci. 2010;30:15134–15145. doi: 10.1523/JNEUROSCI.4104-10.2010. [DOI] [PMC free article] [PubMed] [Google Scholar]
- 47.Klausberger T, et al. Brain-state- and cell-type-specific firing of hippocampal interneurons in vivo. Nature. 2003;421:844–848. doi: 10.1038/nature01374. [DOI] [PubMed] [Google Scholar]
- 48.Varga C, Golshani P, Soltesz I. Frequency-invariant temporal ordering of interneuronal discharges during hippocampal oscillations in awake mice. Proc Natl Acad Sci U S A. 2012;109:E2726–2734. doi: 10.1073/pnas.1210929109. [DOI] [PMC free article] [PubMed] [Google Scholar]
- 49.Spampanato J, Mody I. Spike timing of lacunosom-moleculare targeting interneurons and CA3 pyramidal cells during high-frequency network oscillations in vitro. J Neurophysiol. 2007;98:96–104. doi: 10.1152/jn.00188.2007. [DOI] [PubMed] [Google Scholar]
- 50.Reznic J, Staubli U. Effects of 5-HT3 receptor antagonism on hippocampal cellular activity in the freely moving rat. J Neurophysiol. 1997;77:517–521. doi: 10.1152/jn.1997.77.1.517. [DOI] [PubMed] [Google Scholar]
- 51.Fisher NI. Statistical analysis of circular data. Cambridge University Press; 1993. [Google Scholar]
- 52.Zar JH. Biostatistical analysis. 5. Pearson; 2010. International ed. [Google Scholar]
Associated Data
This section collects any data citations, data availability statements, or supplementary materials included in this article.