

Abstract
Altered topological properties of brain connectivity networks have emerged as important features of schizophrenia. The aim of this study was to investigate how the state-related modulations to graph measures of functional integration and functional segregation brain networks are disrupted in schizophrenia. Firstly, resting state and auditory oddball discrimination (AOD) fMRI data of healthy controls (HCs) and schizophrenia patients (SZs) were decomposed into spatially independent components (ICs) by group independent component analysis (ICA). Then, weighted positive and negative functional integration (inter-component networks) and functional segregation (intra-component networks) brain networks were built in each subject. Subsequently, connectivity strength, clustering coefficient, and global efficiency of all brain networks were statistically compared between groups (HCs and SZs) in each state and between states (rest and AOD) within group. We found that graph measures of negative functional integration brain network and several positive functional segregation brain networks were altered in schizophrenia during AOD task. The metrics of positive functional integration brain network and one positive functional segregation brain network were higher during the resting state than during the AOD task only in HCs. These findings imply that state-related characteristics of both functional integration and functional segregation brain networks are impaired in schizophrenia which provides new insight into the altered brain performance in this brain disorder.
Keywords: brain graph, brain state, integration, segregation, schizophrenia, ICA
1. Introduction
Schizophrenia appears to be characterized by functional disruptions in cortical connectivity of various types (Friston and Frith, 1995; Pettersson-Yeo et al., 2011). Along with recent papers applying graph theory-based analysis to brain imaging studies in schizophrenia (Bassett and Gazzaniga, 2011; Bullmore and Sporns, 2009), altered topological properties of brain connectivity networks have emerged as important features of this mental illness (Fornito et al., 2012; Xia and He, 2011). However, most of these studies examined the graph metrics of whole brain network (nodes across the whole brain) which characterize functional brain integration (Bassett et al., 2012; Liu et al., 2008; Lynall et al., 2010). Little is known about the topological properties of connectivity within local brain regions that characterize functional brain segregation (specialization).
Functional segregation (the segregated or modular deployment of functional specialization within brain regions) and functional integration (of different brain areas in terms of functional and effective connectivity) are two fundamental, complementary rather than exclusive principles of brain organization (Fox and Friston, 2012; Friston, 2002; Friston, 2009). Spatial independent component analysis (ICA) (Calhoun and Adali, 2012; Calhoun et al., 2001b; McKeown et al., 1998; McKeown and Sejnowski, 1998) is a powerful tool to study the segregation and integration of brain function. Each spatial brain component represents a network that includes particular brain regions with specific functions, whereas functional network connectivity (FNC) (Calhoun et al., 2009a; Jafri et al., 2008; Lui et al., 2010; Meda et al., 2012; Yu et al., 2012) examines the integration among components using the temporal correlation of ICA time courses. Recently, graph theory-based analysis of brain connectivity has been widely implemented to reveal the characters of functional segregation and functional integration in human brain (de Pasquale et al., 2013). The clustered connectivity of brain network communities (Ferrarini et al., 2009; He et al., 2009; Meunier et al., 2010; Meunier et al., 2009; Salvador et al., 2005; Shen et al., 2010; Smith et al., 2009) represent functional segregation and specialization, whereas hubs underpin efficient communication and information integration (Bullmore and Sporns, 2012; Sporns, 2013). Our previous work (Yu et al., 2011a; Yu et al., 2013; Yu et al., 2011b) successfully combined graph theory-based analysis and ICA to characterize the topological properties of integrated whole brain network connectivity in both healthy controls (HCs) and schizophrenia patients (SZs) during the resting state. However, the topological properties of both functional integration and functional segregation brain networks underlying other brain states (such as during performance of a specific task) remain largely unknown.
The study of brain activity and connectivity underlying different states (such as during rest or a task) has recently become a topic of intense focus for the functional Magnetic Resonance Imaging (fMRI) community (Raichle, 2010). Maintaining a mental state and switching between states (cognitive flexibility) are crucial human brain abilities which are vital for both self-regulation and adaptation to varying environments (Leber et al., 2008; Tang et al., 2012). Previous studies have revealed different brain networks involved in different states (Fox et al., 2006; Sridharan et al., 2008), for example the rest-related default mode network (DMN) (Greicius et al., 2003; Raichle et al., 2001; Raichle and Snyder, 2007) and task-related executive-control network (Seeley et al., 2007). Further studies revealed dysconnectivity in brain networks underlying a specific state (e.g. resting state) in SZs (Karbasforoushan and Woodward, 2012; Wolf et al., 2011; Woodward et al., 2011; Yu et al., 2012). However, it is not known if the state-induced modulations of topological measures of brain networks are also disrupted in schizophrenia (Ma et al., 2012).
Considering the unanswered questions above, the aim of this study was to evaluate the graph metrics of both functional integration and functional segregation networks underlying different brain states in schizophrenia. Since both resting state and auditory oddball (AOD) tasks are popular approaches to study schizophrenia using fMRI (Calhoun et al., 2006a; Calhoun et al., 2009a; Ethridge et al., 2012; Greicius, 2008; Pearlson and Calhoun, 2009; Rosazza and Minati, 2011), topological measures of functional integration (here are weakly coupled inter-component networks) and functional segregation (here are tightly coupled intra-component networks) brain networks underlying these two states were evaluated by ICA and graph theory-based analysis in both HCs and SZs (see Materials and Methods). We predicted that the state-related difference of graph measures of functional segregation and functional integration brain networks would be altered in SZs which might underline the deficits in cognitive functions in this brain disease (Flaum and Schultz, 1996; Marin, 2012; van Os et al., 2010; Zemlan et al., 1984). We also wished to provide a new framework in which to investigate brain dysconnectivity at multiple levels, in order to demonstrate more comprehensively how brain networks are impacted by schizophrenia.
2. Materials and methods
2.1. Participants
Participants consisted of 23 (seven females) HCs (age: 32 ± 9, range 23–50) and 23 (four females) SZs (age: 36 ± 12, range 21–52). Subject ages showed no significant group difference (two-sample t-test, P = 0.16). All participants provided written, informed, IRB-approved consent from Hartford Hospital and Yale University and were compensated for their participation. Schizophrenia was diagnosed according to DSM-IV-TR criteria on the basis of a structured clinical interview (First et al., 1995) administered by a research nurse and by review of the medical records. All patients had chronic schizophrenia [Positive and Negative Syndrome Scale, PANSS (Kay et al., 1987), positive score: 16 ± 6, range 7–28; negative score: 15 ± 5, range 7–27] and all were taking stable medication doses (including the atypical antipsychotic medications aripiprazole, clozapine, risperidone, quetiapine and olanzapine, first-generation antipsychotics including fluphenazine, and miscellaneous mood-stabilizing, hypnotic and anti-cholinergic medications including zolpidem, zaleplon, lorazepam, benztropine, divalproex, trazodone, clonazepam). All participants except 1 HC and 2 SZs were right-handed. Healthy participants were free of any DSM-IV-TR Axis I disorder or psychotropic medication and had no family history of Axis I disorders.
2.2. Experimental Design
All participants were scanned during both an AOD task and while at rest. The two scans were randomly ordered. The AOD consists of detecting an infrequent sound within a series of regular and different sounds. The stimulus paradigm, data acquisition techniques, and previously found stimulus-related activation are described fully elsewhere (Kiehl et al., 2005). When performing resting state scan, participants were instructed to rest quietly without falling asleep with their eyes open without fixation.
2.3. Image Acquisition
FMRI data were acquired on a Siemens Allegra 3T dedicated head scanner. Resting state and AOD functional scans were acquired using gradient-echo echo-planar-imaging with the following parameters: repeat time (TR) 1.5 s, echo time (TE) 27 ms, field of view 24 cm, acquisition matrix 64 × 64, flip angle 70°, voxel size 3.75 × 3.75 × 4 mm3, gap 1 mm, 29 slices, ascending acquisition. Six “dummy” scans were acquired at the beginning to allow for longitudinal equilibrium. The AOD consisted of two 8-min runs (249 × 2 volumes) and the resting state scan consisted of one 5-min run (204 volumes).
2.4. Preprocessing
FMRI data were preprocessed using the SPM software package (http://www.fil.ion.ucl.ac.uk/spm/software/spm5/). Data were motion corrected and then spatially normalized into the standard Montreal Neurological Institute (MNI) space (voxels size: 3 × 3 × 3 mm3, resulting in 53 × 63 × 46 voxels). To reduce spurious correlations between voxels (van den Heuvel et al., 2008; Zalesky et al., 2012) in functional segregation networks in this study, the normalized data were spatially smoothed with a small (5 × 5 × 5 mm3) full width at half maximum Gaussian kernel.
2.5. Group ICA
Group spatial ICA (Calhoun and Adali, 2012; Calhoun et al., 2001a; Calhoun et al., 2009b) was performed once on the fMRI data (three sessions, one session for resting state data, two sessions for AOD data) using the GIFT software (http://mialab.mrn.org/software/gift). Subject-specific data reduction by principle component analysis (PCA) retained 100 principal components (PCs) using a standard economy-size decomposition. Reduced data for all 46 participants were then decomposed into 75 aggregate components (Abou-Elseoud et al., 2010; Allen et al., 2011; Kiviniemi et al., 2009; Smith et al., 2009). Single subject time courses and spatial maps were back-reconstructed (Calhoun et al., 2001a; Erhardt et al., 2011). The Infomax ICA algorithm (Bell and Sejnowski, 1995) was repeated 10 times in ICASSO (http://research.ics.aalto.fi/ica/icasso) and resulting components were clustered to estimate the reliability of the decomposition. 42 independent components (ICs) which did not contain large edge effects or ventricles and located on the cerebral cortex by visual inspection were selected to do further analysis.
2.6. Functional integration and functional segregation brain networks
Weighted brain networks were built in this study. For functional integration brain network, 42 × 42 weighted positive (W+) and negative (W-) connection networks were built based on the correlations (rij) (see Equation 1, 2) among ICA time courses of the 42 ICs in each subject underlying both states (rest and AOD).
| (1) |
| (2) |
The present study involved two brain states (rest and AOD task). Also, previous studies showed that temporal lobe and default mode components provide reliable schizophrenia-related measures (Calhoun et al., 2008a; Calhoun et al., 2008b). Thus we chose to focus on the temporal lobe components as well as the default mode components in this study which resulted in 14 components including 3 AOD-related auditory ICs (IC23, IC36, IC37) and 11 default mode ICs (IC1, IC9, IC10, IC15, IC17, IC18, IC19, IC28, IC29, IC34, IC41; see the Results section below) to build functional segregation brain networks. In each of the 14 ICs, gray matter (detected by a mask created using TD database http://www.talairach.org/daemon.html) voxels with Z > 2 in the ICA spatial map were selected as network nodes. See Table 1 for the number of voxels (nodes) selected in each IC (functional segregation network). Weighted positive and negative connection networks were built based on the correlation of BOLD time series among the selected voxels in each subject during both rest and AOD.
Table 1.
Number of nodes in each functional segregation brain network (ICs of interest).
| IC’s ID | Num of nodes |
|---|---|
| IC1 | 736 |
| IC9 | 693 |
| IC10 | 662 |
| IC15 | 552 |
| IC17 | 631 |
| IC18 | 892 |
| IC19 | 528 |
| IC23 | 846 |
| IC28 | 854 |
| IC29 | 420 |
| IC34 | 843 |
| IC36 | 668 |
| IC37 | 332 |
| IC41 | 785 |
Before computing the correlations, each time course (both ICA time courses for functional integration networks and BOLD time series for functional segregation networks) was corrected for the effect of head movement by regression on the translations and rotations of the head estimated in the procedure of image realignment. The graph measures: connectivity strength, clustering coefficient, and global efficiency, were estimated for both functional integration and functional segregation brain networks using the brain connectivity toolbox [https://sites.google.com/site/bctnet/; for the related equations see (Rubinov and Sporns, 2010)].
2.7. Statistical analysis
The time series length is different between rest (204) and AOD (249 × 2). So firstly, two sample t-tests and paired t-tests were performed to do statistical comparisons on connectivity strength, clustering coefficient, and global efficiency of functional integration and functional segregation brain networks. To optimize the use of data, when comparing the graph measures between HCs and SZs underlying each state using two sample t-tests, the correlations which were used to build brain networks during AOD were computed by the concatenated time courses (498 time points length). However, when quantifying the state-related (rest VS AOD) alteration of network metrics within each group using paired t-test, in order to make sure the correlations were computed by the same length of time courses in rest and AOD, the first 204 time points in each session of AOD data were used to compute the correlations for building brain networks, then network metrics were averaged for the two networks (two sessions). Secondly, we noted that 2 × 2 analysis of variance (ANOVA) could be performed using the results based on the 204 length time courses during AOD and rest. Thus connectivity strength, clustering coefficient, and global efficiency of functional integration and functional segregation brain networks were analyzed separately using 2 × 2 repeated measures ANOVA with state (rest and AOD) as within-subjects variable and group (HC and SZ) as between-subjects variable. Group difference during each state and state difference within each group were examined by post-hoc analysis. The findings which showed significant (P < 0.05) in both t-tests and ANOVA were considered as reliable and hence were reported and discussed below. For a pipeline of the data analysis in this study, see Figure 1.
Figure 1.
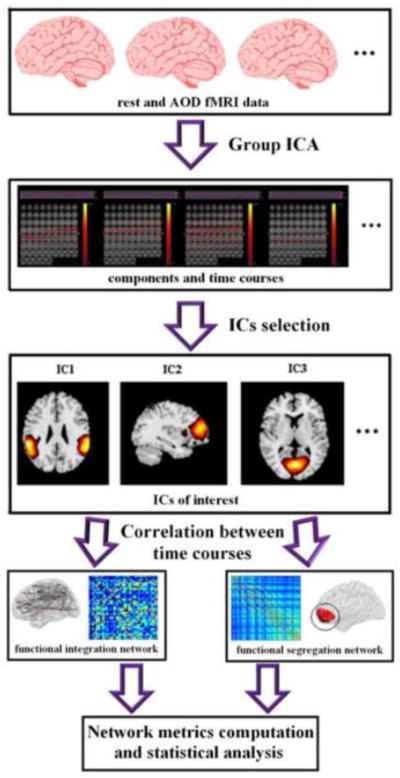
The data analysis pipeline of this study.
3. Results
During AOD task, the HCs had a higher success rate (m = 99.9%) than SZs (m = 98.3%; nonparametric Mann-Whitney U test, P = 0.005). HCs also had a shorter reaction time (m = 390.9 ms) than SZs (m = 464.1 ms; two sample t-test, P = 0.010). For the spatial maps of the 42 ICs, see supplemental Figure S1.
For functional integration brain networks, SZs showed higher connectivity strength and higher global efficiency (P < 0.05 in both t-tests and ANOVA) in the negative connection network during AOD task (see Figure 2). When comparing the network measures between states within group, connectivity strength, clustering coefficient, and global efficiency of positive connection network were higher (P < 0.001 in both t-tests and ANOVA) during resting state than during AOD task only in HC group (see Figure 3).
Figure 2.

(A) schematic connectivity pattern (visualized with the BrainNet Viewer [http://www.nitrc.org/projects/bnv/]) in HCs, SZs and the difference between the two groups (SZ-HC) for the negative functional integration brain network during AOD task. Red dots are network nodes. The thicker an edge, the higher its group mean weight. (B) SZ group showing higher connectivity strength, and higher global efficiency in the negative functional integration brain network (P < 0.05 in both t-tests and ANOVA, indicated by ‘*’). The figures were plotted based on the results computed by the concatenated time courses (498 time points length). Error bars indicate standard deviations.
Figure 3.

(A) schematic connectivity pattern in HC group for the positive functional integration brain network during resting state, AOD task, and the difference between the two states (AOD - rest). Red dots are network nodes. The thicker an edge, the higher its group mean weight. (B) the network showing lower connectivity strength, lower clustering coefficient, and lower global efficiency during AOD than during resting state (P < 0.001 in both t-tests and ANOVA, indicated by ‘**’). The figures of AOD task were plotted based on the results computed by the time courses of 204 time points length. Error bars indicate standard deviations.
For functional segregation brain networks, SZs showed higher connectivity strength, higher clustering coefficient, and higher global efficiency (P < 0.05 in both t-tests and ANOVA, uncorrected) in five ICs (4 default mode ICs and 1 auditory IC) during AOD task (see Figure 4). When comparing the network metrics between states within group, connectivity strength of one default mode IC involving precuneus and frontal areas (IC34) was higher (P < 0.05 in both t-test and ANOVA, uncorrected) during rest than during AOD task only in HC group (see Figure 5).
Figure 4.

(A) Schematic location (the red color area) and schematic connectivity pattern (all nodes of a given functional segregation network are placed in a small circle, if the nodes close to each other in the brain, they are also close to each other in the circle; color indicates the weight of an edge) of the 5 positive functional segregation brain networks which are showing group difference during AOD task. (B) SZs are showing higher connectivity strength (CS), higher clustering coefficient (CC) in all of the five positive functional segregation networks, and higher global efficiency (GE) in four of the five networks (P < 0.05 in both t-tests and ANOVA, uncorrected, indicated by ‘*’). The figures were plotted based on the results computed by the concatenated time courses (498 time points length). Error bars indicate standard deviations.
Figure 5.
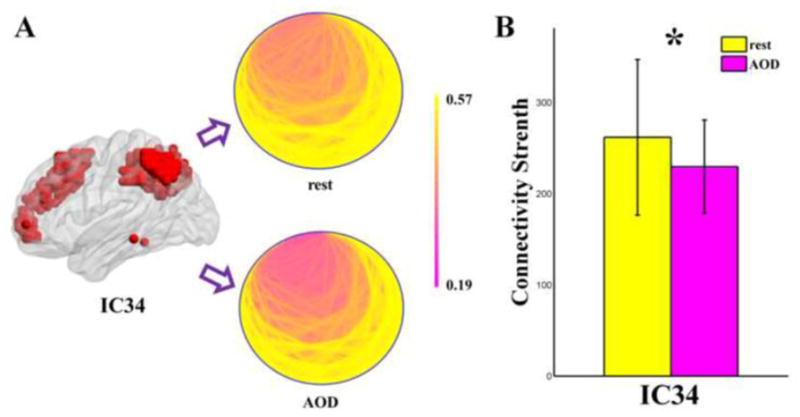
(A) Schematic location (the red color area) and schematic connectivity pattern (all nodes are placed in a small circle, if the nodes close to each other in the brain, they are also close to each other in the circle; color indicates the weight of an edge) of the positive functional segregation brain network (IC34) which are showing state related difference in HC group. (B) this positive functional segregation network is showing higher (P < 0.05 in both t-test and ANOVA, uncorrected, indicated by ‘*’) connectivity strength during resting state than during AOD task only in HC group. The figures of AOD task were plotted based on the results computed by the time courses of 204 time points length. Error bars indicate standard deviations.
4. Discussion
In this fMRI study, topological properties including connectivity strength, clustering coefficient, and global efficiency of functional segregation and functional integration of brain networks underlying different states (rest and an AOD task) in both HCs and SZs were evaluated by ICA and graph theory-based analysis. Weighted functional integration networks (in which nodes were brain ICs) were built by the correlation among ICA time courses of ICs. Weighted functional segregation networks (in which nodes were gray matter voxels with high z value in the spatial maps of auditory and default mode brain ICs) were built by the correlation among BOLD time series of voxels. All network nodes were located on the cerebral cortex. The results demonstrated that graph measures of the negative functional integration network and a few positive functional integration networks were altered in SZs only during AOD task. The metrics of positive functional integration network and one positive functional segregation network (one default mode component) were higher during resting state than during AOD task only in HC group. The findings provide new insights into the deficits of brain performance during AOD task in SZs.
One leading hypothesis regarding brain abnormalities in schizophrenia is that brain dysconnectivity underlies the primary pathogenesis of this psychotic disorder (Buckholtz and Meyer-Lindenberg, 2012; Friston, 2005; Friston and Frith, 1995; Stephan et al., 2006; White and Gottesman, 2012; Zhang and Raichle, 2010). Previous whole brain network studies reporting aberrant connectivity support this hypothesis (Calhoun et al., 2011; Jafri et al., 2008; Liang et al., 2006; Liu et al., 2008; Lynall et al., 2010; Meda et al., 2012). Consistent with these studies, we discovered dysconnectivity in the functional integration networks in schizophrenia during AOD performance. SZs showed higher connectivity strength and higher global efficiency in the negative functional integration network, suggesting that there were more and stronger anti-correlations and the overall capacity for parallel information transfer and processing of this network was altered (Bullmore and Sporns, 2012; Watts and Strogatz, 1998). The negative functional integration brain network may characterize the anti-correlations between task-related components and default mode components (Fox et al., 2005). The aberrant graph metrics of this network may imply altered relationship between task-related components and default mode components during the AOD task. However, the biological basis for this finding is not clear. Future studies may provide physiological explanation by doing multimodal fusion analysis of brain imaging data (Liang et al., 2013). We noted that prior studies reported disrupted connectivity of whole brain network in resting state fMRI in schizophrenia (Karbasforoushan and Woodward, 2012; Yu et al., 2012). Here we failed to reveal group difference of graph measures in the functional integration networks during rest. However, the different methods such as definition (selection) of nodes and definition of edges (correlation computation) may play a role.
When comparing the graph measures of the functional integration networks between the two brain states within group, in line with a previous study which found state difference (AOD task VS Sternberg working memory task) in HCs rather than in SZs (Calhoun et al., 2006b), state-related differences were revealed in HCs in this study. All three metrics of the positive functional integration network were decreased during AOD than during rest implied the healthy functional integration network organization was sensitive to brain state. The absence of state-induced difference in SZs suggested the state-induced modulations to topological properties of the functional integration network were impaired.
While numerous studies have examined the graph metrics of whole brain networks, only a few studies investigated the topological organization of networks within specific brain regions (Yu et al., 2011c). Consistent with (Yu et al., 2011c), this study revealed altered graph metrics in networks within brain components during AOD task in SZs. SZs showed higher connectivity strength, higher clustering coefficient, and higher global efficiency in five positive functional segregation networks involving not only one auditory (temporal area) component (IC37), but also four default mode (frontal and cingulate areas) components (IC17, IC18, IC29, and IC41; see Figure 4) underlining the AOD task. The results imply that the functional organization of default mode brain regions may also contribute to the aberrant performance of a specific task in schizophrenia. These data provide new insight that the topological organization of functional segregation networks underlining AOD task was altered in schizophrenia and bolster the evidence for dysconnectivity in the disorder.
In line with functional integration networks, state-related difference of the topological metrics in functional segregation networks was found only in HCs. Connectivity strength of one positive functional segregation network (default mode component IC34, frontal and posterior cingulate cortex, see Figure 5) was lower during AOD than during rest. This finding suggests the state-induced modulations of graph measures of that default mode component were impaired in schizophrenia.
Finally, a few methodological issues should be considered. One is about medication. Effects of antipsychotics were revealed on brain structure and function (Fusar-Poli et al., 2013). The effect of antipsychotics on brain resting cerebral blood flow (rCBF) starts immediately and can be detected after a single dose (Handley et al., 2013). However, drug-induced changes in functional brain connectivity have so far only been rudimentarily explored (Nejad et al., 2012). All patients in this study were taking psychotropic medications, so drug effects cannot be separated. Future studies can control it by examining unaffected first-degree relatives of schizophrenia patients (Meda et al., 2012). Another one is about multiple comparisons. Though there were no multiple comparisons in the statistical analysis for functional integration brain networks, for the functional segregation networks there was a 14-fold multiple comparison issue. However, 0.05 × 14 = 0.70 < 1, which means there was less than one false-positive result when using the statistical significance level of P < 0.05. Moreover, in this initial study, we focused on the cerebral cortex for the analysis. Ongoing studies are being performed which include subcortical regions.
5. Conclusions
To our knowledge, this is the first study to investigate topological properties of functional integration and functional segregation brain networks in HCs and SZs underlining different states using ICA and graph theory-based analysis. For the functional integration networks, graph measures were altered in schizophrenia only during AOD task in the negative network; state-induced differences of graph metrics of the positive network were only detected in controls. For the functional segregation networks, graph measures of five positive networks were altered in schizophrenia during the AOD task; state-induced difference of one positive network was found only in HC group. The findings provide the insight that state-induced modulations to topological measures of both functional integration and functional segregation brain networks are impaired in schizophrenia which may underline the deficits of cognition functions of this brain disorder. This study provides a new framework in which to investigate the state-related performance of brain networks and to examine the circuit pathology in schizophrenia at multi-levels of human brain functional organization.
Supplementary Material
Spatial Z-score maps of the selected 42 ICs. Each IC is shown in sagittal, coronal and axial views. The ICs are divided into groups and arranged based on their anatomical and functional properties.
Acknowledgments
This work was supported by the National Institutes of Health (NIH) grants (R01 EB000840 and 5P20RR021938 PI: Calhoun; R37 MH43775 PI: Pearlson; and R01 MH072681-01 PI: Kiehl).
Role of the funding source
Funding for this study is provided by the National Institutes of Health (NIH) grants (R01 EB000840 and 5P20RR021938 PI: Calhoun; R37 MH43775 PI: Pearlson; and R01 MH072681-01 PI: Kiehl). The NIH has no further role in the study design, subject recruitment, data acquisition or analysis. The NIH is also not involved in writing of the report or the decision to submit this article for publication.
Footnotes
Contributors
Qingbao Yu and Vince Calhoun design the study; Kent Kiehl, Godfrey Pearlson and Vince Calhoun contribute to data acquisition; Qingbao Yu and Jing Sui contribute to data analysis; all authors write the manuscript.
Conflict of interest
All authors declare that they have no conflicts of interest.
Publisher's Disclaimer: This is a PDF file of an unedited manuscript that has been accepted for publication. As a service to our customers we are providing this early version of the manuscript. The manuscript will undergo copyediting, typesetting, and review of the resulting proof before it is published in its final citable form. Please note that during the production process errors may be discovered which could affect the content, and all legal disclaimers that apply to the journal pertain.
References
- Abou-Elseoud A, Starck T, Remes J, Nikkinen J, Tervonen O, Kiviniemi V. The effect of model order selection in group PICA. Hum Brain Mapp. 2010;31(8):1207–1216. doi: 10.1002/hbm.20929. [DOI] [PMC free article] [PubMed] [Google Scholar]
- Allen EA, Erhardt EB, Damaraju E, Gruner W, Segall JM, Silva RF, Havlicek M, Rachakonda S, Fries J, Kalyanam R, Michael AM, Caprihan A, Turner JA, Eichele T, Adelsheim S, Bryan AD, Bustillo J, Clark VP, Feldstein Ewing SW, Filbey F, Ford CC, Hutchison K, Jung RE, Kiehl KA, Kodituwakku P, Komesu YM, Mayer AR, Pearlson GD, Phillips JP, Sadek JR, Stevens M, Teuscher U, Thoma RJ, Calhoun VD. A baseline for the multivariate comparison of resting-state networks. Front Syst Neurosci. 2011;5:2. doi: 10.3389/fnsys.2011.00002. [DOI] [PMC free article] [PubMed] [Google Scholar]
- Bassett DS, Gazzaniga MS. Understanding complexity in the human brain. Trends in cognitive sciences. 2011;15(5):200–209. doi: 10.1016/j.tics.2011.03.006. [DOI] [PMC free article] [PubMed] [Google Scholar]
- Bassett DS, Nelson BG, Mueller BA, Camchong J, Lim KO. Altered resting state complexity in schizophrenia. Neuroimage. 2012;59(3):2196–2207. doi: 10.1016/j.neuroimage.2011.10.002. [DOI] [PMC free article] [PubMed] [Google Scholar]
- Bell AJ, Sejnowski TJ. An information-maximization approach to blind separation and blind deconvolution. Neural Comput. 1995;7(6):1129–1159. doi: 10.1162/neco.1995.7.6.1129. [DOI] [PubMed] [Google Scholar]
- Buckholtz JW, Meyer-Lindenberg A. Psychopathology and the human connectome: toward a transdiagnostic model of risk for mental illness. Neuron. 2012;74(6):990–1004. doi: 10.1016/j.neuron.2012.06.002. [DOI] [PubMed] [Google Scholar]
- Bullmore E, Sporns O. Complex brain networks: graph theoretical analysis of structural and functional systems. Nat Rev Neurosci. 2009;10(3):186–198. doi: 10.1038/nrn2575. [DOI] [PubMed] [Google Scholar]
- Bullmore E, Sporns O. The economy of brain network organization. Nature reviews. Neuroscience. 2012;13(5):336–349. doi: 10.1038/nrn3214. [DOI] [PubMed] [Google Scholar]
- Calhoun VD, Adali T. Multisubject independent component analysis of fMRI: a decade of intrinsic networks, default mode, and neurodiagnostic discovery. IEEE reviews in biomedical engineering. 2012;5:60–73. doi: 10.1109/RBME.2012.2211076. [DOI] [PMC free article] [PubMed] [Google Scholar]
- Calhoun VD, Adali T, Giuliani NR, Pekar JJ, Kiehl KA, Pearlson GD. Method for multimodal analysis of independent source differences in schizophrenia: combining gray matter structural and auditory oddball functional data. Hum Brain Mapp. 2006a;27(1):47–62. doi: 10.1002/hbm.20166. [DOI] [PMC free article] [PubMed] [Google Scholar]
- Calhoun VD, Adali T, Kiehl KA, Astur R, Pekar JJ, Pearlson GD. A method for multitask fMRI data fusion applied to schizophrenia. Hum Brain Mapp. 2006b;27(7):598–610. doi: 10.1002/hbm.20204. [DOI] [PMC free article] [PubMed] [Google Scholar]
- Calhoun VD, Adali T, Pearlson GD, Pekar JJ. A method for making group inferences from functional MRI data using independent component analysis. Hum Brain Mapp. 2001a;14(3):140–151. doi: 10.1002/hbm.1048. [DOI] [PMC free article] [PubMed] [Google Scholar]
- Calhoun VD, Adali T, Pearlson GD, Pekar JJ. Spatial and temporal independent component analysis of functional MRI data containing a pair of task-related waveforms. Hum Brain Mapp. 2001b;13(1):43–53. doi: 10.1002/hbm.1024. [DOI] [PMC free article] [PubMed] [Google Scholar]
- Calhoun VD, Eichele T, Pearlson G. Functional brain networks in schizophrenia: a review. Front Hum Neurosci. 2009a;3:17. doi: 10.3389/neuro.09.017.2009. [DOI] [PMC free article] [PubMed] [Google Scholar]
- Calhoun VD, Kiehl KA, Pearlson GD. Modulation of temporally coherent brain networks estimated using ICA at rest and during cognitive tasks. Hum Brain Mapp. 2008a;29(7):828–838. doi: 10.1002/hbm.20581. [DOI] [PMC free article] [PubMed] [Google Scholar]
- Calhoun VD, Liu J, Adali T. A review of group ICA for fMRI data and ICA for joint inference of imaging, genetic, and ERP data. Neuroimage. 2009b;45(1 Suppl):S163–172. doi: 10.1016/j.neuroimage.2008.10.057. [DOI] [PMC free article] [PubMed] [Google Scholar]
- Calhoun VD, Maciejewski PK, Pearlson GD, Kiehl KA. Temporal lobe and “default” hemodynamic brain modes discriminate between schizophrenia and bipolar disorder. Hum Brain Mapp. 2008b;29(11):1265–1275. doi: 10.1002/hbm.20463. [DOI] [PMC free article] [PubMed] [Google Scholar]
- Calhoun VD, Sui J, Kiehl K, Turner J, Allen E, Pearlson G. Exploring the psychosis functional connectome: aberrant intrinsic networks in schizophrenia and bipolar disorder. Front Psychiatry. 2011;2:75. doi: 10.3389/fpsyt.2011.00075. [DOI] [PMC free article] [PubMed] [Google Scholar]
- de Pasquale F, Sabatini U, Della Penna S, Sestieri C, Caravasso CF, Formisano R, Peran P. The connectivity of functional cores reveals different degrees of segregation and integration in the brain at rest. Neuroimage. 2013;69:51–61. doi: 10.1016/j.neuroimage.2012.11.051. [DOI] [PubMed] [Google Scholar]
- Erhardt EB, Rachakonda S, Bedrick EJ, Allen EA, Adali T, Calhoun VD. Comparison of multi-subject ICA methods for analysis of fMRI data. Hum Brain Mapp. 2011;32(12):2075–2095. doi: 10.1002/hbm.21170. [DOI] [PMC free article] [PubMed] [Google Scholar]
- Ethridge LE, Hamm JP, Shapiro JR, Summerfelt AT, Keedy SK, Stevens MC, Pearlson G, Tamminga CA, Boutros NN, Sweeney JA, Keshavan MS, Thaker G, Clementz BA. Neural activations during auditory oddball processing discriminating schizophrenia and psychotic bipolar disorder. Biol Psychiatry. 2012;72(9):766–774. doi: 10.1016/j.biopsych.2012.03.034. [DOI] [PMC free article] [PubMed] [Google Scholar]
- Ferrarini L, Veer IM, Baerends E, van Tol MJ, Renken RJ, van der Wee NJ, Veltman DJ, Aleman A, Zitman FG, Penninx BW, van Buchem MA, Reiber JH, Rombouts SA, Milles J. Hierarchical functional modularity in the resting-state human brain. Hum Brain Mapp. 2009;30(7):2220–2231. doi: 10.1002/hbm.20663. [DOI] [PMC free article] [PubMed] [Google Scholar]
- First MB, Spitzer RL, Gibbon M, Williams JBW. Structured Clinical Interview for DSM-IV Axis I Disorders-Patient Edition (SCID-I/P, Version 2.0) New York: New York State Psychiatry Institute; 1995. [Google Scholar]
- Flaum M, Schultz SK. The core symptoms of schizophrenia. Ann Med. 1996;28(6):525–531. doi: 10.3109/07853899608999116. [DOI] [PubMed] [Google Scholar]
- Fornito A, Zalesky A, Pantelis C, Bullmore ET. Schizophrenia, neuroimaging and connectomics. Neuroimage. 2012;62(4):2296–2314. doi: 10.1016/j.neuroimage.2011.12.090. [DOI] [PubMed] [Google Scholar]
- Fox MD, Corbetta M, Snyder AZ, Vincent JL, Raichle ME. Spontaneous neuronal activity distinguishes human dorsal and ventral attention systems. Proc Natl Acad Sci U S A. 2006;103(26):10046–10051. doi: 10.1073/pnas.0604187103. [DOI] [PMC free article] [PubMed] [Google Scholar]
- Fox MD, Snyder AZ, Vincent JL, Corbetta M, Van Essen DC, Raichle ME. The human brain is intrinsically organized into dynamic, anticorrelated functional networks. P Natl Acad Sci USA. 2005;102(27):9673–9678. doi: 10.1073/pnas.0504136102. [DOI] [PMC free article] [PubMed] [Google Scholar]
- Fox PT, Friston KJ. Distributed processing; distributed functions? Neuroimage. 2012;61(2):407–426. doi: 10.1016/j.neuroimage.2011.12.051. [DOI] [PMC free article] [PubMed] [Google Scholar]
- Friston K. Beyond phrenology: what can neuroimaging tell us about distributed circuitry? Annual review of neuroscience. 2002;25:221–250. doi: 10.1146/annurev.neuro.25.112701.142846. [DOI] [PubMed] [Google Scholar]
- Friston K. Disconnection and cognitive dysmetria in schizophrenia. Am J Psychiatry. 2005;162(3):429–432. doi: 10.1176/appi.ajp.162.3.429. [DOI] [PubMed] [Google Scholar]
- Friston KJ. Modalities, modes, and models in functional neuroimaging. Science. 2009;326(5951):399–403. doi: 10.1126/science.1174521. [DOI] [PubMed] [Google Scholar]
- Friston KJ, Frith CD. Schizophrenia: a disconnection syndrome? Clin Neurosci. 1995;3(2):89–97. [PubMed] [Google Scholar]
- Fusar-Poli P, Smieskova R, Kempton MJ, Ho BC, Andreasen NC, Borgwardt S. Progressive brain changes in schizophrenia related to antipsychotic treatment? A meta-analysis of longitudinal MRI studies. Neurosci Biobehav Rev. 2013;37(8):1680–1691. doi: 10.1016/j.neubiorev.2013.06.001. [DOI] [PMC free article] [PubMed] [Google Scholar]
- Greicius M. Resting-state functional connectivity in neuropsychiatric disorders. Current opinion in neurology. 2008;21(4):424–430. doi: 10.1097/WCO.0b013e328306f2c5. [DOI] [PubMed] [Google Scholar]
- Greicius MD, Krasnow B, Reiss AL, Menon V. Functional connectivity in the resting brain: a network analysis of the default mode hypothesis. Proc Natl Acad Sci U S A. 2003;100(1):253–258. doi: 10.1073/pnas.0135058100. [DOI] [PMC free article] [PubMed] [Google Scholar]
- Handley R, Zelaya FO, Reinders AA, Marques TR, Mehta MA, O’Gorman R, Alsop DC, Taylor H, Johnston A, Williams S, McGuire P, Pariante CM, Kapur S, Dazzan P. Acute effects of single-dose aripiprazole and haloperidol on resting cerebral blood flow (rCBF) in the human brain. Hum Brain Mapp. 2013;34(2):272–282. doi: 10.1002/hbm.21436. [DOI] [PMC free article] [PubMed] [Google Scholar]
- He Y, Wang J, Wang L, Chen ZJ, Yan C, Yang H, Tang H, Zhu C, Gong Q, Zang Y, Evans AC. Uncovering intrinsic modular organization of spontaneous brain activity in humans. PLoS One. 2009;4(4):e5226. doi: 10.1371/journal.pone.0005226. [DOI] [PMC free article] [PubMed] [Google Scholar]
- Jafri MJ, Pearlson GD, Stevens M, Calhoun VD. A method for functional network connectivity among spatially independent resting-state components in schizophrenia. Neuroimage. 2008;39(4):1666–1681. doi: 10.1016/j.neuroimage.2007.11.001. [DOI] [PMC free article] [PubMed] [Google Scholar]
- Karbasforoushan H, Woodward ND. Resting-State Networks In Schizophrenia. Curr Top Med Chem. 2012;12(21):2404–2414. doi: 10.2174/156802612805289863. [DOI] [PubMed] [Google Scholar]
- Kay SR, Fiszbein A, Opler LA. The positive and negative syndrome scale (PANSS) for schizophrenia. Schizophr Bull. 1987;13(2):261–276. doi: 10.1093/schbul/13.2.261. [DOI] [PubMed] [Google Scholar]
- Kiehl KA, Stevens MC, Laurens KR, Pearlson G, Calhoun VD, Liddle PF. An adaptive reflexive processing model of neurocognitive function: supporting evidence from a large scale (n = 100) fMRI study of an auditory oddball task. Neuroimage. 2005;25(3):899–915. doi: 10.1016/j.neuroimage.2004.12.035. [DOI] [PubMed] [Google Scholar]
- Kiviniemi V, Starck T, Remes J, Long X, Nikkinen J, Haapea M, Veijola J, Moilanen I, Isohanni M, Zang YF, Tervonen O. Functional segmentation of the brain cortex using high model order group PICA. Hum Brain Mapp. 2009;30(12):3865–3886. doi: 10.1002/hbm.20813. [DOI] [PMC free article] [PubMed] [Google Scholar]
- Leber AB, Turk-Browne NB, Chun MM. Neural predictors of moment-to-moment fluctuations in cognitive flexibility. Proc Natl Acad Sci U S A. 2008;105(36):13592–13597. doi: 10.1073/pnas.0805423105. [DOI] [PMC free article] [PubMed] [Google Scholar]
- Liang M, Zhou Y, Jiang T, Liu Z, Tian L, Liu H, Hao Y. Widespread functional disconnectivity in schizophrenia with resting-state functional magnetic resonance imaging. Neuroreport. 2006;17(2):209–213. doi: 10.1097/01.wnr.0000198434.06518.b8. [DOI] [PubMed] [Google Scholar]
- Liang X, Zou Q, He Y, Yang Y. Coupling of functional connectivity and regional cerebral blood flow reveals a physiological basis for network hubs of the human brain. Proc Natl Acad Sci U S A. 2013;110(5):1929–1934. doi: 10.1073/pnas.1214900110. [DOI] [PMC free article] [PubMed] [Google Scholar]
- Liu Y, Liang M, Zhou Y, He Y, Hao Y, Song M, Yu C, Liu H, Liu Z, Jiang T. Disrupted small-world networks in schizophrenia. Brain. 2008;131(Pt 4):945–961. doi: 10.1093/brain/awn018. [DOI] [PubMed] [Google Scholar]
- Lui S, Li T, Deng W, Jiang L, Wu Q, Tang H, Yue Q, Huang X, Chan RC, Collier DA, Meda SA, Pearlson G, Mechelli A, Sweeney JA, Gong Q. Short-term effects of antipsychotic treatment on cerebral function in drug-naive first-episode schizophrenia revealed by “resting state” functional magnetic resonance imaging. Arch Gen Psychiatry. 2010;67(8):783–792. doi: 10.1001/archgenpsychiatry.2010.84. [DOI] [PubMed] [Google Scholar]
- Lynall ME, Bassett DS, Kerwin R, McKenna PJ, Kitzbichler M, Muller U, Bullmore E. Functional connectivity and brain networks in schizophrenia. J Neurosci. 2010;30(28):9477–9487. doi: 10.1523/JNEUROSCI.0333-10.2010. [DOI] [PMC free article] [PubMed] [Google Scholar]
- Ma S, Calhoun VD, Eichele T, Du W, Adali T. Modulations of functional connectivity in the healthy and schizophrenia groups during task and rest. Neuroimage. 2012 doi: 10.1016/j.neuroimage.2012.05.048. [DOI] [PMC free article] [PubMed] [Google Scholar]
- Marin O. Interneuron dysfunction in psychiatric disorders. Nat Rev Neurosci. 2012;13(2):107–120. doi: 10.1038/nrn3155. [DOI] [PubMed] [Google Scholar]
- McKeown MJ, Makeig S, Brown GG, Jung TP, Kindermann SS, Bell AJ, Sejnowski TJ. Analysis of fMRI data by blind separation into independent spatial components. Hum Brain Mapp. 1998;6(3):160–188. doi: 10.1002/(SICI)1097-0193(1998)6:3<160::AID-HBM5>3.0.CO;2-1. [DOI] [PMC free article] [PubMed] [Google Scholar]
- McKeown MJ, Sejnowski TJ. Independent component analysis of fMRI data: examining the assumptions. Hum Brain Mapp. 1998;6(5–6):368–372. doi: 10.1002/(SICI)1097-0193(1998)6:5/6<368::AID-HBM7>3.0.CO;2-E. [DOI] [PMC free article] [PubMed] [Google Scholar]
- Meda SA, Gill A, Stevens MC, Lorenzoni RP, Glahn DC, Calhoun VD, Sweeney JA, Tamminga CA, Keshavan MS, Thaker G, Pearlson GD. Differences in resting-state functional magnetic resonance imaging functional network connectivity between schizophrenia and psychotic bipolar probands and their unaffected first-degree relatives. Biol Psychiat. 2012;71(10):881–889. doi: 10.1016/j.biopsych.2012.01.025. [DOI] [PMC free article] [PubMed] [Google Scholar]
- Meunier D, Lambiotte R, Bullmore ET. Modular and hierarchically modular organization of brain networks. Front Neurosci. 2010;4:200. doi: 10.3389/fnins.2010.00200. [DOI] [PMC free article] [PubMed] [Google Scholar]
- Meunier D, Lambiotte R, Fornito A, Ersche KD, Bullmore ET. Hierarchical modularity in human brain functional networks. Front Neuroinform. 2009;3:37. doi: 10.3389/neuro.11.037.2009. [DOI] [PMC free article] [PubMed] [Google Scholar]
- Nejad AB, Ebdrup BH, Glenthoj BY, Siebner HR. Brain connectivity studies in schizophrenia: unravelling the effects of antipsychotics. Current neuropharmacology. 2012;10(3):219–230. doi: 10.2174/157015912803217305. [DOI] [PMC free article] [PubMed] [Google Scholar]
- Pearlson GD, Calhoun VD. Convergent approaches for defining functional imaging endophenotypes in schizophrenia. Front Hum Neurosci. 2009;3:37. doi: 10.3389/neuro.09.037.2009. [DOI] [PMC free article] [PubMed] [Google Scholar]
- Pettersson-Yeo W, Allen P, Benetti S, McGuire P, Mechelli A. Dysconnectivity in schizophrenia: where are we now? Neurosci Biobehav Rev. 2011;35(5):1110–1124. doi: 10.1016/j.neubiorev.2010.11.004. [DOI] [PubMed] [Google Scholar]
- Raichle ME. The brain’s dark energy. Sci Am. 2010;302(3):44–49. doi: 10.1038/scientificamerican0310-44. [DOI] [PubMed] [Google Scholar]
- Raichle ME, MacLeod AM, Snyder AZ, Powers WJ, Gusnard DA, Shulman GL. A default mode of brain function. P Natl Acad Sci USA. 2001;98(2):676–682. doi: 10.1073/pnas.98.2.676. [DOI] [PMC free article] [PubMed] [Google Scholar]
- Raichle ME, Snyder AZ. A default mode of brain function: a brief history of an evolving idea. Neuroimage. 2007;37(4):1083–1090. doi: 10.1016/j.neuroimage.2007.02.041. discussion 1097–1089. [DOI] [PubMed] [Google Scholar]
- Rosazza C, Minati L. Resting-state brain networks: literature review and clinical applications. Neurol Sci. 2011;32(5):773–785. doi: 10.1007/s10072-011-0636-y. [DOI] [PubMed] [Google Scholar]
- Rubinov M, Sporns O. Complex network measures of brain connectivity: uses and interpretations. Neuroimage. 2010;52(3):1059–1069. doi: 10.1016/j.neuroimage.2009.10.003. [DOI] [PubMed] [Google Scholar]
- Salvador R, Suckling J, Coleman MR, Pickard JD, Menon D, Bullmore E. Neurophysiological architecture of functional magnetic resonance images of human brain. Cereb Cortex. 2005;15(9):1332–1342. doi: 10.1093/cercor/bhi016. [DOI] [PubMed] [Google Scholar]
- Seeley WW, Menon V, Schatzberg AF, Keller J, Glover GH, Kenna H, Reiss AL, Greicius MD. Dissociable intrinsic connectivity networks for salience processing and executive control. J Neurosci. 2007;27(9):2349–2356. doi: 10.1523/JNEUROSCI.5587-06.2007. [DOI] [PMC free article] [PubMed] [Google Scholar]
- Shen X, Papademetris X, Constable RT. Graph-theory based parcellation of functional subunits in the brain from resting-state fMRI data. Neuroimage. 2010;50(3):1027–1035. doi: 10.1016/j.neuroimage.2009.12.119. [DOI] [PMC free article] [PubMed] [Google Scholar]
- Smith SM, Fox PT, Miller KL, Glahn DC, Fox PM, Mackay CE, Filippini N, Watkins KE, Toro R, Laird AR, Beckmann CF. Correspondence of the brain’s functional architecture during activation and rest. Proc Natl Acad Sci U S A. 2009;106(31):13040–13045. doi: 10.1073/pnas.0905267106. [DOI] [PMC free article] [PubMed] [Google Scholar]
- Sporns O. Network attributes for segregation and integration in the human brain. Curr Opin Neurobiol. 2013;23(2):162–171. doi: 10.1016/j.conb.2012.11.015. [DOI] [PubMed] [Google Scholar]
- Sridharan D, Levitin DJ, Menon V. A critical role for the right fronto-insular cortex in switching between central-executive and default-mode networks. Proc Natl Acad Sci U S A. 2008;105(34):12569–12574. doi: 10.1073/pnas.0800005105. [DOI] [PMC free article] [PubMed] [Google Scholar]
- Stephan KE, Baldeweg T, Friston KJ. Synaptic plasticity and dysconnection in schizophrenia. Biol Psychiatry. 2006;59(10):929–939. doi: 10.1016/j.biopsych.2005.10.005. [DOI] [PubMed] [Google Scholar]
- Tang YY, Rothbart MK, Posner MI. Neural correlates of establishing, maintaining, and switching brain states. Trends in cognitive sciences. 2012;16(6):330–337. doi: 10.1016/j.tics.2012.05.001. [DOI] [PMC free article] [PubMed] [Google Scholar]
- van den Heuvel MP, Stam CJ, Boersma M, Hulshoff Pol HE. Small-world and scale-free organization of voxel-based resting-state functional connectivity in the human brain. Neuroimage. 2008;43(3):528–539. doi: 10.1016/j.neuroimage.2008.08.010. [DOI] [PubMed] [Google Scholar]
- van Os J, Kenis G, Rutten BP. The environment and schizophrenia. Nature. 2010;468(7321):203–212. doi: 10.1038/nature09563. [DOI] [PubMed] [Google Scholar]
- Watts DJ, Strogatz SH. Collective dynamics of ‘small-world’ networks. Nature. 1998;393(6684):440–442. doi: 10.1038/30918. [DOI] [PubMed] [Google Scholar]
- White T, Gottesman I. Brain Connectivity And Gyrification As Endophenotypes For Schizophrenia: Weight Of The Evidence. Curr Top Med Chem. 2012 doi: 10.2174/156802612805289953. [DOI] [PubMed] [Google Scholar]
- Wolf ND, Sambataro F, Vasic N, Frasch K, Schmid M, Schonfeldt-Lecuona C, Thomann PA, Wolf RC. Dysconnectivity of multiple resting-state networks in patients with schizophrenia who have persistent auditory verbal hallucinations. J Psychiatry Neurosci. 2011;36(6):366–374. doi: 10.1503/jpn.110008. [DOI] [PMC free article] [PubMed] [Google Scholar]
- Woodward ND, Rogers B, Heckers S. Functional resting-state networks are differentially affected in schizophrenia. Schizophrenia research. 2011;130(1–3):86–93. doi: 10.1016/j.schres.2011.03.010. [DOI] [PMC free article] [PubMed] [Google Scholar]
- Xia M, He Y. Magnetic resonance imaging and graph theoretical analysis of complex brain networks in neuropsychiatric disorders. Brain Connect. 2011;1(5):349–365. doi: 10.1089/brain.2011.0062. [DOI] [PubMed] [Google Scholar]
- Yu Q, Allen EA, Sui J, Arbabshirani MR, Pearlson G, Calhoun VD. Brain Connectivity Networks In Schizophrenia Underlying Resting State Functional Magnetic Resonance Imaging. Curr Top Med Chem. 2012;12(21):2415–2425. doi: 10.2174/156802612805289890. [DOI] [PMC free article] [PubMed] [Google Scholar]
- Yu Q, Plis SM, Erhardt EB, Allen EA, Sui J, Kiehl KA, Pearlson G, Calhoun VD. Modular Organization of Functional Network Connectivity in Healthy Controls and Patients with Schizophrenia during the Resting State. Frontiers in systems neuroscience. 2011a;5:103. doi: 10.3389/fnsys.2011.00103. [DOI] [PMC free article] [PubMed] [Google Scholar]
- Yu Q, Sui J, Liu J, Plis SM, Kiehl KA, Pearlson G, Calhoun VD. Disrupted correlation between low frequency power and connectivity strength of resting state brain networks in schizophrenia. Schizophrenia research. 2013;143(1):165–171. doi: 10.1016/j.schres.2012.11.001. [DOI] [PMC free article] [PubMed] [Google Scholar]
- Yu Q, Sui J, Rachakonda S, He H, Gruner W, Pearlson G, Kiehl KA, Calhoun VD. Altered topological properties of functional network connectivity in schizophrenia during resting state: a small-world brain network study. PLoS One. 2011b;6(9):e25423. doi: 10.1371/journal.pone.0025423. [DOI] [PMC free article] [PubMed] [Google Scholar]
- Yu Q, Sui J, Rachakonda S, He H, Pearlson G, Calhoun VD. Altered small-world brain networks in temporal lobe in patients with schizophrenia performing an auditory oddball task. Front Syst Neurosci. 2011c;5:7. doi: 10.3389/fnsys.2011.00007. [DOI] [PMC free article] [PubMed] [Google Scholar]
- Zalesky A, Fornito A, Bullmore E. On the use of correlation as a measure of network connectivity. Neuroimage. 2012;60(4):2096–2106. doi: 10.1016/j.neuroimage.2012.02.001. [DOI] [PubMed] [Google Scholar]
- Zemlan FP, Hirschowitz J, Sautter FJ, Garver DL. Impact of lithium therapy on core psychotic symptoms of schizophrenia. Br J Psychiatry. 1984;144:64–69. doi: 10.1192/bjp.144.1.64. [DOI] [PubMed] [Google Scholar]
- Zhang D, Raichle ME. Disease and the brain’s dark energy. Nat Rev Neurol. 2010;6(1):15–28. doi: 10.1038/nrneurol.2009.198. [DOI] [PubMed] [Google Scholar]
Associated Data
This section collects any data citations, data availability statements, or supplementary materials included in this article.
Supplementary Materials
Spatial Z-score maps of the selected 42 ICs. Each IC is shown in sagittal, coronal and axial views. The ICs are divided into groups and arranged based on their anatomical and functional properties.