Abstract
In this article, we investigate the application of contactless high frequency ultrasound microbeam stimulation (HFUMS) for determining the invasion potential of breast cancer cells. In breast cancer patients, the finding of tumor metastasis significantly worsens the clinical prognosis. Thus, early determination of the potential of a tumor for invasion and metastasis would significantly impact decisions about aggressiveness of cancer treatment. Recent work suggests that invasive breast cancer cells (MDA-MB-231), but not weakly invasive breast cancer cells (MCF-7, SKBR3, and BT-474), display a number of neuronal characteristics, including expression of voltage-gated sodium channels. Since sodium channels are often co-expressed with calcium channels, this prompted us to test whether single-cell stimulation by a highly focused ultrasound microbeam would trigger Ca2+ elevation, especially in highly invasive breast cancer cells. To calibrate the diameter of the microbeam ultrasound produced by a 200-MHz single element LiNbO3 transducer, we focused the beam on a wire target and performed a pulse-echo test. The width of the beam was ~17 μm, appropriate for single cell stimulation. Membrane-permeant fluorescent Ca2+ indicators were utilized to monitor Ca2+ changes in the cells due to HFUMS. The cell response index (CRI), which is a composite parameter reflecting both Ca2+ elevation and the fraction of responding cells elicited by HFUMS, was much greater in highly invasive breast cancer cells than in the weakly invasive breast cancer cells. The CRI of MDA-MB-231 cells depended on peak-to-peak amplitude of the voltage driving the transducer. These results suggest that HFUMS may serve as a novel tool to determine the invasion potential of breast cancer cells, and with further refinement may offer a rapid test for invasiveness of tumor biopsies in situ.
Keywords: high frequency ultrasound microbeam, cell stimulation, mechanotransduction, live-cell imaging, calcium fluorescence imaging, invasiveness, breast cancer cells
Introduction
Breast cancer is the leading cancer in women and the second leading cause of female cancer death (Healton et al., 2007). One of the most devastating events for breast cancer patients is discovery of metastases, as metastasis is associated with a poor prognosis (Dahabreh et al., 2008; Seal et al., 2012). Thus, early determination of the invasion potential of tumor cells would greatly facilitate decisions regarding the aggressiveness of therapy after cancer diagnosis (Dahabreh et al., 2008; Seal et al., 2012).
Currently, the only quantitative method to assess tumor cell invasion potential is an assay of cell penetration through a Matrigel barrier (Duxbury et al., 2004; Ji et al., 2007; Kong et al., 2007). Consequently, this method has been used to investigate the molecular mechanisms of tumor cell invasion (Kong et al., 2007), anticancer drug screening (Sasaki and Passaniti, 1998), development of new chemotherapy agents (Ichikawa et al., 2005), and selection of invasive cellular subpopulations (Albini and Benelli, 2007). Although the Matrigel invasion assay is useful for assessing the invasion potential in cells in vitro, it is not suitable for rapid determinations of invasiveness of tumor cells either in vitro or ex vivo, since the method requires time-consuming establishment of cell cultures from tumor biopsies (not always successful) and then at least 24 h to complete the assay. Therefore, the development of a new methodology that enables rapid determination of the invasiveness of tumor cells in vitro and possibly ex vivo would be beneficial to characterize tumor cell invasion processes, screen anticancer drugs, and, furthermore, to decide the aggressiveness of clinical therapeutic strategy.
The invasive nature of various malignant breast tumor cells such as MDA-MB-231, and MCF-7 has been established in many previous breast cancer studies (Chen et al., 2009; Zhang et al., 2011). These studies show that MDA-MB-231 cells are highly invasive, whereas MCF-7 cells are weakly invasive (Chen et al., 2009). In addition, the invasiveness in MDA-MB-231 cells can be reduced with anticancer drug treatment (Sasaki and Passaniti, 1998). Interestingly, recent studies have also highlighted the presence of an embryonic splice variant of Nav1.5 sodium channels selectively in MDA-MB-231 cells, but not in MCF-7 cells (Krasowska et al., 2009). Furthermore, the same studies showed that invasion potential is correlated to the presence of this channel and that external electrical stimuli stimulate cell motility selectively in those cells expressing this embryonic sodium channel (Krasowska et al., 2009). In neurons, sodium channels are often co-expressed with calcium channels, which play a role in mediating calcium entry and calcium-modulated processes, including secretion and motility. Thus, we were prompted to examine whether high frequency ultrasound stimulation stimulates calcium elevations selectively in breast cancer cells with greater invasion potential.
In a recent study of mechano-transduction in living cells (Hwang et al., 2012), we showed that application of a high frequency ultrasound microbeam (HFUM) is more useful for localized, contactless single-cell stimulation than a number of other stimulation methods, including electrical (Sekirnjak et al., 2006), electrical field (Serena et al., 2009), and magnetic stimulation (Brignani et al., 2008). Using high frequency ultrasound microbeam stimulation (HFUMS), it was possible not only to identify functional characteristics of cells, but also to discriminate cell types, according to their functional properties (Hwang et al., 2012). Therefore, we chose to test high frequency ultrasound stimulation, as it is a non-contact and relatively non-invasive method that is capable of targeted stimulations and that may be suited for ex vivo and in vivo applications.
In the present article, we present our findings on high-frequency ultrasound microbeam stimulation of breast cancer cell lines. We demonstrate that a high frequency ultrasound microbeam, which is generated by a 200-MHz single element LiNbO3 transducer, preferentially and without cell contact excites cytoplasmic calcium elevations in highly invasive breast cancer cells (MDA-MB-231), but not in the majority of the weakly invasive breast cancer cells (MCF-7), thereby allowing determination of the cell invasiveness. We monitor cytoplasmic Ca2+ changes using membrane-permeant Fluo-4 AM, a fluorescent calcium indicator. We further confirm our results by comparing MDA-MB-231 cells to two other breast cancer cell lines, SKBR3, and BT-474. Furthermore, we quantify the HFUMS-induced cytoplasmic Ca2+ elevations as a function of the peak-to-peak voltage driving the transducer—we use the peak-to-peak voltage applied to the transducer to represent ultrasonic beam intensity since no existing device is capable of measuring ultrasonic intensity at the high frequencies used in this study (>100 MHz; Hwang et al., 2012). Finally, we compare the Ca2+ elevations elicited in MDA-MB-231 cells that have been treated with the anticancer drug, Taxol, at different concentrations to verify that the Ca2+ elevations are associated with the invasiveness of cancer cells. It is important to note that Taxol kills breast cancer cells as well as reduces their invasiveness by immobilization of their cytoskeleton, and thus the breast cancer cells treated with Taxol at a higher concentration typically exhibited lower invasiveness (Sasaki and Passaniti, 1998; Tran et al., 2009).
Materials and Methods
Cell Preparation and Materials
MDA-MB-231, MCF-7, SKBR3, and BT-474 human breast cancer cell lines were obtained from the ATCC, and maintained in a modified complete medium (RPMI, 10% fetal bovine serum, 10 mM HEPES, 2 mM L-glutamine, 1 mM sodium-pyruvate, 0.05 mM 2-mercaptoethanol, 11 mM D-glucose). The calcium indicator, Fluo-4 AM was purchased from Invitrogen (Grand Island, NY) for live-cell calcium fluorescence imaging. Taxol was obtained from Sigma–Aldrich (Saint Louis, MO). During HFUM stimulation, cells were maintained in an extracellular buffer containing (in mM): 140 NaCl, 2.8 KCl, 10 HEPES (titrated to pH 7.4 with NaOH), and 1 MgCl2·6H2O, 2 CaCl2·2H2O, and 10 D(+) glucose.
HFUM Stimulation and Live Cell Calcium Fluorescence Imaging System
In order to perform live-cell fluorescence imaging of target cells stimulated by HFUM, we built a HFUM stimulation system onto an inverted epi-fluorescence microscope (Olympus IX70). Figure 1 illustrates the system layout including the HFUMS and fluorescence imaging attachments. In order to generate the highly focused ultrasound microbeam for single cell stimulation, we used a 200-MHz press-focused LiNbO3 transducer (fc: 200 MHz and band-width: 29%). The transducer was constructed with conventional transducer fabrication procedures (Lam et al., 2013). The focal length of the transducer was 1.3 mm and the f-number (F#) was 1.6. The measured beam width of the highly focused ultrasound microbeam was 17 μm (Fig. 2a), which was close to the predicted value of 12 μm (=focal length × wavelength) and approximately the size of a breast cancer cell.
Figure 1.
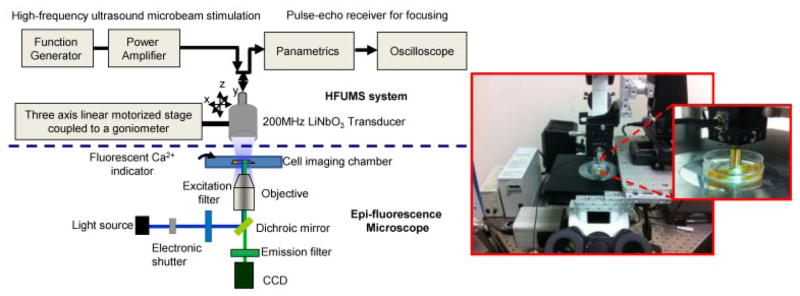
High frequency ultrasound microbeam mechanotransduction system: the system is comprised of a HFUMS system including a 200-MHz ultrasonic transducer for microbeam stimulation and an epi-fluorescence microscope for calcium imaging.
Figure 2.
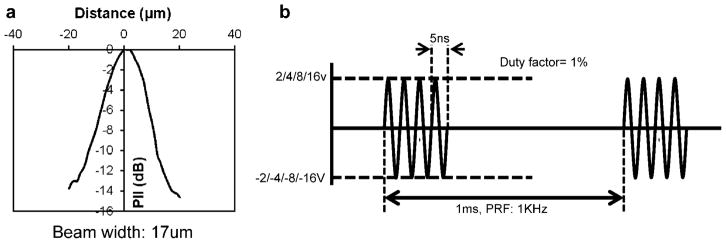
a: Measured beam width produced by the transducer: the measured beam width with a 6-μm tungsten wire target is 17 μm. (PII, pulse intensity integral). b: Excitation signal for the transducer: applied peak-to-peak voltages to the transducer are 4, 8, 16, and 32 V, respectively. Each burst has the duration of 10 μs, and the burst is repeated every 1 ms.
In order to generate the 200-MHz ultrasound microbeam, 200-MHz sinusoidal bursts from a function generator (Stanford Research Systems, Sunnyvale, CA) fed into a 50-dB power amplifier (525LA, ENI, USA), were used to drive the transducer. The resultant peak-to-peak (Vpp) voltages of the bursts were adjusted to 4, 8, 16, and 32 V. The duty factor was tuned to 1%, and the pulse repetition frequency (PRF) was 1 kHz (Fig. 2b).
Live-cell fluorescence imaging was carried out on the epi-fluorescence microscope to monitor the cytoplasmic Ca2+ elevations elicited by HFUMS in individual MDA-MB-231, MCF-7, SKBR3, and BT-474 cells. Light from a mercury lamp was delivered to the cells for excitation after passing through an electronic shutter, an excitation bandpass filter (488 ± 20 nm), a dichroic mirror (cut-off wavelength: 500 nm), and a 20× objective. Fluorescence emitted from the cells was then collected by the same objective and recorded using a high-sensitivity CCD camera (ORCA-Flash2.8, Hamamatsu, Japan) after passing through an emission bandpass filter (530 ± 20 nm).
Precise Localization of Ultrasound Microbeam Focus on Target Cells
In order to efficiently stimulate individual cells with a high-frequency ultrasound microbeam, it is crucial to accurately localize an ultrasound microbeams focus on the target cell. In our previous study (Hwang et al., 2012), the focus was found using rhodamine B dyes, which exhibit temperature-sensitive fluorescence intensity changes. However, the diameter of the visualized focus obtained by using the rhodamine B dyes was found to be much larger than that obtained using a tungsten wire, thus reducing the beam localization accuracy. Furthermore, additional procedures, including transducer cleaning and fluorophore solution preparation, were needed for the method. Therefore, for more precise localization, we developed an alternative approach, capable of localizing the ultrasound microbeam focus with sub-micron resolution. As illustrated in Figure 3, to identify the focus in the x-axis, a vertically aligned 6 μm tungsten wire target was positioned at the center of the field of view (image size: 960 × 720 pixels; Fig. 3a, middle). Subsequently, a pulse-echo test was performed repeatedly while the transducer was scanned across the wire target in the x-direction with a 1-μm step size, in order to find the x-axis position where the echo-signal exhibited maximum intensity (Fig. 3a, bottom). For y-axis positioning of the focal spot, the wire target was rotated by 90° and positioned at the center of the image (Fig. 3b, middle). A pulse-echo test was then performed again over the wire target along y-axis with a 1-μm step size in order to find the y-axis position where the echo signal exhibited the maximum intensity. The resultant echo signals are shown in Figure 3a and b (bottom), respectively. Finally, after localization of the ultrasound microbeams focus (x-position: 0 and y-position: 0), a target cell was positioned at the center of the image (Fig. 3c).
Figure 3.
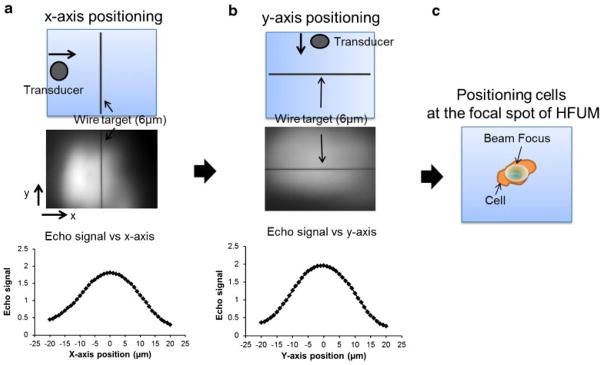
Localization of an ultrasound microbeam focus at a target cell: (a) x-axis positioning of an ultrasound microbeam focal spot. After a wire target was oriented and positioned in the middle of the field of view of an image along y-axis (middle), echo signals (I) of ultrasound versus x-axis (bottom) were obtained; (b) y-axis positioning of an ultrasound microbeams focal spot. After a wire target was oriented and positioned in the middle of the field of view of an image along x-axis (middle), echo signals of ultrasound versus y-axis (bottom) were obtained; (c) positioning a cell at the focal spot of an ultrasound microbeam.
Live-Cell Calcium Fluorescence Imaging
We used Fluo 4-AM for live-cell calcium fluorescence imaging. 105 cells were plated on 35 mm petri-dishes and incubated in the complete medium at 37°C for 36 h before 1 μM Fluo 4-AM solution, diluted with the external buffer solution, was added to the dishes. After the cells were incubated at room temperature for 30 min, the cells were thoroughly washed with external buffer solution and then time-lapse fluorescence imaging was initiated after the target cells were positioned at the microbeam focus. Fluorescence images were acquired at 1 Hz for t = 300 s (exposure time: 300 ms), as the HFUM was switched on and off at t = 50 s and t = 200 s, respectively.
Quantitative Analysis for Cytoplasmic Ca2+ Elevations in Individual Cells
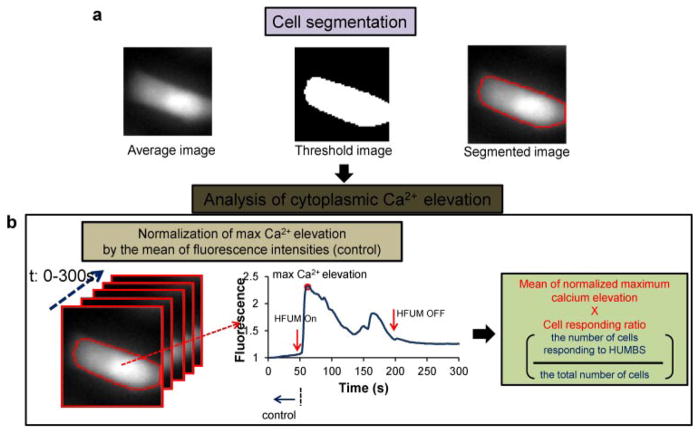
Quantitative analysis of Ca2+ changes in MDA-MB-231, MCF-7, SKBR3, and BT-474 cells was achieved with in-house software, as illustrated in Figure 4. The program was written to obtain the mean normalized maximum calcium elevation value (Ozkucur et al., 2009) and a cell responding ratio (Bunn et al., 1990) (cell responding ratio = the number of cells responding to HFUMS/the number of total cells subjected to HFUMS) from segmented images of target cells, semi-automatically (Fig. 4a). More specifically, after fluorescence images of cells acquired at different time-points (0–300 s, step: 1 s) were averaged, the target cell receiving HFUMS in the averaged image was selected and segmented by the Otsus method (Otsu, 1979), followed by the calculation of mean fluorescence intensities in the segmented regions of each image obtained at the indicated time-points. Temporal changes of the mean fluorescence in the target cell (Fig. 4b) were then analyzed to determine whether calcium elevations were elicited by HFUMS in the cell. The calcium elevation was here measured as the increase in the fluorescence intensity. In the cell exhibiting calcium elevations, the maximum calcium elevation value with HFUM stimulation of the cells was normalized to the mean value of fluorescence intensities (control) obtained prior to HFUMS (Ozkucur et al., 2009). Finally, after the normalized maximum calcium elevations obtained from independent cells (n > 9) were averaged, the mean value was multiplied by the cell responding ratio to give a composite parameter, called the cell response index (CRI), where a larger CRI indicates a stronger response to HFUMS. Use of the cell responding ratio in addition to magnitude of Ca2+ elevations has also been considered in other studies to quantify cellular responses to external stimuli (Bunn et al., 1990).
Figure 4.
Quantitative analysis of calcium elevation: (a) cell segmentation. A threshold image of the average (left) of stacked images was formed (middle) with the Otsu’s method, and then the individual cells were segmented (right-panel). (b) Analysis of cytoplasmic Ca2+ elevation. Fluorescence temporal changes were obtained from the segmented stacked images (left), and then the cells exhibiting Ca2+ elevation (middle) were found. Finally, the mean of normalized maximum calcium elevation was multiplied by cell responding ratio to give the cell response index, CRI.
Taxol Treatment
In order to investigate the effects of the anticancer agent Taxol on HFUMS-induced Ca2+ elevations in MDA-MB-231 cells, 105 cells were plated in 35 mm petri-dishes and incubated in the RPMI complete medium at 37°C for 24 h, followed by Taxol treatment of the cells at the indicated concentrations (0, 1, 10, and 100 nM). After 24 h, the cells were thoroughly washed with external buffer solution. Live-cell calcium fluorescence imaging of the cells (n = 10) was performed during HFUM stimulation, as already described.
Cell Invasion Assay
Cell invasion assays were performed on 8 μm diameter pore BD BioCoat Matrigel Invasion Chambers (BD Biosciences, San Jose, CA) according to the manufacturers instructions. Cells (1.5 × 10⁵) were added to chambers and incubated for 2 days at 37°C. Matrigel and noninvasive cells inside the chamber were removed by Q-tip, and the invasive cells that had passed through the matrigel of the chamber were stained with 0.2% crystal violet in 10% ethanol. Absorbance (at 590 nm) of each well was measured and quantified using a plate reader (SpectraMax M2, Molecular Devices, Sunnyvale, CA). Three independent fields of invasive cells per well were photographed under microscopy, and one representative field is shown in Figure 6b.
Figure 6.
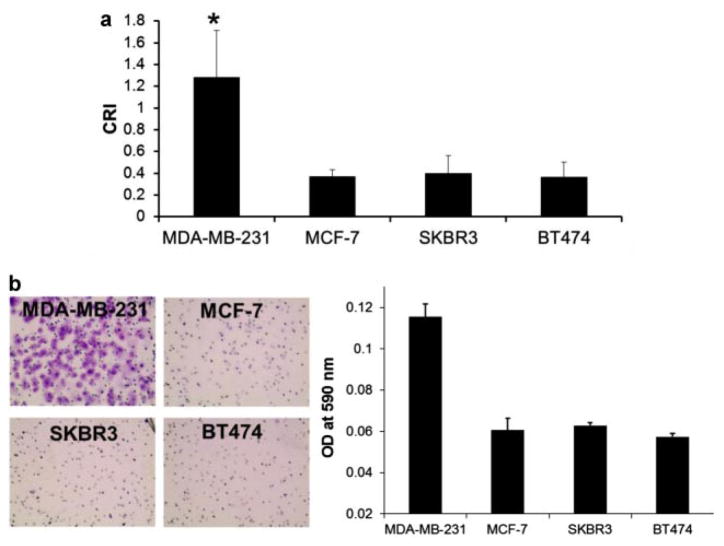
Quantitative CRI values of the indicated breast cancer cells: (a) CRI values in MDA-MB-231 (n = 58), MCF-7 (n = 58), SKBR3 (n = 40), and BT-474 (n = 40) cells. The quantitative CRI values were obtained by using the program mentioned previously (*P-value < 0.01). Cell responding ratios of MDA-MB-231, MCF-7, SBKR3, and BT-474 cells were ~0.82, ~0.24, ~0.34, and ~0.26, respectively. The error bars indicate standard deviations. b: Invasion assay of the indicated breast cancer cells: the cells, which have passed through the membrane of a Matrigel invasion chamber, were dyed crystal violet (CV; left) and the cell numbers were quantitated using CV assay (right). n, the number of cells.
Statistical Analysis
The CRIs of MDA-MB-231, MCF-7, SKBR3, and BT-474 cells were compared. All data were expressed as mean ± standard deviation of indicated sample sizes, and were analyzed by a two-tailed paired t-test, with the level of significance set at P-value < 0.01. The number of invading cells was quantitated from triplicate experiments.
Results
Cytoplasmic Ca2+ Variations in MDA-MB-231 and MCF-7 Cells Elicited by HFUMS
Live-cell fluorescence imaging was used to monitor Ca2+ changes in MDA-MB-231 (highly invasive) and MCF-7 (weakly invasive) cells, preincubated with Fluo-4 AM. HFUMS elicited small fluorescence decreases in most MCF-7 cells (Fig. 5a, lower; Supplementary Video 1), whereas significant fluorescence increases were observed in MDA-MB-231 cells (Fig. 5a, upper; Supplementary Video 2). Figure 5b illustrates the normalized Ca2+ temporal variations in MDA-MB-231 and MCF-7 cells due to HFUMS. The MDA-MB-231 cells clearly exhibited transient Ca2+ elevations when HFUM was on. In contrast, in most MCF-7 cells such transient calcium elevations by HFUMS were not observed.
Figure 5.
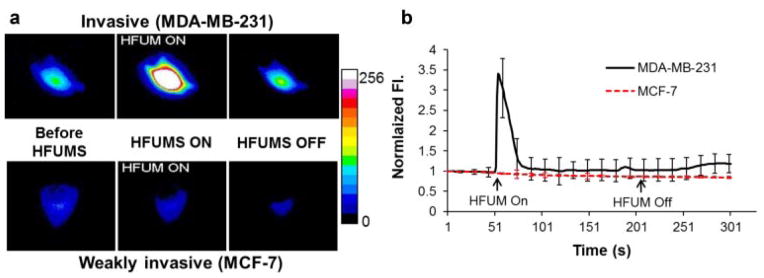
Ca2+ changes in MDA-MB-231 and MCF-7 cells due to HFUMS: (a) pseudo-color fluorescence images obtained at the indicated time-points (before HFUM On, HFUM On, and after HFUM Off). b: Ca2+ changes over times. HFUM was switched on at 50 s and off at 200 s (input voltage: 32 V, duty factor: 0.0025%, and PRF: 1 kHz).
CRI Values in Breast Cancer Cells Elicited by HFUMS
Ca2+ elevations in MDA-MB-231, MCF-7, SKBR3, and BT-474 cells subjected to HFUM were quantitated using the program described in Materials and Methods Section. Figure 6a demonstrates that the CRI for MDA-MB-231 cells (n = 58) is significantly higher than that for MCF-7 (n = 58), SKBR3 (n = 40), and BT-474 (n = 40) cells (P-value <0.01). The cell responding ratio of MDA-MB-231 cells was ~0.82, whereas the cell responding ratios of MCF-7, SKBR3, and BT-474 cells were ~0.24, ~0.34, and ~0.26. We also assessed the invasiveness in MDA-MB-231, MCF-7, SKBR3, and BT-474 cells using a Matrigel invasion chamber (Fig. 6b). Indeed, the number of MDA-MB-231 cells (Fig. 6b, left) that passed through the Matrigel barrier was much higher than that of the other cell types (Fig. 6b, right). Together, these results demonstrate that the HFUMS-induced Ca2+ elevations in MDA-MB-231 cells are significantly higher than those in MCF-7, SKBR3, and BT-474 cells, and they suggest that HFUMS-stimulated calcium elevation may be used to distinguish MDA-MB-231 cells from MCF-7, SKBR3, and BT-474 cells, and perhaps may be used to determine the invasiveness of breast cancer cells. We will address this issue further, below, after we examine the role of the amplitude of the voltage driving the transducer in determining the cell responses.
Effect of Microbeam Exposure Levels on Cytoplasmic Ca2+ Elevation in MDA-MB-231 Cells
Figure 5 shows that HFUMS is an effective stimulus for cytoplasmic Ca2+ elevation in MDA-MB-231 cells. We next analyzed whether the degree of responsiveness among MDA-MD-231 cells depends on the amplitude of the voltage driving the HFUM transducer. Figure 7 shows the normalized CRI values at the indicated voltage inputs to the transducer. When the voltage inputs were 4 and 8 V, the CRI values significantly increased up to almost a fourfold increase over the baseline value (0 V input; P-value: ~6.7 × 10⁻⁷ ≪ 0.01). Also, the CRI values increased more as the input voltages were increased (Fig. 7). These results demonstrate that there is indeed a dose–response relationship between the CRI value and acoustic pressure.
Figure 7.
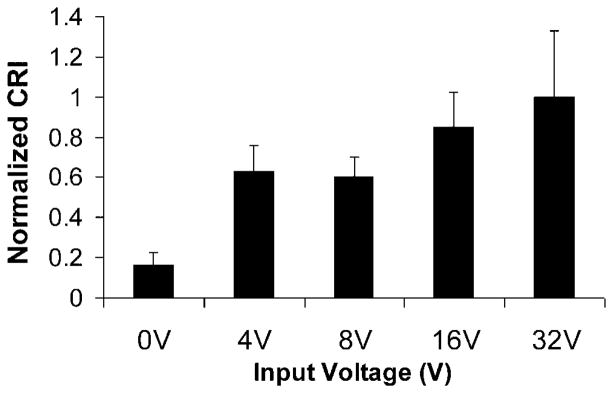
Normalized CRI values for MDA-MB-231 cells (n = 9) at indicated voltage inputs (0, 4, 8, 16, and 32 V) to the transducer: PRF was 1 kHz and duty factor was 1%. Each CRI value was normalized by the CRI value obtained at the 32 V peak-to-peak voltage input. n, the number of cells.
Effects of Anticancer Drugs on HFUMS-Induced Ca2+ Elevations in MDA-MB-231 Cells
We next assessed whether treatment of MDA-MD-231 cells with the anticancer agent Taxol affects the responsiveness of the cells to HFUMS. Taxol has been utilized as an anticancer drug for cancer treatment for decades (Hirata et al., 2011; Pernas et al., 2012) and is known to inhibit tumor growth as well as reduce the invasiveness of tumor cells (Sasaki and Passaniti, 1998). We performed HFUMS stimulation of cells treated with a range of Taxol concentrations. Figure 8 shows that the CRI decreases as the Taxol concentration increases. Only 1 nM Taxol was sufficient to reduce the CRI by ~50%, relative to the untreated cells. Furthermore, 100 nM Taxol reduced the CRI to 0%. Thus, our results suggest that the HFUMS-induced Ca2+ elevations in MDA-MB-231 cells are correlated with their invasiveness and raise the possibility that monitoring HFUMS-induced Ca2+ elevations in breast cancer cells may be utilized to quantify the invasiveness in the cells.
Figure 8.
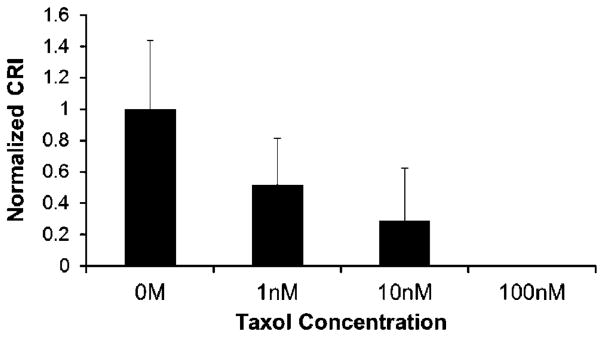
Normalized CRI in MDA-MB-231 treated with Taxol at the indicated concentrations (0, 1, 10, and 100 nM) due to HFUMS: the mean values were normalized to the mean value for 0 M Taxol-treated cells (n = 10). The normalized CRIs were ~1 at 0 nM, ~0.52 at 1 nM, ~0.29 at 10 nM, and 0 at 100 nM, respectively. n, the number of cells.
Discussion
This work demonstrates that HFUMS elicits cytosolic calcium elevations in highly invasive breast cancer cells to a significantly greater extent than it does in weakly invasive breast cancer cells, suggesting that HFUMS may be a useful tool for identification of invasion potential of breast cancer cells. HFUMS has many advantages over other stimulation methods including chemical and non-chemical approaches (Brignani et al., 2008; Sekirnjak et al., 2006; Serena et al., 2009): (1) HFUMS is relatively noninvasive; (2) it may be suited for tumor biopsies in situ and tumors in vivo, possibly without tumor extraction; (3) it allows single cell stimulation at a micro scale (<~17 μm); (4) it provides more versatilities in stimulation of breast cancer cells in terms of beam size, intensity level, and penetration depth; (5) it can be complementarily combined with other imaging modalities such as acoustic radiation force impulse imaging (Park et al., 2012), which enables the estimation of elastic properties of tumor cells in situ and in vivo. Notably, the elastic properties of cancer cells have been importantly considered as one of primary indicators in the determination of metastatic potential of breast cancer cells. Thus, combining measurements of HFUMS-induced calcium elevation and estimation of their elastic properties may offer more accurate determination of the metastatic potential of breast tumor cells both in situ and in vivo.
Figure 5b illustrates that HFUMS elicited cytosolic calcium elevations in MDA-MB-231 cells, but not markedly in MCF-7 cells. Interestingly, the initiating times, durations, amplitudes, and number of transient Ca2+ elevations elicited by HFUMS differed slightly for individual breast cancer cells. Many reports highlight extensive genetic heterogeneity among cancer cells not only in vitro but also in situ in tumors (Shipitsin et al., 2007). This may underlie the variability we observed in responsiveness of cells to HFUMS.
Figure 6a and b illustrate that the CRI values of the breast cancer cells are highly correlated with their Matrigel invasion assay results. The invasion assay results reported here are in good agreement with results from previous studies (Ichikawa et al., 2005; Zajchowski et al., 2001). In this study, weakly invasive breast cancer cells sometimes exhibited HFUMS-elicited cytosolic calcium elevations. However, the responding ratios of those cells were significantly lower than that of MDA-MB-231 (highly invasive) cells. In addition, their overall calcium elevation levels were much lower than those of MDA-MB-231 cells.
The CRI values depended on voltage inputs to the transducer (Fig. 7). Since acoustic pressures are typically proportional to voltage inputs to a transducer, these results support the idea that CRI values are highly related to acoustic pressures. While the acoustic pressures of <60 MHz ultrasound can be typically quantified using a hydrophone method (Huang and Shung, 2005), there are no established methods to measure acoustic pressures of ultrasound transducers operating at the frequency used here (200 MHz). It may be possible to estimate the acoustic peak pressures generated from high frequency ultrasound transducers by simulating transducer characteristics with finite element analysis (PZFlex, Weidlinger Associates, Mountain View, CA). In fact, simulations are widely used for designing the transducers, modeling the ultrasound propagation, and calculating thermal effects of high-frequency ultrasound (Feng et al., 2005; Zhou et al., 2010). However, simulations must ultimately be validated through experimental measurement. Thus, in order to relate the CRI values to acoustic pressures, new methods capable of measuring the acoustic peak pressures at high frequencies must be developed.
The results shown in Figure 8 demonstrate that MDA-MB-231 cells treated with higher concentrations of Taxol exhibit lower CRI values. Increasing Taxol concentrations in the range of concentrations tested here are known to progressively abrogate microtubule formation, hinder cellular motility, and thereby inhibit breast cancer cell invasion into other tissues (Sasaki and Passaniti, 1998). Thus, the findings support the idea that CRI correlates with invasion potential.
Conclusions
This article demonstrates that HFUMS is capable of eliciting Ca2+ elevations in breast cancer cells, in particular in strongly invasive MDA-MB-231 cells and much less in the weakly invasive cells, and the magnitude of the response is dependent on the peak-to-peak voltage applied to the transducer. Furthermore, the calcium response index CRI in MDA-MD-231 cells is reduced in a dose-dependent fashion by increasing concentrations of Taxol, an anticancer drug known to reduce cancer cell invasiveness. Taken together, these results show that HFUMS is useful as a tool to determine the invasiveness of breast cancer cells in in vitro cell culture, and they suggest that it may be applied to evaluate invasion potential of breast tumor biopsy samples given a HFUMS system suited for in vivo and ex vivo applications, thus enabling to rapidly determine the invasiveness of breast cancer cells in situ without cell cultures. The application of HFUMS may be extended to the determination of invasion potentials of other cancer types. In addition, it may complement biomarker assays and measurements of cell elastic responses to assess tumor invasion potential. Therefore, the studies are currently underway to determine whether HFUMS may similarly be applied for non-breast cancers.
Supplementary Material
Ca2+ elevations in MCF-7 cells due to HFUMS.
Ca2+ elevations in MDA-MB-231 cells due to HFUMS.
Acknowledgments
This work has been supported by the NIH grants (R01-EB012058, and P41-EB2182) to K.K. Shung and NIH R01 GM85791 and Wright Foundation grants to R.H. Chow. Thanks to Harry Chiu for helping PZFlex simulation of a transducer for the estimation of acoustic pressures. We thank Dr. Tzung K. Hsiai for providing cell culture facilities.
Footnotes
Additional supporting information may be found in the online version of this article at the publishers web-site.
References
- Albini A, Benelli R. The chemoinvasion assay: A method to assess tumor and endothelial cell invasion and its modulation. Nat Protoc. 2007;2(3):504–511. doi: 10.1038/nprot.2006.466. [DOI] [PubMed] [Google Scholar]
- Brignani D, Manganotti P, Rossini PM, Miniussi C. Modulation of cortical oscillatory activity during transcranial magnetic stimulation. Hum Brain Mapp. 2008;29(5):603–612. doi: 10.1002/hbm.20423. [DOI] [PMC free article] [PubMed] [Google Scholar]
- Bunn PA, Dienhart DG, Chan D, Puck TT, Tagawa M, Jewett PB, Braunschweiger E. Neuropeptide stimulation of calcium flux in human lung cancer cells: Delineation of alternative pathways. Proc Natl Acad Sci USA. 1990;87(6):2162–2166. doi: 10.1073/pnas.87.6.2162. [DOI] [PMC free article] [PubMed] [Google Scholar]
- Chen H, Zhu G, Li Y, Padia RN, Dong Z, Pan ZK, Liu K, Huang S. Extracellular signal-regulated kinase signaling pathway regulates breast cancer cell migration by maintaining slug expression. Cancer Res. 2009;69 (24):9228–9235. doi: 10.1158/0008-5472.CAN-09-1950. [DOI] [PMC free article] [PubMed] [Google Scholar]
- Dahabreh IJ, Linardou H, Siannis F, Fountzilas G, Murray S. Trastuzumab in the adjuvant treatment of early-stage breast cancer: A systematic review and meta-analysis of randomized controlled trials. Oncologist. 2008;13(6):620–630. doi: 10.1634/theoncologist.2008-0001. [DOI] [PubMed] [Google Scholar]
- Duxbury MS, Ito H, Zinner MJ, Ashley SW, Whang EE. siRNA directed against c-Src enhances pancreatic adenocarcinoma cell gemcitabine chemosensitivity. J Am Coll Surg. 2004;198(6):953–959. doi: 10.1016/j.jamcollsurg.2004.01.037. [DOI] [PubMed] [Google Scholar]
- Feng F, Mal A, Kabo M, Wang JC, Bar-Cohen Y. The mechanical and thermal effects of focused ultrasound in a model biological material. J Acoust Soc Am. 2005;117(4 Pt 1):2347–2355. doi: 10.1121/1.1873372. [DOI] [PubMed] [Google Scholar]
- Healton CG, Gritz ER, Davis KC, Homsi G, McCausland K, Haviland ML, Vallone D. Womens knowledge of the leading causes of cancer death. Nicotine Tob Res. 2007;9(7):761–768. doi: 10.1080/14622200701397916. [DOI] [PubMed] [Google Scholar]
- Hirata T, Yonemori K, Ando M, Hirakawa A, Tsuda H, Hasegawa T, Chuman H, Namikawa K, Yamazaki N, Fujiwara Y. Efficacy of taxane regimens in patients with metastatic angiosarcoma. Eur J Dermatol. 2011;21 (4):539–545. doi: 10.1684/ejd.2011.1403. [DOI] [PubMed] [Google Scholar]
- Huang B, Shung KK. Characterization of high-frequency, single-element focused transducers with wire target and hydrophone. IEEE Trans Ultrason Ferroelectr Freq Control. 2005;52(9):1608–1612. doi: 10.1109/tuffc.2005.1516034. [DOI] [PMC free article] [PubMed] [Google Scholar]
- Hwang JY, Lee J, Lee C, Jakob A, Lemor R, Medina-Kauwe LK, Kirk Shung K. Fluorescence response of human HER2+ cancer- and MCF-12F normal cells to 200MHz ultrasound microbeam stimulation: A preliminary study of membrane permeability variation. Ultrasonics. 2012;52(7):803–808. doi: 10.1016/j.ultras.2012.03.002. [DOI] [PMC free article] [PubMed] [Google Scholar]
- Ichikawa H, Takada Y, Murakami A, Aggarwal BB. Identification of a novel blocker of I kappa B alpha kinase that enhances cellular apoptosis and inhibits cellular invasion through suppression of NF-kappa B-regulated gene products. J Immunol. 2005;174(11):7383–7392. doi: 10.4049/jimmunol.174.11.7383. [DOI] [PubMed] [Google Scholar]
- Ji H, Ramsey MR, Hayes DN, Fan C, McNamara K, Kozlowski P, Torrice C, Wu MC, Shimamura T, Perera SA, Bronson RT, Lindeman NI, Christiani DC, Lin X, Shapiro GI, Jänne PA, Johnson BE, Meyerson M, Kwiatkowski DJ, Castrillon DH, Bardeesy N, Sharpless NE, Wong KK. LKB1 modulates lung cancer differentiation and metastasis. Nature. 2007;448(7155):807–810. doi: 10.1038/nature06030. [DOI] [PubMed] [Google Scholar]
- Kong D, Li Y, Wang Z, Banerjee S, Sarkar FH. Inhibition of angiogenesis and invasion by 3,3′-diindolylmethane is mediated by the nuclear factor-kappaB downstream target genes MMP-9 and uPA that regulated bioavailability of vascular endothelial growth factor in prostate cancer. Cancer Res. 2007;67(7):3310–3319. doi: 10.1158/0008-5472.CAN-06-4277. [DOI] [PubMed] [Google Scholar]
- Krasowska M, Grzywna ZJ, Mycielska ME, Djamgoz MB. Fractal analysis and ionic dependence of endocytotic membrane activity of human breast cancer cells. Eur Biophys J. 2009;38(8):1115–1125. doi: 10.1007/s00249-009-0516-z. [DOI] [PubMed] [Google Scholar]
- Lam KH, Hsu HS, Li Y, Lee C, Lin A, Zhou Q, Kim ES, Shung KK. Ultrahigh frequency lensless ultrasonic transducers for acoustic tweezers application. Biotechnol Bioeng. 2013;110(3):881–886. doi: 10.1002/bit.24735. [DOI] [PMC free article] [PubMed] [Google Scholar]
- Otsu N. A threshold selection method from Gray-level histograms. Syst Man Cybern IEEE Trans. 1979;9(1):62–66. [Google Scholar]
- Ozkucur N, Monsees TK, Perike S, Do HQ, Funk RH. Local calcium elevation and cell elongation initiate guided motility in electrically stimulated osteoblast-like cells. PLoS ONE. 2009;4(7):e6131. doi: 10.1371/journal.pone.0006131. [DOI] [PMC free article] [PubMed] [Google Scholar]
- Park J, Lee J, Lau ST, Lee C, Huang Y, Lien CL, Kirk Shung K. Acoustic radiation force impulse (ARFI) imaging of zebrafish embryo by high-frequency coded excitation sequence. Ann Biomed Eng. 2012;40(4):907–915. doi: 10.1007/s10439-011-0466-3. [DOI] [PMC free article] [PubMed] [Google Scholar]
- Pernas S, Gil-Gil M, de Olza MO, Gumà A, Climent F, Petit A, Pla MJ, García-Tejedor A, López-Ojeda A, Falo C, et al. Efficacy and safety of concurrent trastuzumab plus weekly paclitaxel-FEC as primary therapy for HER2-positive breast cancer in everyday clinical practice. Breast Cancer Res Treat. 2012;134(3):1161–1168. doi: 10.1007/s10549-012-2149-7. [DOI] [PubMed] [Google Scholar]
- Sasaki CY, Passaniti A. Identification of anti-invasive but noncytotoxic chemotherapeutic agents using the tetrazolium dye MTT to quantitate viable cells in Matrigel. Biotechniques. 1998;24(6):1038–1043. doi: 10.2144/98246cr04. [DOI] [PubMed] [Google Scholar]
- Seal MD, Speers CH, OReilly S, Gelmon KA, Ellard SL, Chia SK. Outcomes of women with early-stage breast cancer receiving adjuvant trastuzumab. Curr Oncol. 2012;19(4):197–201. doi: 10.3747/co.19.960. [DOI] [PMC free article] [PubMed] [Google Scholar]
- Sekirnjak C, Hottowy P, Sher A, Dabrowski W, Litke AM, Chichilnisky EJ. Electrical stimulation of mammalian retinal ganglion cells with multielectrode arrays. J Neurophysiol. 2006;95(6):3311–3327. doi: 10.1152/jn.01168.2005. [DOI] [PubMed] [Google Scholar]
- Serena E, Figallo E, Tandon N, Cannizzaro C, Gerecht S, Elvassore N, Vunjak-Novakovic G. Electrical stimulation of human embryonic stem cells: Cardiac differentiation and the generation of reactive oxygen species. Exp Cell Res. 2009;315(20):3611–3619. doi: 10.1016/j.yexcr.2009.08.015. [DOI] [PMC free article] [PubMed] [Google Scholar]
- Shipitsin M, Campbell LL, Argani P, Weremowicz S, Bloushtain-Qimron N, Yao J, Nikolskaya T, Serebryiskaya T, Beroukhim R, Hu M, et al. Molecular definition of breast tumor heterogeneity. Cancer Cell. 2007;11 (3):259–273. doi: 10.1016/j.ccr.2007.01.013. [DOI] [PubMed] [Google Scholar]
- Tran TA, Gillet L, Roger S, Besson P, White E, Le Guennec JY. Non-anti-mitotic concentrations of taxol reduce breast cancer cell invasiveness. Biochem Biophys Res Commun. 2009;379(2):304–308. doi: 10.1016/j.bbrc.2008.12.073. [DOI] [PubMed] [Google Scholar]
- Zajchowski DA, Bartholdi MF, Gong Y, Webster L, Liu HL, Munishkin A, Beauheim C, Harvey S, Ethier SP, Johnson PH. Identification of gene expression profiles that predict the aggressive behavior of breast cancer cells. Cancer Res. 2001;61(13):5168–5178. [PubMed] [Google Scholar]
- Zhang L, Sullivan PS, Goodman JC, Gunaratne PH, Marchetti D. MicroRNA-1258 suppresses breast cancer brain metastasis by targeting heparanase. Cancer Res. 2011;71(3):645–654. doi: 10.1158/0008-5472.CAN-10-1910. [DOI] [PMC free article] [PubMed] [Google Scholar]
- Zhou Q, Wu D, Liu C, Zhu B, Djuth F, Shung K. Micro-machined high-frequency (80 MHz) PZT thick film linear arrays. IEEE Trans Ultrason Ferroelectr Freq Control. 2010;57(10):2213–2220. doi: 10.1109/TUFFC.2010.1680. [DOI] [PMC free article] [PubMed] [Google Scholar]
Associated Data
This section collects any data citations, data availability statements, or supplementary materials included in this article.
Supplementary Materials
Ca2+ elevations in MCF-7 cells due to HFUMS.
Ca2+ elevations in MDA-MB-231 cells due to HFUMS.


