

Abstract
Protein dielectrophoresis (DEP) has the potential to play an important role as a manipulation, fractionation, pre-concentration and separation method in bioanalysis and as manipulation tool for nanotechnological applications. The first demonstrations of protein DEP have been reported almost twenty years ago. Since then various experimental realizations to manipulate proteins by DEP as well as more targeted applications employing protein DEP have been demonstrated. This review summarizes the experimental studies in the field of protein DEP trapping and focusing as well as specific applications in separation, molecular patterning, on bioprobes and biosensors. While a comprehensive theoretical model describing protein DEP is still lacking we also attempt to provide an overview of the factors influencing protein DEP and relate to currently available theoretical models. We further point out the variations in experimental conditions used in the past to study the somewhat 20 proteins as well as the implications of protein molecular structure to the DEP response.
Keywords: protein, dielectrophoresis, trapping, focusing, applications
1. Introduction
The analysis of proteins often requires powerful separation, fractionation and pre-concentration techniques, which can in many cases only be achieved through the combination of orthogonal techniques. Sensitive protein detection as well as pre-purification is also an important aspect in diagnosis as well as techniques to identify and manipulate proteins with label-free methods. Moreover, protein analysis is often performed in complex mixtures such as body fluids or cell lysates. Adding a novel tool, such as dielectrophoresis (DEP), to the portfolio of protein manipulation techniques has thus large potential to improve protein analysis techniques. As a gradient technique, DEP seems highly suited to extend current protein separation methods as it has the potential to both provide a concentration tool (note that proteins can not be amplified in contrast to DNA) and improve current separation approaches especially in combination with other orthogonal techniques. In the following, we describe the current realizations demonstrating protein DEP and applications employing it in fields of separation, biosensing and positioning.
Dielectrophoresis (DEP) refers to the migration of a polarizable particle in an inhomogeneous electric field (E). For most DEP applications, it is useful to describe the force acting on a polarizable particle. In classical DEP theory, the time averaged DEP force for a spherical particle in a medium of permittivity εm is given as [1,2]:
| eq. (1) |
where r is the particle radius, ω the angular frequency, Erms the root mean square electric field and Re[K(ω)] the real part of the Clausius-Mossotti factor given by:
| eq. (2) |
Here, and denote the complex permittivities of the particle (p) and medium (m), respectively. The complex permittivity for the particle (and similarly for the medium) is given by , where σp denotes the particle conductivity, and . The Clausius-Mossotti factor is characteristic for the DEP response. Depending on the sign of the Clausius-Mossotti factor, particles are attracted to the regions of highest electric fields or repulsed from those regions. These two cases refer to positive and negative DEP (pDEP and nDEP), respectively. Equation 1 demonstrates the frequency dependence of the dielectrophoretic response of a sphere and allows estimating the resulting forces in electric field gradients of known magnitude. At high frequency, Fdep is typically governed by the particle permittivity. At low frequency and under DC conditions the Clausius-Mossotti factor is dominated by the conductivity of the particle and the medium. Moreover, the frequency dependent change from positive to negative DEP is characterized by the so-called crossover frequency where the Clausius-Mossotti factor reverses its sign. The polarization effects on particles are often studied by investigating the changes in crossover frequency.
As a result of this description it becomes apparent that DEP can not only transport particles or proteins along or against the electric field gradient, but also concentrate them. These characteristics make DEP appealing for analytical applications such as fractionation, pre-concentration and separation methods. Moreover, DEP has the potential to precisely manipulate and position small particles such as cells [3] or even single molecules [4], which is important for a variety of nanotechnological applications [5]. For example, DEP of biological particles has demonstrated widespread applications. Those include cell separation [6,7], fractionation [8–10], cytometry [11] or patterning [12] and can be achieved selectively for various cell types. Additionally, DEP allows the manipulation of biological objects such as cells without labeling strategies [2]. This is also an important aspect for analytical applications of proteins where label free strategies are desired.
As we should expect DEP to occur for particles with induced dipole, a dielectrophoretic response from biomolecules is also predicted. Among biomolecules, DNA has been characterized most intensively, although the mechanism of polarization and the length and frequency dependence remain still debated [13,14]. Commonly, a polarization of the counter ions surrounding the negatively charged DNA backbone is assumed to be responsible for DNA DEP. Theoretical models describing the DNA DEP response are available including influences from convection, diffusion, and electrophoretic migration [15,16], however they fail to describe DNA response in a general manner and do not apply to the variety of experimentally observed scaling laws and DNA DEP response. Nonetheless, various bioanalytical applications employing DEP of DNA have been demonstrated, including separation [17–19], fractionation [20,21], and concentration [22].
The potential of DEP for protein manipulation and analysis has been recognized and pioneered by Washizu et al. almost 20 years ago [20]. In their work, the possibility of fractionation of proteins was outlined as well as some fundamental characteristics of biomolecule DEP. Microfabricated electrodes were introduced to generate high electric field gradients in microchip devices in order to compensate for the small polarizability expected for proteins in comparison with micrometer sized objects such as cells. Follow up work mainly by Hughes, Morgan and coworkers showed a more detailed investigation of selected proteins on patterned microelectrodes as well as a characteristic frequency dependence of protein DEP [23,24]. In the last decade, the interest in protein DEP intensified due to the demand in protein analysis tools as well as the improvement of micro- and nanofabrication techniques applied to protein DEP, e.g. as sensing tools or in microfluidic devices [25].
The purpose of this review is to give an overview of the existing experimental approaches and demonstrations of protein DEP in the past. The manipulation of proteins with DEP has been demonstrated in a variety of experimental realizations thus pointing towards the analytical and nanotechnological applications of protein DEP. We summarize these various methodologies and applications and relate them to theoretical models relevant to protein DEP in the last section of this review.
2. Devices to study protein DEP
Two types of devices have been used to create an inhomogeneous electric field necessary for DEP to occur: electrode-based DEP devices and insulator-based devices. In the former case, microelectrodes are integrated in a device employing microfabrication techniques. Some examples include interdigitated electrodes [20], quadruple electrode geometries [23,26] and pairs of triangular electrodes in close proximity to one another [4]. These electrode-based DEP (eDEP) techniques have been employed most commonly in the field of protein DEP. Another relatively new technique termed insulator-based DEP (iDEP) utilizes insulating constrictions integrated within the device. Only a few examples can be found for protein iDEP including sawtooth constrictions [27], insulating post arrays with various geometries [28,29] and nano-constrictions [30–32].
Figure 1 depicts eDEP and iDEP schematically as well as the typical ranges of E and ∇E2 in these devices. In case of eDEP, metal microelectrodes are fabricated with a separation distance typically within the μm range requiring the application of low potential (up to ~20V). In case of iDEP, the post geometry and dimension within a microfluidic channel greatly influence the acting field gradients. In contrast to eDEP, iDEP is mostly employed under DC condition with relatively high voltage applied. Thus, the resolution of the employed fabrication techniques limits the achievable electric fields and gradients thereof. Commonly, photolithographic techniques are used resulting in μm post sizes and distances. As shown in Figure 1, eDEP can generally create larger E and ∇E2 with only a few volts applied and thus eDEP has been the major strategy for protein DEP applications. However, these high gradients act only in the vicinity of the electrodes, which might become disadvantageous for separations in microchannels. In order to generate a comparable magnitude of E and ∇E2 with iDEP, one can improve on suitable geometries [29] or even include nm-sized constrictions [30–33]. iDEP further prevents complicated processing steps such as integrating metal electrodes in a microfluidic device and, moreover provides the non-uniform field over the entire depth of a microchannel as compared to metal electrodes shown in Figure 1(a) and (c) in eDEP. Additionally, electrode reactions interfere less with the analytes manipulated by iDEP since the electrodes are placed far away from the insulating post regions where DEP occurs. In the following section we will discuss the employed device geometries used in protein DEP studies in greater detail (see also Figure 2) together with the major experimental findings. The reader is referred to review articles more thoroughly detailing other experimental techniques used for DEP studies which have not been applied to protein DEP and are thus not further discussed here [25,34–38].
Figure 1.
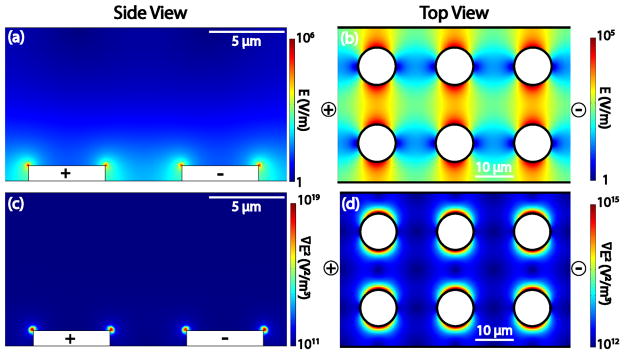
Schematic depiction of eDEP and iDEP devices. (a, c) Represent a side view for an eDEP and (b,d) a top view of an insulator-based DEP geometry. (a) Shows the electric field distribution and (c) ∇E2 values resulting within the eDEP device with 5 V applied between the metal microelectrodes. (b) shows the electric field distribution and (d) ∇E2 created by an iDEP device with the application of 500 V/cm. The black bold lines in (b) and (d) indicate the insulating walls of a microchannel and of the integrated posts. Note that the potential is usually applied via electrodes immersed in reservoirs at the end of the microchannel and only a small portion of a post array is represented here.
Figure 2.

(a–f) Schematic depiction of experimental devices used to study protein DEP. (a) Quadruple electrode geometries utilized in references [23,26] to manipulate proteins under AC conditions. Proteins are trapped due to positive DEP (top image) between the electrodes where the electric field gradient is high or negative DEP at the low electric field gradient regions (bottom image). (b) A schematic image of a nanopipette used in references [39,40]: When a negative voltage is applied to the bath electrode, negatively charged protein G is moved electrophoretically into the opposite direction of positive DEP. Thus, DEP force and electrophoretic force are balanced and proteins are trapped at the nanopipette tip. (c) A circular insulating post array as utilized by Lapizco-Encinas et al. [28]. Under DC conditions, the protein BSA is repelled from the constrictions where the electric field gradient is highest, indicating negative DEP. (d) Insulating constrictions with varying sawtooth shapes realized by Staton et al. [27]. With the application of DC voltage, Aβ fibrils are trapped at the narrow constrictions by positive DEP. (e) A nano-constriction insulating device used in references [30–32]. Under AC conditions at a frequency of 100 kHz, the protein streptavidin is trapped due to positive DEP (top image). With the application of an appropriate AC voltage as well as a DC bias, proteins are accumulated continuously due to negative DEP (bottom image). (f) A triangular insulating post array was used in references [29,45]. With the application of a DC voltage, IgG is focused in streamlines between the posts due to positive DEP (left image). Note that the flow direction is from left to right. By using tri-block copolymer F108 above the critical micelle concentration, IgG is encapsulated within micelles, resulting in protein-depleted streamlines due to negative DEP (right image). (g). Protein DEP focusing (streaming) used for a label-free protein detection sensor exhibiting high sensitivity (Ref [47]). An inhomogeneous electric field is created by planar electrodes integrated on a substrate, resulting in protein focusing in the vicinity of protein receptors. The dotted arrow shows the direction of protein transport.
3. Experimental demonstrations of protein DEP
Around 20 groups have investigated protein DEP experimentally. To provide an overview, we first classify the reported work into two categories, trapping and focusing, and give a short overview of them. This classification is used since these categories are different in terms of force balances thus one can utilize either of them for DEP protein manipulation depending on the intended purpose. Finally, we show some examples of applications pertaining to protein DEP trapping and focusing. Figure 2 and 3 schematically depict the representative device geometries discussed below and Table 2 lists both experimental DEP studies as well as applications.
Figure 3.

(a) A top view of a DEP chromatography device adapted from Washizu et al. [20] in which a pair of interdigitated electrodes is used to create an electric field gradient. The samples are supplied from the inlet at a constant flow velocity and a photomultiplier is placed near the outlet to monitor fluorescence intensity Adapted with permission from Ref [20], Copyright 1994, IEEE. (b-1) Quadruple electrodes used to pattern actin as used by Asokan et al. [50] showing actins trapped at the high electric field regions due to positive DEP at 1 MHz and 7 Vrms. Additionally DEP torques cause the orientation of actins in the direction parallel to the electric field. The scale bar of 7 μm was estimated from ref [50]. Adapted with permission from Ref [50], Copyright 2003, American Chemical Society. (b-2) a transmission electron microscopy image of the CNT with streptavidin molecules attached at the tip of CNTs as well as inside the CNT. With the application of AC voltage, proteins are selectively attached to the tip of the CNT where the electric field gradient is high due to positive DEP. Adapted with permission from Ref [52], Copyright 2008, The Japan Society of Applied Physics. (c-1,2) A label-free protein detection sensor with high sensitivity developed by Gong [47]. The top image (c-1) schematically shows a microfluidic channel cross section. Upon AC excitation, a biomarker for prostate cancer (PSA) is concentrated in the vicinity of the nanowire surface and binds to the receptors. The bottom image (c-2) shows the change in conductance over time after varying concentration of PSA was delivered to the device. The device is capable of detecting PSA with concentration as low as 10 aM. Reprinted from [47] with permission from John Wiley and Sons. (c-3,4) A design of the pathogen-sensing device shown in (c-3) fabricated by de la Rica et al. [53]. On the substrate, a pair of planar electrodes is integrated where the peptide nanotubes are aligned upon application of ac voltage due to positive DEP depicted in (c-4) Target pathogen specific antibodies are attached to the nanotubes, therefore the binding event is recognized by change in AC capacitance. Adapted from Ref [53] with permission from John Wiley and Sons. (c-5,6) SAPNT bundles (c-5) or two peptide nanotubes (c-6) were immobilized between electrodes upon application of ac voltage due to positive DEP. Adapted from ref [54] with permission from John Wiley and Sons.
3.1 Trapping
Trapping is defined as electric field-induced particle immobilization at certain regions in a microstructured device. This occurs when the DEP force overcomes other competing forces such as the electrokinetic force, thermal force, hydrodynamic force, and Brownian motion. Washizu et al. demonstrated the first molecular DEP studies using four proteins: avidin, concanavalin, chymotrypsinogen, and ribonuclease A. Using a field integrated circuit with a frequency up to 1 MHz, it was shown that accumulation of proteins started with an applied voltage of 15 V which is attributed to positive molecular DEP [20]. In contrast, Bakewell et al. demonstrated both positive and negative DEP of the same protein avidin using quadruple electrode geometries schematically shown in Figure 2(a) [23]. A crossover frequency of 9 MHz was experimentally determined. Bakewell et al. concluded that positive DEP occurs at frequencies below 9 MHz, while negative DEP prevails in a frequency range between 9 MHz and 20 MHz [23]. Using similar quadruple electrode geometries, Zheng et al. reported DEP trapping of bovine serum albumin (BSA) which was used to position BSA between the electrode gap in order to measure protein conductance [26]. Hölzel et al. used different electrode geometries, namely pairs of microelectrodes as close as 500 nm [4]. The expected value of ∇E2 reaches 1021 V2/m3 with which single R-phycoerythrin molecules would experience a DEP force of 0.1 pN according to their model. The theoretical calculations suggested that the DEP force overcomes diffusion and friction. It was further shown experimentally that R-phycoerythrin was successfully trapped due to positive DEP at the tip of the electrodes with an applied voltage of 10 V and a frequency of 0.1~5 MHz [4].
A nanopipette approach was used by Clarke et al. to demonstrate the trapping of two proteins, protein G and immunoglobulin G (IgG) [39], as schematically depicted in Figure 2(b) [39]. The tip of this nanopipette has a 100~150 nm internal diameter creating an electric field strength of 106 V/m. Using a physiological buffer to retain protein integrity, a maximum of 3000 fold protein concentration was achieved due to positive DEP with reversible protein accumulation [39]. Moreover, the same device was used to measure protein conductivity (see Ref [40] and section 4).
Furthermore, Lapizco-Encinas et al. reported the first protein trapping using an iDEP device, as schematically shown in Figure 2(c) [28]. The authors showed that BSA could be manipulated via negative DEP under DC condition within a microfluidic device containing insulating circular post arrays. The DEP response was systematically studied by varying the buffer conductivity (25~100 μS/cm) and pH (8 and 9) with an applied voltage of 700~1600 V/cm. The maximum protein concentration in the trapping region was observed using the highest conductivity buffer (100 μS/cm, pH 8) [28]. In addition, Staton et al. fabricated insulating constrictions in a single microfluidic channel with varying sawtooth shape to construct an iDEP system (see Figure 2(d)) [27]. They employed this device to study iDEP of amyloid-beta (Aβ) fibrils, which play an important role in Alzheimer disease pathogenesis. With a DC-iDEP device, they showed rapid and selective concentration of the Aβ species: while Aβ monomers exhibited streaming DEP, Aβ fibrils were captured and concentrated at the narrow constriction of the sawtooth structure demonstrating iDEP trapping [27].
Most recently Liao et al. reported iDEP devices with nm-sized constrictions fabricated by a combination of photo- and electron beam lithography as depicted in Figure 2(e) [32] and further employed in [30,31]. Numerical simulations suggested that with a 100 nm constriction device the DEP force acting on a streptadivin molecule reaches 10−10~10−11 N whereas less than 10 pN DEP force is generated with 1 μm constrictions [31]. They used a physiological buffer to maintain the protein’s conformation and functionality, which poses a challenge due to significant Joule heating. However, using a 30 nm nanoconstriction device at 200~300 Vpp/cm AC voltage and 1 MHz frequency combined with a slight DC offset, concentration of the protein streptavidin due to negative DEP at regions of low electric field strength resulted. The authors specifically selected a frequency range for negative DEP so that the protein would be trapped at the low electric field regions where a rise in temperature is less significant. With this well-designed device, they achieved a >105 fold concentration increase within 20 seconds [32].
3.2 Focusing
Unlike trapping, focused particles are not immobilized but flow as narrow or confined streams. To focus particles, DEP has to overcome Brownian diffusion whereas other bulk fluid flows such as electroosmosis overpower DEP. There are only a few groups that have investigated DEP focusing for proteins. DEP focusing can – despite the large bulk flow component – be employed as an analytical tool. For example, it has been shown that DEP focusing can be successfully employed to separate or sort cells and colloidal particles [41,42]. Moreover, DEP focusing has been demonstrated with nanoparticles by Cummings and Singh [43] and was applied to sub-micrometer bead sorting [44]. It is thus also expected that protein DEP focusing will be important for analytical applications as well as a general tool to investigate protein DEP.
Nakano et al. were the first to demonstrate DEP protein streaming by iDEP using a microfluidic device in which a tailored triangular post array was integrated (see Figure 2(f)) [29,45]. With the addition of a zwitterionic detergent to prevent protein aggregation, immunoglobulin G was manipulated and concentrated into narrow streamlines along the insulator posts under DC conditions. This result was further supported by theoretical simulations considering the case of positive DEP. Nakano et al. systematically studied the factors influencing DEP streaming by varying the medium pH and conductivity. As a result, the concentration was enriched by 70 % (a factor of 1.7) compared to the initial protein concentration due to positive DEP at the lowest medium conductivity of 100 μS/cm at pH 8 and under an applied electric field of 4200 V/cm. Moreover, they observed negative DEP employing a polyethylene glycol-based block-copolymer F108 [45]. Using this block-copolymer, the observed streaming behavior resulted in depletion in agreement with numerical simulations for the case of negative DEP. Furthermore, a dynamic light scattering study revealed the formation of micelles under the experimental conditions used. This transition in the streaming behavior leading to a change from positive to negative DEP when employing the F108 dynamic coating conditions was thus explained by F108 micelle formation [45].
Camacho-Alanis et al. improved the iDEP device used by Nakano et al. [29,45] by integrating nm-sized constrictions [33]. The photoresist master used as the mold for elastomer replication was further processed by focused ion beam milling. Hence elastomer-based devices with integrated insulator-based nanoposts or nanopost arrays could be created. These nanopost devices resulted in an increase of ∇E2 by three orders of magnitude compared to iDEP devices solely constructed of microposts. Consequently, the concentration by protein streaming DEP could be increased experimentally by a factor of 45 for the protein BSA due to positive DEP [33]. The increased protein concentration was further observed at distinct locations near the nanopost array shifted to downstream areas in the flow direction demonstrating the increased counteraction of DEP to electroosmotic flow [33].
A computational study on the DEP streaming behavior of myoglobin was presented by Gunda et al. [46]. A detailed study on the electric field distribution along an electrode-based device was provided as well as the concentration distribution of myoglobin with a convection diffusion model similar to the work of Nakano et al. [29,45]. The underlying protein DEP response was modeled for different shapes such as ellipsoids as well as a sphere according to classical DEP theory demonstrating that DEP forces overcome Brownian forces in the presented device geometry and computed electric fields. Furthermore, an electrode-based DEP device for protein streaming has been employed by Gong [47]. This is an excellent application of streaming DEP and its use in nanoelectronic devices for label-free, sensitive protein detection. This work is further detailed in the next section on applications.
3.3 Applications
3.3.1 Separations
For a successful separation of protein mixtures, forces acting on each species have to be significantly different. DEP has the potential to be applied as a separation method since DEP forces greatly depend on polarizability. Even though the theoretical framework detailing the mechanism of protein polarization and dielectrophoretic response has not been investigated for a large variety of proteins yet, current knowledge suggests a wide variety in DEP response including the occurrence of positive and negative DEP. Exploiting protein DEP has the advantage to probe a frequency dependent quantity rendering the separation process ‘tunable’. However, not only the frequency can be used to tailor DEP response, but also the magnitude of ∇E2. Microfabricated devices (either employing electrodes or using the iDEP approach) allow spatial tuning of the forces molecules experience within a separation experiment, for example along a separation channel. This can be exploited advantageously to improve resolution. Moreover, DEP response can be used as an enrichment or trapping approach prior to separation, in which particles with similar DEP properties can first be enriched before a higher resolution separation follows. This approach would also be useful for situations with low sample concentrations, such as is the case for many biomarkers. Finally, sorting or fractionation approaches are also achievable with DEP as has been demonstrated with particles and cells [8].
Washizu et al. first demonstrated the potential use of DEP for protein separation employing the technique named “DEP chromatography” [20,48]. In their device, a pair of interdigitated electrodes is mounted on a substrate as shown in Figure 3(a) and the sample mixtures are driven into the device from the inlet at a constant flow velocity. Due to an electric field gradient created by the integrated electrodes, species experiencing larger DEP force retard from others; therefore they exhibit a longer elution time as detected by changes in fluorescence intensity at the outlet. Using this device, Washizu et al. performed DEP experiments with DNA ranging from 9~48 kbp and found that 48 kbp was separated from the others. Next, they conducted a similar experiment with the protein avidin at 1 kHz and could show that the protein was trapped upon application of voltage [20]. Furthermore, Kawabata et al. used a similar DEP chromatography device to extend Washizu’s study to a larger variety of proteins and DNAs including insulin, BSA and Immunoglobulin M [48]. Even though no actual separation of the protein mixtures was performed in these two studies, they both showed that more polarizable and/or larger particles are trapped more efficiently by a DEP chromatography device. This work indicates that the development of a protein separation assay should be possible with careful device design and choice of proteins.
3.3.2 Molecular patterning and bioprobes
DEP has been used to investigate the motility of biological motor systems in the field of microelectronics where molecular motor systems such as the kinesin/microtubule system and actin/myosin system have attracted much interest due to their possible uses as microsensors and actuators [49]. Biological motor proteins as well as associated cytoskeletal motor proteins are responsible for a variety of cellular processes and functionalities including muscle contraction and segregation of chromosomes during cell division. Therefore, it is essential to understand and control the molecular motor-based motility as well as to investigate these interactions within a biological system. Asokan et al. applied DEP forces to pattern actin on a substrate using quadruple electrodes in order to investigate actin motility [50]. Upon the application of 7 Vpp AC voltage in a frequency range of 100 kHz~30 MHz, they observed positive DEP and DEP orientation torques, resulting in an alignment of actin parallel to electric field lines, as shown in Figure 3(b-1). Additionally, the numerical simulations revealed the maximum ∇E2 of 1020 V2/m3 which created DEP forces of ~0.4 pN [50].
In another application, Uppalapati et al. fabricated microelectrodes on glass substrates [51]. In a low ionic strength buffer, bundles of microtubules were collected and oriented by the application of AC voltages. The combination of DEP forces, AC electroosmosis and electrothermal forces controls particle motion in this device. By tuning the buffer conductivity and AC frequency, the apparent conductivity of taxol-stabilized microtubules was found to be 250 mS/m. Using this particle conductivity value, the maximum DEP force per unit length of microtubules was found to be 10 pN/μm at a frequency of 5 MHz [51].
DEP has also been applied in order to develop carbon nanotube (CNT) bioprobes used as a force measurement probe similar to in atomic force microscopy by Maruyama et al. [52]. CNT bioprobes could be used to investigate protein dynamics by enabling site-specific and rotational specific force measurements. Under AC DEP conditions streptavidin-quantum dot conjugates as well as streptavidin molecules were covalently attached mainly to the tip of the CNTs due to positive DEP and effectively reduced the protein attachment on the sidewall (see Figure 3(b-2)) [52].
3.3.3 Biosensors
DEP was also used to develop a label-free detection device for biomarkers with high sensitivity. Gong demonstrated a label-free attomolar detection system for prostate-specific antigen (PSA), which is considered a biomarker for prostate cancer. Gong integrated silicon nanowire field-effect transistors and planar electrodes on a sensor substrate [47]. The nanowire surface was functionalized with PSA antibodies serving as receptors. In order to increase the sensor sensitivity, AC DEP was utilized: AC electroosmosis drives proteins to the receptors and moreover, proteins are pre-concentrated in the vicinity of receptors due to positive DEP as schematically depicted in Figure 3(c-1). This transport mechanism is considered DEP streaming where a DEP component caused by AC excitation overlays with a convective electroosmotic flow [47]. The pathogen binding events to the antibodies are detected by AC conductance as shown in Figure 3(c-2). It was shown that the sensitivity of the nanowire device increased 104 fold when compared to the mere diffusion controlled device. The lowest PSA concentration detected by the nanowire device was found to be 10 aM under the application of 0.5 V AC and a frequency of 47 Hz [47]. Another example for sensing probes was demonstrated with the detection of viruses with very high sensitivity [53]. De la Rica et al. developed a peptide-nanotube sensor platform schematically depicted in Figure 3(c-3) on which peptide nanotubes are aligned between the Au electrodes due to positive DEP at 10 Hz frequency and 5 Vpp (see Figure 3(c-4)). The surface of the peptide nanotubes was coated with antibodies specifically binding to a target pathogen, so the target pathogens are selectively captured on the nanotube surface. Virus binding events on the nanotubes were detected by an AC capacitance change between the electrodes. This peptide-nanotube based sensor successfully detected a label-free herpes simplex virus type 2 (HSV-2) within 1 hour with a concentration as low as 102 plaque forming units per ml (pfu/mL) which corresponds to the number of infective virus particles [53].
Castillo et al. also studied self-assembled amyloid peptide nanotubes (SAPNT) employing DEP [54]. SAPNT is known for excellent thermal and chemical stability as well as high mechanical strength, which can be used for nanotechnological applications such as biosensors and field effect transistors. In this study, bundles (Figure 3(c-5)) or a single SAPNT (Figure 3(c-6)) were successfully manipulated and deposited on top of the micro Au electrodes due to positive DEP with an application of 10 Vpp and a frequency of 1MHz. In addition, the electrical properties of the nanotubes were studied by plotting I–V curves, which confirmed a low ohmic conductivity of SAPNT under applied potential [54].
4. Theoretical considerations on protein DEP
Proteins are polypeptides composed of amino acids forming a particular tertiary structure. A dipole arises in most proteins due to the spatial arrangements of polarizable groups originating from polarizable bonds in the polypeptide backbone. Polar and charged groups of the amino acid side chains [55] or specific motifes such as α-helices also contribute to some extent to the overall protein dipole [56,57]. Dipoles arising from the molecular composition of proteins are usually termed permanent dipoles with typical magnitudes of a few hundred Debye [57–60]. Dipolar contributions from solvent (water) and solvent-protein interactions [25] also contribute to the protein dipole moment. Moreover, the distribution of ions in the electrical double layer (EDL) characterized via the Debye layer thickness, λD, can give rise to polarization influencing protein dielectrophoretic response [24]. In contrast to contributions from the permanent dipole, the polarization in the EDL can account for a characteristic frequency dependent dielectrophoresis as earlier reported for avidin [24]. The following paragraphs thus briefly overview current models to account for the contribution of the EDL polarization as established for nanoparticle DEP and are brought into relation to the experimental work reported in the previous sections on protein DEP.
The frequency dependent DEP force for a spherical particle was described above with equation 1. For biological particles, such as cells, viruses or organelles, the theoretical framework of DEP is more complex. For example, detailed theoretical descriptions of DEP taking into account specificities of biological cell structure and substructure have been developed. Such models assign an effective cell permittivity based on shell models, i.e. spheres mimicking various membranes and compartments in form of shells. The models are well accepted and in accordance with experimental observations as summarized in excellent reviews [2,3,61] and texts [1,24]. In case of viruses, the mechanism of DEP based separation was explained by the presence of an envelope surrounding the outer surface of viruses. Those without envelope exhibit positive DEP, while the enveloped viruses show negative DEP response due to the presence of the insulating membrane reducing its polarizability. Virus DEP has been investigated experimentally [62,63] and summarized in the excellent reviews [25,36]. These models based on large cellular or virus structure are however not directly applicable to biomolecules such as DNA or proteins.
Applying classical theory such as described in Equation 1, a very small polarizability (several orders of magnitudes lower than for biological cells) is expected for a nanometer sized protein [64]. Consequently, very high field gradients are required for successful protein DEP manipulation. However, the classical theory on spheres (eq. 1) was extended by Clarke et al. in which the dielectrophoretic response of proteins was formulated assuming a globular structure and assigning an ellipsoid protein shape [40]. Their work based on DC measurements, so that the DEP force was expressed in terms of conductivities for a prolate ellipsoid [1,40]:
| eq. (3) |
where a, b and c (a>b = c) are the semi-principal axes of an ellipsoid and Z is the depolarization factor. Clarke et al. [40] presented a nanopipette method to determine the protein conductivity with their experimental set-up which provided a value of 24.6 S/m. This method provided an overall conductivity value which cannot distinguish between bulk protein conductivity and contributions from the surrounding counter ion cloud [40].
Knowing the protein conductivity allows to calculate the DEP force acting on a protein. For example, if a specific experimental set-up can achieve ∇E2 of 8×10¹⁷ V2/m3, one can expect a DEP force of ~0.4 fN (based on typical molecular extensions for an immunoglobulin molecule (5 nm × 2.5 nm × 2.5 nm) with a medium conductivity of 0.01 S/m, see Nakano et al. [29] for details.) In another example, a pair of sharp nanoelectrodes with small separation distance fabricated by Hölzel et al. created ∇E2 of over 1021 V2/m3, resulting in Fdep larger than 0.1 pN per molecule estimated by using the classical theory [4]. A similar amount of DEP force with a maximum of 0.1 pN was also calculated by Liao et al. using a nano-constriction device while creating large ∇E2 [30,31]. They demonstrated that Fdep overcomes other forces including particle diffusion, thermal forces as well as electrophoretic forces. This classical approach might be over-simplified and does not account for detailed protein structure, solvent interactions or EDL polarization. Its application however allows comparisons with other acting forces and differences arising due to the variations in experimental methods.
In order to account for the complexity of protein dielectrophoresis, polarization effects in the EDL should play an important role influencing the dielectrophoretic behavior of proteins [24]. Thus, the DEP response should deviate from the classical cell and particle models. In analogy, it has been experimentally evidenced that submicrometer particles with EDL thickness comparable to the particle diameter show different dielectrophoretic behavior than similar micron-sized particles [65]. Polarization and induced dipoles due to the EDL surrounding a nm-sized particle should thus also to play an important role in dielectrophoretic behavior of proteins. Two major mechanisms are considered to contribute to the EDL polarization. The first contribution is attributed to ionic currents caused by ion migration and convection within the EDL. In addition, the electrophoretic motion of the particle modifies the ion distribution around it, leading to changes in the induced dipole moment [66]. The classical Maxwell-Wagner-O’Konski (MWO) model accounts for ion migration and convection with a surface conductivity [67]. In the MWO theory, the particle conductivity σp is given as:
| eq. (4) |
where σb is the particle’s bulk conductivity for a particle with radius r and Ks denotes the surface conductance [67]. This concept including ion migration and convection creates ion concentration gradients, thus the resulting mass transport due to ion diffusion changes the strength of the dipole moment. At low frequency, this ion diffusion counteracts the ion migration and the dipole moment decreases. Therefore, the MWO model only holds at high frequency where ion diffusion ceases [15,68]. To account for ion diffusion at low frequency, Dukhin and Shilov developed a model with the assumption that the EDL is at local equilibrium with the bulk solution [69–71] known as the Dukhin-Shilov theory. Since both the MWO and Dukhin-Shilov theory are restricted to particles with thin EDL, Ermolina and Morgan extended the MWO theory [72] and considered the effective surface conductance as the sum of the Stern layer and the diffuse layer conductance. This extended MWO theory fits DEP response of the larger particles (>100 nm), but seems to fail for smaller particle dimensions when λD ≫ r and for increasing medium conductivity [65].
These models can be brought into relation to observed frequency dependent protein DEP. Most studies with proteins have demonstrated positive DEP typically up to the MHz range [4,23,24,26,30] and some found a transition to negative DEP associated with a crossover frequency in the MHz range [23,24,30,32]. For example, Bakewell et al. [23] reported on a crossover frequency at 9 MHz. Similarly, Liao et al. [30,32] found negative DEP to appear above 1 MHz frequency for streptavidin, although at a conductivity elevated by several orders of magnitude as compared to the work with avidin. Moreover, Hughes [24] showed that the changes in crossover frequency of avidin in dependence on conductivity can be fitted with a MWO model assuming negligible internal conductivity and a surface conductance in the pS range. In the high frequency range (MHz), a reasonable agreement can be found with the MWO theories for this protein.
Most experimental protein DEP studies were performed at low conductivity (a few mM in salt concentration or even below), thus situations dominate in which λD is larger than the protein radius. While the low conductivity studies suggest that MWO models suffice to explain the high frequency behavior [24], variations in the protein bulk conductivity and situations under physiological conditions are less studied. For physiological conditions, ionic strengths are considerably higher and the double layer thickness becomes comparable to the protein radius. Basuray and Chang [73,74] proposed another modified MWO theory by accounting for a normal current component in the diffuse layer as well as the classical tangential current. Their model extends to situations where the radius of the particle is comparable to the thickness of the Debye layer. The normal component of the ion migration within the diffuse layer was assumed to lead to ion adsorption on the Stern layer at the particle poles, thus inducing capacitive properties in the EDL which influence the polarization. Interestingly, the induced dipole moment results in one order of magnitude larger than predicted by the classical MWO theory [73]. This larger induced dipole moment has important experimental implication, as smaller electric field gradients could be used for protein DEP manipulations. Experimentally, indeed DEP of proteins was achieved in devices exhibiting electric field gradients not significantly differing to those manipulating large DNA molecules [18,29].
Recently, another theoretical approach was presented by Zhao and Bau accounting for ion migration, convection, diffusion in the EDL as well as the electrophoretic particle motion based on Poisson-Nernst-Plank equations [15,16]. Their results demonstrated a major contribution of the polarization attributed to the total dipole moment due to the electrophoretic motion within the thick EDL, which is significantly larger than the particle radius [16]. This model could predict the DEP mobility of large DNA adequately at low frequency [13], but was not extended to proteins yet. This model indicates that a more complex mechanism as accounted for in the MWO theories is necessary to describe biomolecule DEP (here DNA) and will most likely also be needed to fully describe frequency dependent protein DEP response.
The proposed polarization models for nm-sized colloids show the complexity influencing polarization of similarly sized proteins. The EDL polarization might additionally be influenced by changes in the charge state of proteins in varying buffer solutions, conformational changes occurring in solutions of varying pH and ionic strength or interactions with buffer additives such as surfactants. For example, given the majority of the contribution to the dipole moment from the electrophoretic motion proposed by Zhao et al. [15,16], pH dependence on the strength of the dipole moment seems plausible since the protein charge state is modified by the surrounding medium pH. Experimentally, a pH dependent dielectrophoretic behavior has been reported by two groups [24,45]. Nakano et al. reported the increase in concentration due to positive DEP with pH and the optimized concentration at pH 8 using immunoglobulin G with an isoelectric point (pI) of ~5 [45]. Although the authors hypothesized that the increased electrophoretic force caused by variations in pH counteracts the DEP force under the DC condition, the aforementioned change in polarization due to electrophoretic motion could account for the reported pH dependence as well. In another example, dielectrophoretic response of avidin with a pI of 10 was investigated as a function of medium pH [24]. Hughes found a decline in crossover frequency as the pH approaches the pI of the protein within a range of pH 6–10 [24] and argued that variations in protein charge due to their amphiprotic nature influence the surface conductance upon pH variations [24]. The influence of the medium conductivity on a protein’s dielectrophoretic response has also been investigated using an electrode-based DEP setting [24]. A similar qualitative dependency was shown as previously reported for nanoparticles (discussed above) indicating a minor contribution of the protein bulk or internal conductivity at high frequencies. In addition, several studies have been performed using insulator-based DEP investigating conductivity dependent DEP pre-concentration [28,29,45]. Generally, relationships follow what is expected according to the Clausius-Mossotti factor (see eq. 3), when varying the medium conductivity in DC iDEP. Conclusions on the influence of the EDL and surface conductance changes are however more difficult to draw with an iDEP approach.
A more complex relationship than developed for nanoparticles seems likely to be necessary to describe protein DEP, which should strongly depend on protein type and surrounding electrolyte. Unfortunately, there is currently no comprehensive study including a variety of proteins and experimental conditions to elaborate the mechanism of protein DEP in more detail. The experimental conditions as well as experimental setups studying protein DEP further differ significantly, making it difficult to draw generally applicable conclusions from these studies. In most cases, positive DEP prevails up to the MHz range in accordance with most theoretical models discussed above. As detailed above, several studies demonstrated the occurrence of the crossover frequency at around 106~107 Hz for avidin [23,24] and streptavidin [30,32]. These two proteins are very similar in molecular weight, amino acid composition as well as biological function and the findings may not be generally applicable. Positive DEP was also observed using IgG and BSA under DC conditions which coincides with the DEP response at low frequency [29,45]. However, negative DEP using BSA was also observed under DC conditions [28], which might be related to variations in surrounding buffer conditions as well as experimental setups. Furthermore, in case of proteins, aggregation and agglomeration can significantly influence DEP as previous studies demonstrated [20,29]. The actual trapping forces and polarizabilities for aggregates are expected to differ from those of protein monomers and thus care has to be applied to reduce aggregation, for example by addition of the zwitterionic detergent to the experimental buffer [29,45]. To exclude aggregation, additional methods can be employed such as used in the study by Hölzel et al. with fluorescence correlation spectroscopy which was used to clarify the presence of monomeric species of R-phycoerythrin in their single molecule DEP traps [4].
We finally note that a detailed analysis and theoretical model of frequency dependent protein dipolar response was recently reported by Matyushov [75,76]. In his work, Matyushov predicted a complex dipolar behavior taking into account intrinsic protein polarization, protein-water and long-range solvent polarization employing MD simulations for selected proteins. Matyushov predicted negative DEP to occur for the protein ubiquitin over a large frequency range [75,76] while positive DEP was predicted for charged proteins such as cytochrome B and lysozyme [75] in the MHz to GHz range. These results are interesting as they account for intrinsic DEP characteristics of proteins, which could be exploited for their guided manipulation.
We conclude that the dipolar response of proteins is complex and that equation 1 and 3 oversimplify protein polarization. Current models including details on the effects contributing to polarization in the EDL for nanoparticles should be more appropriate to estimate DEP forces exerted on proteins. However, such models based on non-conducting particles do not take into structural influences of proteins on DEP or influences on the polarization due to the amphoteric nature of proteins. Theoretical frameworks such as the one developed by Matyushov [75,76] need to be extended to a larger pool of proteins to reveal scaling laws and more detailed predictions for DEP response. It is further necessary to relate the experimental investigations to the existing models in more detail. Future frequency dependent DEP studies on a larger variety of proteins should thus allow to confirm the theoretically predicted
5. Summarizing Remarks
In this manuscript, we summarized the current experimental realizations to study protein DEP together with current applications. Further, a brief overview of experimental and theoretical techniques to reveal protein dielectrophoretic behavior was given. It seems clear that the field of protein DEP is still in its infancy. As table 1 summarizes, the experimental studies comprise less than 20 different proteins including proteins with well defined characteristics such as avidin and steptavidin. Hence, the experimental methods existing to study protein dielectrophoretic behavior have to be further refined. Furthermore, theoretical models and tools predicting the dielectrophoretic behavior of proteins should be further advanced including the molecular composition of proteins to allow the experimentalists to improve existing approaches for applications. Nonetheless, the experimental community has developed devices for protein manipulation. Novel analytical applications of protein DEP are to be expected due to the variety of applications demonstrated with nanoparticles and cells. Hence, we expect a variety of interesting applications based on protein DEP related to separation, fractionation and concentration to become available in the future. This field will be even more successful, if the link between theoretical predictions and protein DEP behavior can be further extended.
Table 1.
Fundamental studies and applications of peptide and protein DEP.
| Type of DEP | Devices | References | Proteins used | |
|---|---|---|---|---|
|
Fundamental
Studies
| ||||
| Trapping | Electrode EDP | Interdigitated electrodes | Washizu et al. (ref [20]) | Avidin, concanavalin, chymotrypsinogen and ribonuclease A |
| Multipole electrodes | Bakewell et al. (ref [23]) | Avidin | ||
| Zheng et al. (ref [26]) | BSA | |||
| Asokan et al. (ref [50]) | Actin | |||
| Nanopipette | Clarke et al. (ref [39,40]) | Yellow fluorescence protein Protein G IgG |
||
| Planar electrodes | Hölzel et al. (ref [4]), | R-phycoerythrin | ||
| Castillo et al. (ref [54]) | Amyloid peptide nanotubes | |||
| Uppalapati et al. (ref [51]) | Microtubules | |||
| Others | Maruyama et al. (ref [52]) | Streptavidin | ||
| Kawabata et al. (ref [48]) | Insulin, BSA, and IgM | |||
| Hübner et al. (ref [77]) | Albumin | |||
| Insulator-based DEP | Nanoconstrictions | Liao et al. (ref [30–32]) | Streptavidin | |
| Post arrays | Lapizco-Encinas et al. (ref [28]) | BSA | ||
| Sawtooth | Staton et al. (ref [27]) | Aβ amyloid | ||
|
| ||||
| Focusing | Electrode DEP | Planar electrodes | Gong (ref [47]) | Prostate-specific antigen (PSA) |
| Insulator-based DEP | Post arrays | Nakano et al. (ref [29,45]) | IgG, BSA | |
| Nanostructures | Camacho-Alanis et al. (ref [33]) | BSA | ||
|
| ||||
| Applications | ||||
|
| ||||
| Separations | Electrode DEP | Interdigitated electrodes | Washizu et al. (ref [20]) | Avidin |
| Electrode arrays | Kawabata et al. (ref [48]) | Insulin, BSA, and IgM | ||
| Molecular patterning | Electrode DEP | Planar electrodes | Washizu et al. (ref [20]) | Avidin |
| Multipole electrodes | Asokan et al. (ref [50]) | Actin | ||
| Bioprobes | Carbon nanotube (CNT) tip | Maruyama et al. (ref [52]) | Streptavidin | |
| Biosensors | Electrode DEP | Planar electrodes | Gong (ref [47]), | PSA |
| de la Rica et al. (ref [53]) | Peptide nanotubes | |||
| Castillo et al. (ref [54]) | Amyloid peptide nanotubes | |||
(Note that a few publications are listed twice to emphasize on their fundamental as well as applied content.)
Acknowledgments
The authors thank financial support by grants from the National Center for Research Resources (5R21RR025826-03) and the National Institute of General Medical Sciences (8R21GM103522-03) from the National Institutes of Health.
Abbreviations
- pDEP
positive dielectrophoresis
- eDEP
electrode based dielectrophoresis
- Aβ
amyloid-beta
- HSV-2
herpes simplex virus type 2
- EDL
electrical double layer
- MWO
Maxwell-Wagner-O’Konski
- nDEP
negative dielectrophoresis
- iDEP
insulator based dielectrophoresis
- CNT
carbon nanotube
- SAPNT
self-assembled amyloid peptide nanotubes
- PSA
Prostate-specific antigen
Footnotes
The authors declare no conflict of interest.
References
- 1.Jones TB. Electromechanics of Particles. Cambridge University Press; Cambridge: 2005. [Google Scholar]
- 2.Pethig R. Biomicrofluidics. 2010;4:022811(1)–022811(35). [Google Scholar]
- 3.Gagnon ZR. Electrophoresis. 2011;32:2466–2487. doi: 10.1002/elps.201100060. [DOI] [PubMed] [Google Scholar]
- 4.Hölzel R, Calander N, Chiragwandi Z, Willander M, Bier FF. Phys Rev Lett. 2005;95:128102(1)–128102(4). doi: 10.1103/PhysRevLett.95.128102. [DOI] [PubMed] [Google Scholar]
- 5.Koh SJ. Nanoscale Res Lett. 2007;2:519–545. doi: 10.1007/s11671-007-9091-3. [DOI] [PMC free article] [PubMed] [Google Scholar]
- 6.Pommer MS, Zhang Y, Keerthi N, Chen D, Thomson JA, Meinhart CD, Soh HT. Electrophoresis. 2008;29:1213–1218. doi: 10.1002/elps.200700607. [DOI] [PubMed] [Google Scholar]
- 7.Li H, Bashir R. Sensor Actuat B-Chem. 2002;86:215–221. [Google Scholar]
- 8.Wang XB, Yang J, Huang Y, Vykoukal J, Becker FF, Gascoyne PRC. Anal Chem. 2000;72:832–839. doi: 10.1021/ac990922o. [DOI] [PMC free article] [PubMed] [Google Scholar]
- 9.Yang J, Huang Y, Wang X, Wang XB, Becker FF, Gascoyne PRC. Biophys J. 1999;76:3307–3314. doi: 10.1016/S0006-3495(99)77483-7. [DOI] [PMC free article] [PubMed] [Google Scholar]
- 10.Yang J, Huang Y, Wang XB, Becker FF, Gascoyne PRC. Biophys J. 2000;78:2680–2689. doi: 10.1016/S0006-3495(00)76812-3. [DOI] [PMC free article] [PubMed] [Google Scholar]
- 11.Voldman J, Gray ML, Toner M, Schmidt MA. Anal Chem. 2002;74:3984–3990. doi: 10.1021/ac0256235. [DOI] [PubMed] [Google Scholar]
- 12.Albrecht DR, Underhill GH, Wassermann TB, Sah RL, Bhatia SN. Nat Methods. 2006;3:369–375. doi: 10.1038/nmeth873. [DOI] [PubMed] [Google Scholar]
- 13.Zhao H. Phys Rev E. 2011;84:021910(1)–021910(6). [Google Scholar]
- 14.Henning A, Bier FF, Hölzel R. Biomicrofluidics. 2010;4:022803(1)–022803(9). doi: 10.1063/1.3430550. [DOI] [PMC free article] [PubMed] [Google Scholar]
- 15.Zhao H. Electrophoresis. 2011;32:2232–2244. doi: 10.1002/elps.201100035. [DOI] [PubMed] [Google Scholar]
- 16.Zhao H, Bau HH. J Colloid Interf Sci. 2009;333:663–671. doi: 10.1016/j.jcis.2009.01.056. [DOI] [PubMed] [Google Scholar]
- 17.Regtmeier J, Duong TT, Eichhorn R, Anselmetti D, Ros A. Anal Chem. 2007;79:3925–3932. doi: 10.1021/ac062431r. [DOI] [PubMed] [Google Scholar]
- 18.Regtmeier J, Eichhorn R, Bogunovic L, Ros A, Anselmetti D. Anal Chem. 2010;82:7141–7149. doi: 10.1021/ac1005475. [DOI] [PubMed] [Google Scholar]
- 19.Huang LR, Tegenfeldt JO, Kraeft JJ, Sturm JC, Austin RH, Cox EC. Nat Biotech. 2002;20:1048–1051. doi: 10.1038/nbt733. [DOI] [PubMed] [Google Scholar]
- 20.Washizu M, Suzuki S, Kurosawa O, Nishizaka T, Shinohara T. IEEE Trans Ind Appl. 1994;30:835–843. [Google Scholar]
- 21.Beech JP, Jönsson P, Tegenfeldt JO. Lab Chip. 2009;9:2698–2706. doi: 10.1039/b823275j. [DOI] [PubMed] [Google Scholar]
- 22.Swami N, Chou CF, Ramamurthy V, Chaurey V. Lab Chip. 2009;9:3212–3220. doi: 10.1039/b910598k. [DOI] [PubMed] [Google Scholar]
- 23.Bakewell DJG, Hughes MP, Milner JJ, Morgan H. Ann Int IEEE Embs. 1998:1079–1082. [Google Scholar]
- 24.Hughes MP. Nanoelectromechanics in Engineering and Biology. 1. CRC Press; Boca Raton: 2002. [Google Scholar]
- 25.Lapizco-Encinas BH, Rito-Palomares M. Electrophoresis. 2007;28:4521–4538. doi: 10.1002/elps.200700303. [DOI] [PubMed] [Google Scholar]
- 26.Zheng L, Brody JP, Burke PJ. Biosens Bioelectron. 2004;20:606–619. doi: 10.1016/j.bios.2004.03.029. [DOI] [PubMed] [Google Scholar]
- 27.Staton SJR, Jones PV, Ku G, Gilman SD, Kheterpal I, Hayes MA. Analyst. 2012;137:3227–3229. doi: 10.1039/c2an35138b. [DOI] [PubMed] [Google Scholar]
- 28.Lapizco-Encinas BH, Ozuna-Chacón S, Rito-Palomares M. J Chromatogr A. 2008;1206:45–51. doi: 10.1016/j.chroma.2008.05.077. [DOI] [PubMed] [Google Scholar]
- 29.Nakano A, Chao TC, Camacho-Alanis F, Ros A. Electrophoresis. 2011;32:2314–2322. doi: 10.1002/elps.201100037. [DOI] [PMC free article] [PubMed] [Google Scholar]
- 30.Liao KT, Tsegaye M, Chaurey V, Chou CF, Swami NS. Electrophoresis. 2012;33:1958–1966. doi: 10.1002/elps.201100707. [DOI] [PubMed] [Google Scholar]
- 31.Liao K-T, Chaurey V, Tsegaye M, Chou C-F, Swami NS. Proceeding of μTAS; 2011; Seattle, WA. 2011. [Google Scholar]
- 32.Liao KT, Chou CF. J Am Chem Soc. 2012;134:8742–8745. doi: 10.1021/ja3016523. [DOI] [PubMed] [Google Scholar]
- 33.Camacho-Alanis F, Gan L, Ros A. Sensor Actuat B-chem. 2012;173:668–675. doi: 10.1016/j.snb.2012.07.080. [DOI] [PMC free article] [PubMed] [Google Scholar]
- 34.Martinez-Duarte R. Electrophoresis. 2012;33:3110–3132. doi: 10.1002/elps.201200242. [DOI] [PubMed] [Google Scholar]
- 35.Hughes MP. Electrophoresis. 2002;23:2569–2582. doi: 10.1002/1522-2683(200208)23:16<2569::AID-ELPS2569>3.0.CO;2-M. [DOI] [PubMed] [Google Scholar]
- 36.Zhang C, Khoshmanesh K, Mitchell A, Kalantar-zadeh K. Anal Bioanal Chem. 2010;396:401–420. doi: 10.1007/s00216-009-2922-6. [DOI] [PubMed] [Google Scholar]
- 37.Meighan MM, Staton SJR, Hayes MA. Electrophoresis. 2009;30:852–865. doi: 10.1002/elps.200800614. [DOI] [PubMed] [Google Scholar]
- 38.Srivastava SK, Gencoglu A, Minerick AR. Anal Bioanal Chem. 2011;399:301–321. doi: 10.1007/s00216-010-4222-6. [DOI] [PubMed] [Google Scholar]
- 39.Clarke RW, White SS, Zhou D, Ying L, Klenerman D. Angew Chem. 2005;117:3813–3816. doi: 10.1002/anie.200500196. [DOI] [PubMed] [Google Scholar]
- 40.Clarke RW, Piper JD, Ying L, Klenerman D. Phys Rev Lett. 2007;98:198102(1)–198102(4). doi: 10.1103/PhysRevLett.98.198102. [DOI] [PubMed] [Google Scholar]
- 41.Kang KH, Kang Y, Xuan X, Li D. Electrophoresis. 2006;27:694–702. doi: 10.1002/elps.200500558. [DOI] [PubMed] [Google Scholar]
- 42.Kang Y, Li D, Kalams SA, Eid JE. Biomed Microdevices. 2008;10:243–249. doi: 10.1007/s10544-007-9130-y. [DOI] [PubMed] [Google Scholar]
- 43.Cummings EB, Singh AK. Anal Chem. 2003;75:4724–4731. doi: 10.1021/ac0340612. [DOI] [PubMed] [Google Scholar]
- 44.Abdallah B, Chao T-C, Fromme P, Ros A. Proceeding of μTAS; 2012; Okinawa, Japan. 2012. [Google Scholar]
- 45.Nakano A, Camacho-Alanis F, Chao TC, Ros A. Biomicrofluidics. 2012;6:034108(1)–034108(13). doi: 10.1063/1.4742695. [DOI] [PMC free article] [PubMed] [Google Scholar]
- 46.Gunda NSK, Mitra SK. Biomicrofluidics. 2010;4:014105(1)–014105(20). doi: 10.1063/1.3339773. [DOI] [PMC free article] [PubMed] [Google Scholar]
- 47.Gong JR. Small. 2010;6:967–973. doi: 10.1002/smll.200902132. [DOI] [PubMed] [Google Scholar]
- 48.Kawabata T, Washizu M. IEEE Trans Ind Appl. 2001;37:1625–1633. [Google Scholar]
- 49.van den Heuvel MGL, Dekker C. Science. 2007;317:333–336. doi: 10.1126/science.1139570. [DOI] [PubMed] [Google Scholar]
- 50.Asokan SB, Jawerth L, Carroll RL, Cheney RE, Washburn S, Superfine R. Nano Lett. 2003;3:431–437. [Google Scholar]
- 51.Uppalapati M, Huang YM, Jackson TN, Hancock WO. Small. 2008;4:1371–1381. doi: 10.1002/smll.200701088. [DOI] [PubMed] [Google Scholar]
- 52.Maruyama H, Nakayama Y. Appl Phys Express. 2008;1:124001(1)–124001(3). [Google Scholar]
- 53.de la Rica R, Mendoza E, Lechuga LM, Matsui H. Angew Chem Int, Edit. 2008;47:9752–9755. doi: 10.1002/anie.200804299. [DOI] [PMC free article] [PubMed] [Google Scholar]
- 54.Castillo J, Tanzi S, Dimaki M, Svendsen W. Electrophoresis. 2008;29:5026–5032. doi: 10.1002/elps.200800260. [DOI] [PubMed] [Google Scholar]
- 55.Pethig R. Dielectric and Electronic Properties of Biological Materials. Wiley; New York: 1979. [Google Scholar]
- 56.Antosiewicz J, Porschke D. Biochemistry. 1989;28:10072–10078. doi: 10.1021/bi00452a029. [DOI] [PubMed] [Google Scholar]
- 57.Antosiewicz J. Biophys J. 1995;69:1344–1354. doi: 10.1016/S0006-3495(95)80001-9. [DOI] [PMC free article] [PubMed] [Google Scholar]
- 58.Oleinikova A, Sasisanker P, Weingärtner H. J Phys Chem B. 2004;108:8467–8474. [Google Scholar]
- 59.Takashima S. J Non-cryst Solids. 2002;305:303–310. [Google Scholar]
- 60.Sasisanker P, Oleinikova A, Weingärtner H, Ravindra R, Winter R. Phys Chem Chem Phys. 2004;6:1899–1905. [Google Scholar]
- 61.Voldman J. Annu Rev Biomed Eng. 2006;8:425–454. doi: 10.1146/annurev.bioeng.8.061505.095739. [DOI] [PubMed] [Google Scholar]
- 62.Green N, Morgan H, Milner JJ. J Biochem Bioph Meth. 1997;35:89–102. doi: 10.1016/s0165-022x(97)00033-x. [DOI] [PubMed] [Google Scholar]
- 63.Morgan H, Hughes MP, Green NG. Biophys J. 1999;77:516–525. doi: 10.1016/S0006-3495(99)76908-0. [DOI] [PMC free article] [PubMed] [Google Scholar]
- 64.Regtmeier J, Eichhorn R, Viefhues M, Bogunovic L, Anselmetti D. Electrophoresis. 2011;32:2253–2273. doi: 10.1002/elps.201100055. [DOI] [PubMed] [Google Scholar]
- 65.Green NG, Morgan H. J Phys Chem B. 1999;103:41–50. [Google Scholar]
- 66.Dukhin SS. Adv Colloid Interfac. 1993;44:1–134. [Google Scholar]
- 67.O’Konski CT. J Phys Chem. 1960;64:605–619. [Google Scholar]
- 68.O’Brien R. J Colloid Interf Sci. 1986;113:81–93. [Google Scholar]
- 69.Derjaguin BV, Dukhin SS, Shilov VN. Adv Colloid Interfac. 1980;13:141–152. [Google Scholar]
- 70.Dukhin SS, Shilov VN. Adv Colloid Interfac. 1980;13:153–195. [Google Scholar]
- 71.Lyklema J, Dukhin SS, Shilov VN. J Electroanal Chem Interf Electrochem. 1983;143:1–21. [Google Scholar]
- 72.Ermolina I, Morgan H. J Colloid Interf Sci. 2005;285:419–428. doi: 10.1016/j.jcis.2004.11.003. [DOI] [PubMed] [Google Scholar]
- 73.Basuray S, Chang HC. Phys Rev E. 2007;75:060501(1)–060501(4). doi: 10.1103/PhysRevE.75.060501. [DOI] [PubMed] [Google Scholar]
- 74.Basuray S, Wei HH, Chang HC. Biomicrofluidics. 2010;4:022801(1)–022801(7). doi: 10.1063/1.3455720. [DOI] [PMC free article] [PubMed] [Google Scholar]
- 75.Matyushov DV. J Chem Phys. 2012;136:085102(1)–085102(15). doi: 10.1063/1.3688229. [DOI] [PubMed] [Google Scholar]
- 76.Matyushov DV. J Phys-Condens Mat. 2012;24:325105(1)–325105(8). doi: 10.1088/0953-8984/24/32/325105. [DOI] [PubMed] [Google Scholar]
- 77.Hübner Y, Hoettges KF, McDonnell MB, Carter MJ, Hughes MP. Int J Nanomed. 2007;2:427–431. [PMC free article] [PubMed] [Google Scholar]