Abstract
Magnetic Particle Imaging (MPI) is a promising tracer imaging modality that employs a kidney-safe contrast agent and does not use ionizing radiation. MPI already shows high contrast and sensitivity in small animal imaging, with great potential for many clinical applications, including angiography, cancer detection, inflammation imaging, and treatment monitoring. Currently, almost all clinically relevant imaging techniques can be modeled as systems with linearity and shift invariance (LSI), characteristics crucial for quantification and diagnostic utility. In theory, MPI has been proven to be LSI. However, in practice, high-pass filters designed to remove unavoidable direct feedthrough interference also remove information crucial to ensuring LSI in MPI scans. In this work, we present a complete theoretical and experimental description of the image artifacts from filtering. We then propose and validate a robust algorithm to completely restore the lost information for the x-space MPI method. We provide the theoretical, simulated, and experimental proof that our algorithm indeed restores the LSI properties of MPI.
Keywords: Magnetic Particle Imaging, linearity and shift invariance, interference, direct feedthrough, filtering, DC recovery, angiography
I. Introduction
Magnetic Particle Imaging (MPI) [1] is a promising tracer imaging modality that is completely non-invasive and employs a kidney-safe contrast agent, already showing high contrast and high sensitivity in small animal imaging [2]. The technique exploits the nonlinear magnetization response of superparamagnetic iron oxide (SPIO) nanoparticles to time-varying magnetic fields. Hence, for medical imaging, MPI only detects a signal from the SPIO tracers and not from biological tissue. Moreover, since tissue is completely transparent to magnetic fields, there is no attenuation of the MPI signal with depth. Thus, the physics of MPI is ideally suited for tracer imaging in clinical applications such as angiography, cancer imaging, inflammation imaging, and in vivo stem cell therapy tracking. MPI contrast agents, notably SPIO nanoparticles, have been shown to be much safer for patients with chronic kidney disease [3], [4], [5] than currently available tracers (iodine and gadolinium) used in planar X-ray imaging, X-ray computed tomography (CT), and magnetic resonance imaging (MRI) [6], [7], [8].
Almost all clinically relevant imaging techniques – including ultrasound, CT, nuclear medicine, and MRI – can be modeled as Linear and Shift-Invariant (LSI) systems [9]. LSI systems guarantee that the image pixel intensity is linearly proportional to the amount of tracer located at that pixel, and that the imaging system’s blur is independent of the spatial location of the input (shift invariance). LSI is an indispensable quality for quantitative medical diagnosis. For example, because X-ray CT is LSI, the reconstructed CT image of tissue attenuation coefficient maps can provide reliable and quantitative lumen diameters for cardiovascular diagnosis. Similarly, MRI is LSI and therefore can provide quantitative estimates of tumor volume for cancer diagnosis.
In MPI, a selection field, which is a strong magnetic field gradient (typically stronger than 2.5 T/m), produces a localized region where the static magnetic field is zero (known as the field free point or FFP). We then apply a homogeneous oscillating magnetic field, called a drive or excitation field, that rapidly translates the instantaneous FFP across the field of view (FOV) in a scanning sequence. Currently, all MPI systems translate the FFP using a sinusoidal waveform. When the FFP passes over a SPIO particle, the particle’s magnetization is flipped in space, inducing a voltage signal in a receive coil. This signal is rich in harmonics of the excitation field frequency due to the nonlinear response of the magnetic nanoparticles.
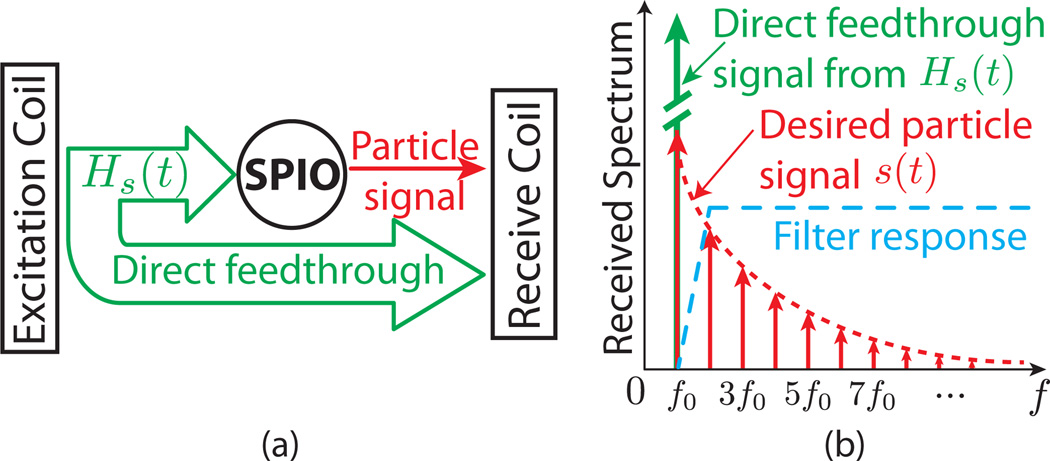
One crucial practical consideration in MPI is the effect of suppressing direct feedthrough interference, an unavoidable phenomenon in current MPI techniques. Because the excitation and signal reception occur simultaneously in MPI, significant direct feedthrough interference is induced in the receive coil by the excitation field at its fundamental excitation frequency (Fig. 1). To reject this direct feedthrough interference, nearly all MPI scanners rely on high-pass filters, which pass only higher-order harmonic frequency signals to the pre-amplifier and A/D converter. Of course, these high-pass filters also unavoidably remove the nanoparticle response’s first harmonic information. The impact of the loss of first harmonic information has never been fully analyzed in MPI.
Figure 1.
Simultaneous excitation and reception in MPI leads to direct feedthrough interference, which contaminates the received signal at the fundamental drive frequency. Aggressive filtering removes the direct feedthrough interference, however it also removes part of the nanoparticle signal. It is necessary to recover the lost signal to enable artifact-free MPI images. (a) Simplified block diagram of the MPI system. Excitation and reception occur simultaneously. (b) Frequency spectrum of the signal detected in the receive coil. Sinusoidal excitation leads to harmonics in the nanoparticle signal spectrum. A high-pass filter is applied to remove the fundamental feedthrough signal.
Currently, there are two methods to reconstruct the MPI image from the received, high-pass filtered, MPI signal: the system function method [10], [11] and the x-space method [12], [13]. The system function method employs a large system matrix that describes the spatial dependence of signal harmonics from a point source input for every pixel within the imaging bore. This large matrix is estimated either by acquiring a time-consuming calibration scan of experimental impulse responses at every desired location [11] or through a full Langevin nanoparticle model simulation [10]. System function reconstruction typically involves inverting the system matrix estimate, which may require regularization to deal with poor conditioning. The matrix inversion process can be computationally intense, and if deconvolution is employed, it can amplify noise in the image [14]. Moreover, the system matrix estimate is often acquired from nanoparticles in water, which may not match the viscosity of blood, a thixotropic fluid [15]. Further, blood viscosity is known to decrease by about 35% [16] from larger vessels (0.5 mm in diameter) to capillaries (40 microns in diameter) due to the Fåhræus–Lindqvist effect. Such modeling errors could create image reconstruction artifacts in the system matrix method when applied in vivo.
The x-space method does not rely on an estimate of the system matrix, but instead reconstructs the MPI image using only the instantaneous MPI signal and FFP velocity through space. As a result, the x-space image reconstruction algorithm is computationally fast and well-conditioned, and reconstructs the native undeconvolved MPI image, whose resolution is defined only by the strength of the magnetic field gradient and the magnetic properties of the nanoparticle tracer.
The MPI x-space analysis relies on three assumptions:
Uniqueness: the instantaneous position of the FFP in the bore is unique at all times. This is always valid given the modest (e.g., 10%) homogeneity specifications of the FFP magnet and the excitation magnets.
Adiabaticity: the nanoparticles respond adiabatically (i.e., instantaneously) to the applied magnetic field. This is not always valid, as analyzed by Weizenecker et al. [17], Reeves et al. [18], Goodwill et al. [19], Croft et al. [20], and Ferguson et al. [21].
Complete MPI Signal Recoverability: the x-space reconstruction requires the complete MPI signal, including the lost first harmonic information. Hence, x-space reconstruction requires that the lost first harmonic information is recoverable via robust methods.
The practical implications of the assumption that the lost first harmonic information is fully recoverable have never been analyzed. Here, we prove for the first time that the lost first harmonic information corresponds to offsets of the constant (or DC) component of the MPI image. We propose a robust algorithm to restore the lost DC information in conjunction with x-space MPI. Finally, we provide the first theory, simulation and experimental evidence that our proposed algorithm does indeed restore the LSI properties of the MPI images. This DC recovery method may also improve system function method, since the loss of DC information is common to all MPI methods.
II. Theory
In this section, we prove that the direct feedthrough filtering in MPI causes a loss of a constant (or DC) information in an unmodified x-space reconstruction. This insight informs the robust and fast algorithm that we propose below to restore this lost DC information.
A. 1D X-space Theory: Brief Review
MPI requires a strong magnetic field gradient for spatial encoding and selectively saturating the sample at all locations except near the FFP. Applying a strong magnetic gradient −μ0G [T/m] across the sample, the particles within the sample experience a magnetic gradient field
| (1) |
To elicit a nanoparticle signal, we apply a spatially homogenous and temporally sinusoidal magnetic field to the sample. Without loss of generality, we model the excitation field as a 1D cosine function with peak amplitude Bex [T] and frequency f0 [Hz]
| (2) |
Solving H (x) + Hs (t) = 0, we obtain the instantaneous Field Free Point (FFP), xs (t) [m]
| (3) |
where we have defined W = 2Bex / (μ0G) [m]. This equation shows that FFP trajectory sinusoidally scans across a region of width W, which we refer to as the “partial Field-of-View” (pFOV).
The particle signal is picked up by an inductive coil. The 1D MPI signal equation in volts can be derived using the Reciprocity Theorem and the three assumptions above [12]. Assuming the receiver coil has a sensitivity map of −B1 [T/A] and the input particle distribution is ρ(x) [particles/m], we obtain the following convolution relation:
| (4) |
where γ ≜, B1 mG / Hsat, m [Am2] is the magnetic moment of the magnetic nanoparticle, Hsat [A/m] is the amplitude of the magnetic field it takes to half saturate the nanoparticle tracer, ẋs (t) [m/s] is the instantaneous FFP speed, and ℒ refers to the Langevin function that characterizes SPIO magnetization.
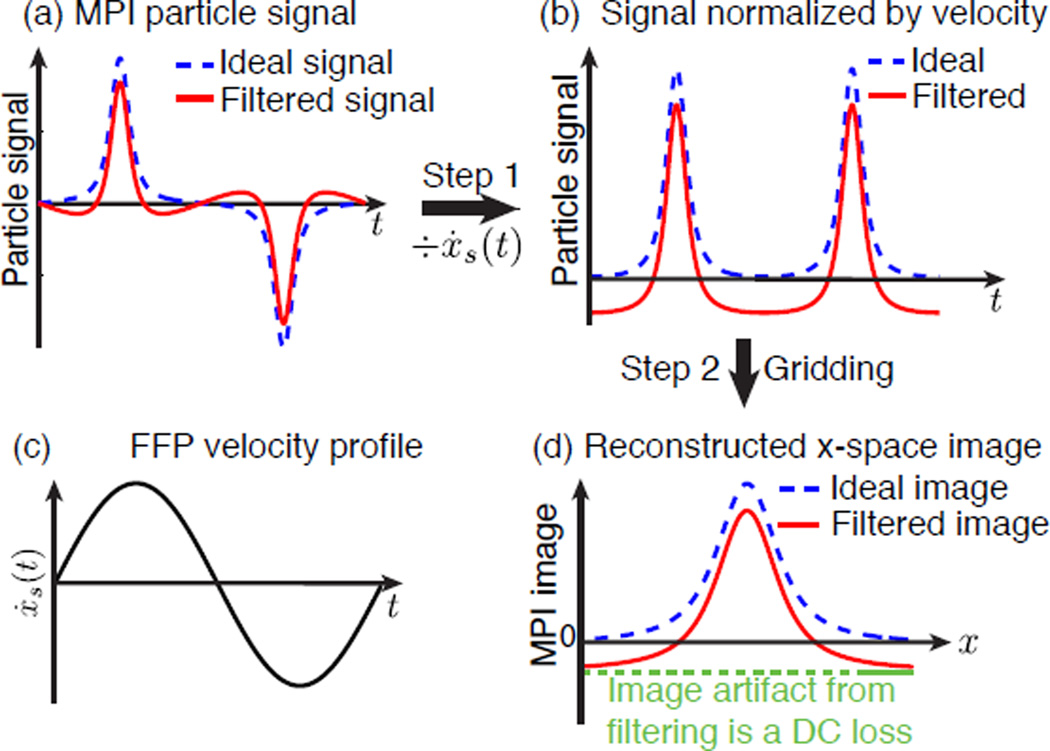
We can analytically convert the time-domain signal equation directly into a native MPI image, ρ̂(x), using the x-space reconstruction method [12]. This only requires normalizing the received signal by the instantaneous velocity, followed by gridding to the instantaneous position of the FFP (Fig. 3):
| (5) |
Note that the x-space reconstruction only requires a single point-wise division and gridding operation, which can be performed in real time. As we described above, the noise source in MPI is currently dominated by the direct feedthrough interference, which decreases together with the FFP velocity. Thus, theoretically, dividing the signal by the velocity should not amplify the direct interfering noise. For these reasons, x-space reconstruction method is computationally efficient and well-conditioned.
Figure 3.
Filtering out the fundamental frequency component of the particle signal leads to a constant offset artifact in the MPI image. (a), (b), and (d) show the two-step x-space reconstruction from signal in time domain to MPI image in spatial domain. (c) A plot of the FFP velocity.
The analysis above shows that the resulting MPI image is simply the nanoparticle density convolved with the native MPI point spread function (PSF), which is clearly identified as h(x) ≜ ℒ̇ [Gx / Hsat] (Fig. 2a–c). In the case of 2D or 3D excitation field, MPI can still be written as the multi-dimensional nanoparticle distribution convolved with a multi-dimensional PSF, as shown in Goodwill et al. [13]. This convolution relationship proves that MPI is a linear and shift-invariant imaging system. However, this result assumes that the complete MPI signal is available for reconstruction into a LSI image. In contrast, the first harmonic information is unavailable in practice due to the direct feedthrough high-pass filtering operation. We now analyze this challenge.
Figure 2.
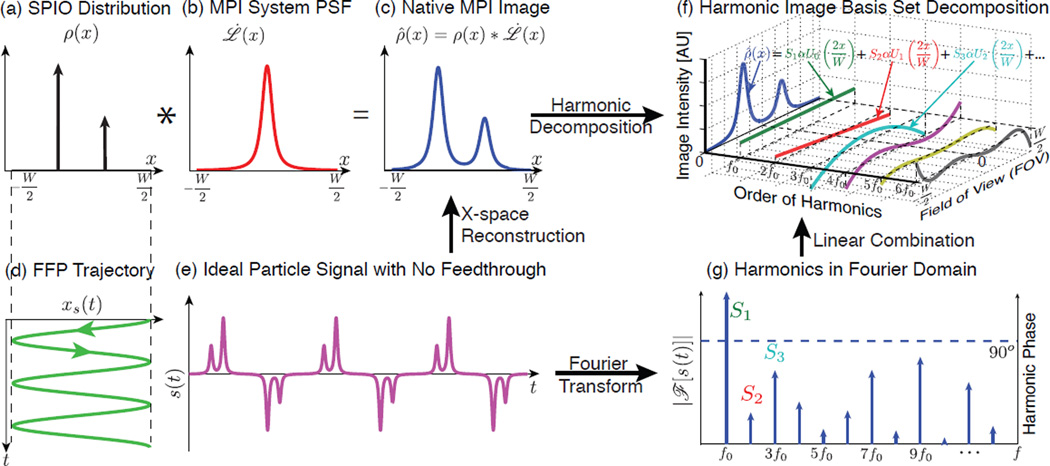
Illustration of 1D MPI imaging process, x-space reconstruction and harmonic decomposition of the MPI signal in the time and image domains. (a)–(c) MPI is intrinsically LSI – the native image can be written as a convolution of the input SPIO distribution and a point spread function (PSF). (d) Basic sinusoidal scanning sequence in 1D. (e) Theoretical time domain nanoparticle signal assuming no direct feedthrough. (f) Application of the x-space reconstruction to each harmonic signal expands the native image into the MPI harmonic image basis set, which is composed of Chebyshev polynomials of the second kind. (g) The Fourier representation of the time domain signal. Note that the phase is 90° across all the harmonics from the inductive detector.
B. MPI Harmonic Image Basis Set
To understand how filtering affects the MPI image, it is powerful to assess the individual contribution each temporal harmonic signal makes to an MPI image. Building on insightful results from Rahmer et al. [10] on the harmonic decomposition of unfiltered particle signals, we apply here for the first time the x-space reconstruction algorithm to each harmonic, and we prove that filtering out the first harmonic information corresponds to losing a constant, or DC, component of the MPI image.
We begin with Fourier analysis of the received particle signal s(t). For periodic cosinusoidal excitation expressed in Eqn. 2, the received signal is composed of a series of sinusoidal harmonics of the excitation. Rahmer et al. decomposed the received particle signal into a Fourier Series [10]:
| (6) |
where Sn is the Fourier coefficients of the nth order harmonic signal.
We now apply the x-space reconstruction method to both sides of Eqn. 6 to derive an analytic decomposition of the MPI image. Because the x-space reconstruction is a linear operation, we can apply it to each term in the series and thereby isolate the spatial contribution from each harmonic. From the FFP trajectory in Eqn. 3, we can make substitution ẋs (t) = −π f0 W sin (2π f0t) and 2π f0t = arccos (2x / W), and we obtain:
| (7) |
where α is a constant that only depends on the scanning parameters and particle properties, with the analytical form . Hence, the nth harmonic signal corresponds to a weighted version of a simple Chebyshev polynomial of the second kind, Un−1 (x). In fact, this result implies that the set of Chebyshev polynomials constitutes a complete and natural MPI harmonic image basis set [10]. Therefore, Eqn. 8 motivates a straightforward analysis of the lost harmonic signals due to temporal filtering.
For reference, the first five Chebyshev polynomials are listed in Table I. Most pertinent to this paper, the first harmonic basis image is simply a constant in space. The second harmonic reconstructs to a linear slope in space, and the third harmonic corresponds to the quadratic basis function in space. Figure 2 illustrates an example of decomposing an MPI native image from a simple nanoparticle distribution onto the MPI harmonic image basis set. This image decomposition highlights the fundamental transform in MPI between image space and harmonic space, and it allows a thorough analysis of the spatial frequency contents of all MPI harmonics.
Table I.
Relationship between the time domain harmonic signal and the MPI harmonic image basis set.
| Harmonic | MPI harmonic image basis set | Shape |
|---|---|---|
| sin (1ω0t) | 1 | constant |
| sin (2ω0t) | 2x | linear slope |
| sin (3ω0t) | 4x2 − 1 | parabola |
| sin (4ω0t) | 8x3 − 4x | cubic |
| sin (5ω0t) | 16x4 − 12x2 + 1 | quartic |
| ∶ | ∶ | ∶ |
C. Loss of Image Baseline and Shift Variance due to High Pass Filtering
Equation 7 provides deep and definitive insight into the precise spatial information lost due to filtering out the first temporal harmonic signal in MPI. Mathematically, the high-pass filter removes the first harmonic, which removes a constant from our image:
| (8) |
This artifact is confirmed in Figure 3, where we see that filtering out the fundamental frequency component of MPI signal indeed leads to a loss of a constant in the image. All the rest of odd harmonics (third, fifth, etc.) also contain DC content for the MPI image so we conclude that losing the first harmonic information is precisely equivalent to having an unknown constant or DC offset in the uncompensated x-space MPI image. This insight will inform our first harmonic recovery algorithm below.
A crucial question is whether this loss of a constant value due to high-pass filtering destroys linearity or shift invariance. It is straightforward to prove that linearity is not destroyed by the loss of DC information, since each of the higher order Sn remains linear in ρ̂(x).
However, the loss of the first harmonic does destroy the shift-invariance of an uncompensated x-space image reconstruction. To see this, note that the first harmonic image (and in fact every individual harmonic image) is shift variant. For example, consider the lost first harmonic term, S1, adapted from [10]:
| (9) |
Here, β = −4B1 mG f0 / Hsat, a constant dependent on scanning parameters and particle properties. This equation reveals that S1 varies when ρ̂(x) is shifted due to the space-variant velocity term, , which is unity at x = 0, but it is zero at the edges of the pFOV, x = ±W / 2. This implies that a simple shift of the input image would alter the DC value of an MPI image reconstructed by x-space image reconstruction without the first harmonic information, in clear violation of LSI systems properties.
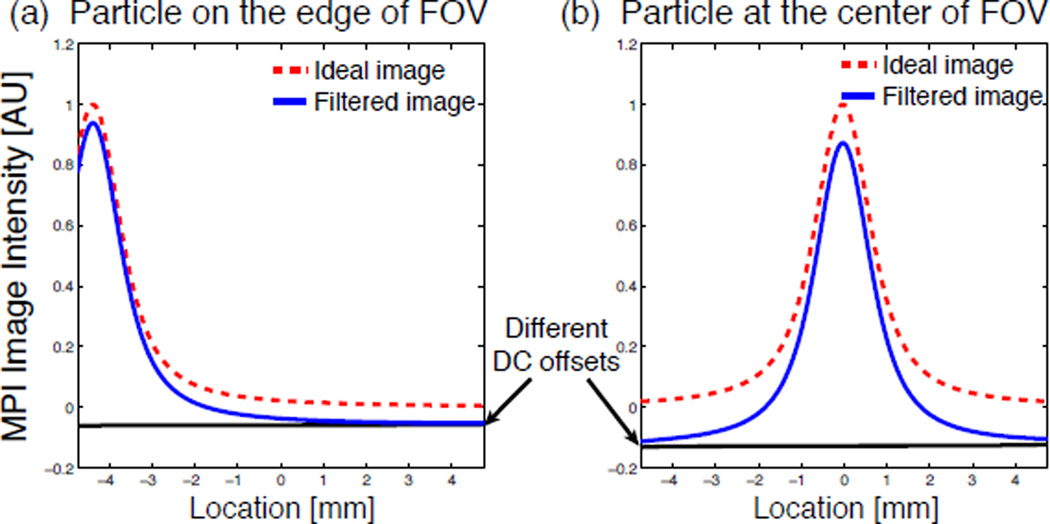
The fact that the DC loss leads to non-LSI properties is confirmed by simulation and experiments. We simulated shifting a simple impulse input in a single FOV, and observed a significantly different DC loss in the image (Fig. 4). Moreover, this artifact becomes far more complex and non-linear in a partial-FOV image reconstruction. As illustrated both in experiments and simulation (see Figs. 5 and 6), if we do not recover the lost DC information, our image reconstruction is not quantitative. Hence it is absolutely critical that this artifact be removed.
Figure 4.
The DC offset lost due to filtering changes when the impulse input of particle distribution is shifted within the FOV, demonstrating that MPI is non-LSI after filtering. The simulated image of an impulse of particles located (a) toward the edge of the FOV, and (b) at the center of the FOV.
Figure 5.
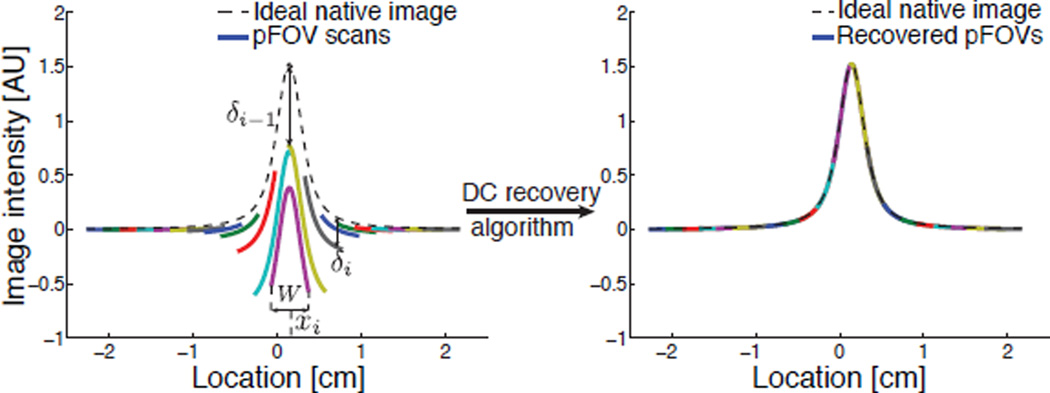
Simulation of pFOV scanning scheme and DC recovery algorithm on an impulse input (i.e., point source) of particles. Each pFOV scan loses a different DC offset δi as each scan sees a different particle distribution. After DC recovery, the lost DC offsets can be completely restored to each pFOV. The reconstructed image shows a perfect match with the ideal native MPI image.
Figure 6.
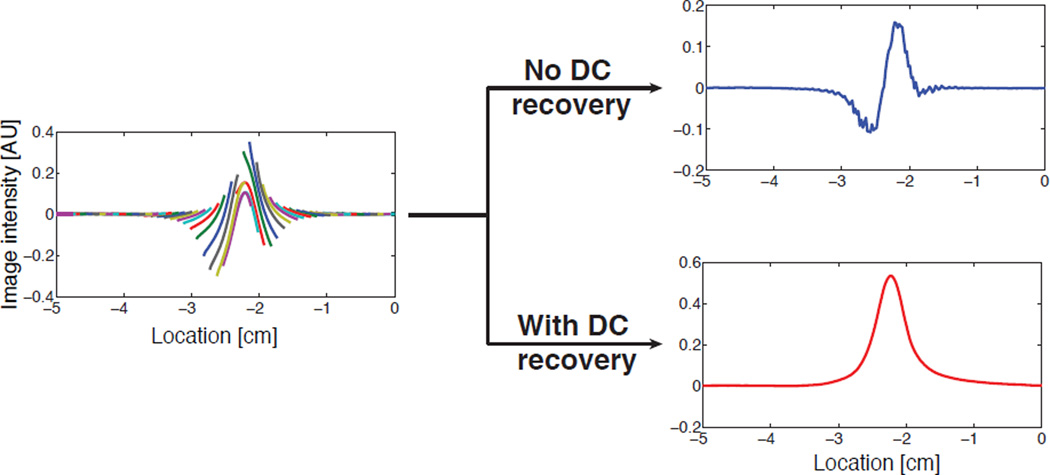
Experimental data of MPI images reconstructed without and with DC recovery. The data was acquired from an impulse input of the particles on Berkeley FFL projection scanner. The reconstructed image without DC recovery has a very different shape from the ideal image and does not have any quantitative value. In contrast, the reconstructed image with DC recovery effectively restores all the lost signal and matches well with the ideal MPI image shown in the simulation (Fig. 5).
An apparent paradox arises: how can x-space reconstruction using all the harmonic signals be shift invariant while each harmonic image is shift variant? This paradox is resolved by the fact that the sum of all the harmonic basis images (including the unavailable first harmonic term) does indeed cancel the shift-variant velocity weighting term, revealing a linear and shift-invariant MPI image (see Appendix A for a rigorous proof). This reassures that the x-space theory remains valid, and it indicates that one should be able to restore LSI properties by simply restoring the lost first harmonic image.
Since there is no practical way to filter out direct feedthrough without also rejecting the first harmonic MPI signal, we must instead devise an algorithm to restore the lost DC information using a priori information. It is fortunate that the image artifacts from filtering are restricted to the DC components of the MPI image, since there exist many robust signal processing methods to restore baseline or DC components of an image using continuity algorithms. In Section III we present a fast and robust continuity algorithm that recovers the lost DC offset and thereby restores the quantitative LSI properties of the x-space MPI technique.
D. Partial Field of View MPI Scanning and Lost Baseline Information
Clinical MPI must obey human safety limits on SAR and magnetostimulation [22], [23]. Within the typical operation frequency range of MPI, magnetostimulation has been shown to be the dominant safety concern [24]. For example, if we are to image a torso (r = 20 cm) using a full body MPI scanner with 5 T/m gradient, it would require a 1 Tpp excitation field strength to cover the entire sample. However, magnetostimulation limits excitation field amplitudes of ≈ 8 mTpp at 25 kHz [24] to avoid stimulating the human subjects, which would only cover a partial field of view (pFOV) of about 3 mm. To address this magnetostimulation challenge while covering a large FOV, the Philips group introduced the ’focus field’ approach [2], [25], [26], where they rapidly scan small sub-regions and slowly translate the center of the sub-region to cover the entire FOV. Each sub-region (or ’station’) is reconstructed individually by system matrix inversion. The full FOV is then reconstructed by averaging the sub-regions together. Here we also address the magnetostimulation safety limit with a similar pFOV scanning scheme, but we instead use a modified x-space image reconstruction algorithm.
We now understand that high-pass filtering distorts only the global DC value. This situation is more complex for pFOV scanning. Figures 5 and 6 shows the pFOV scan data from both experiments and simulation. We can see that the high-pass filter shifts each pFOV by an unknown DC offset that we will denote by δi. If we fail to correct the DC offsets, it is apparent that the naively reconstructed MPI image is highly distorted and non-quantitative (for an example of a unrecovered image, see the experimental data in Fig. 6). To restore the desired native MPI image, we must estimate each of the δi robustly and then fully recover the desired MPI image over the entire FOV. This method is described below.
III. Modified X-space Image Reconstruction with Continuity Enforcement to Restore Lost Baseline Information and LSI Properties in MPI
Consider a single MPI scan reconstructed with the x-space method from the high-pass MPI signal with no first harmonic information. This image will manifest the correct slope, quadratic term, and higher-order terms, but it will have an incorrect DC value. Fortunately, we know that the MPI image should be zero outside the FOV where no particles exist, so it is straightforward to offset the entire image so that the average value of the reconstructed image outside the FOV is zero. Essentially we are enforcing continuity to the known zero boundary condition. This a priori information allows us to robustly recover the lost DC information.
We can extend this continuity algorithm to pFOV scanning provided our FFP scanning trajectory satisfies two conditions:
Overlapping pFOVs: The pFOV scans must have non-zero overlap to ensure continuity of the overall full-FOV reconstruction.
Known boundary conditions: To have a robust recovery of the global baseline offset, we must have some a priori knowledge of the particle concentration at one reference location. For example, we need a location that is known to contain no tracer (such as a location outside the patient), or a fiducial with known concentration. This is akin to the FOV requirement to prevent aliasing in CT and MRI.
Figure 5 illustrates the operation of our DC or baseline recovery algorithm. For illustrative purposes, we will describe the algorithm working from left to right, but symmetric continuity algorithms are also feasible.
We first simply shift the leftmost pFOV sub-image so that the region outside the patient has zero average signal. Mathematically, this is identical to picking the first DC shift estimate, δ1, as the negative of the sample mean of the leftmost pFOV.
The rest of the constant offsets can be estimated iteratively by maximizing the continuity of successive pFOV scans over the overlapping regions. Mathematically, we pick the DC shift estimates, δ̂i, to be the sample mean of the difference between the successive pFOVs, where the averaging takes place only over the two regions’ overlap zone.
This recovery algorithm is real-time since offsets can be directly calculated with linear computational complexity. In Appendix B, we prove that this algorithm provides statistically unbiased estimates of the real offsets, and a complete restoration of the linearity and shift invariance of MPI system. In the following sections, we demonstrate with experiments and simulation that with this modified x-space reconstruction, MPI images demonstrate linearity and shift invariance.
IV. Methods
A. Simulations
We implemented a numerical simulation of the MPI imaging process, including magnetic field simulation, Langevin nanoparticle modeling, FFP trajectory generation, signal detection, direct feedthrough interference computation and filtering (MATLAB, Natick, MA). X-space reconstruction was implemented in the simulator to reconstruct the native MPI images. The simulated MPI signals and images were then decomposed into harmonic basis sets, and compared with the analytic forms. Specific harmonic images of interest included the first and second harmonic images.
B. Phantom Imaging
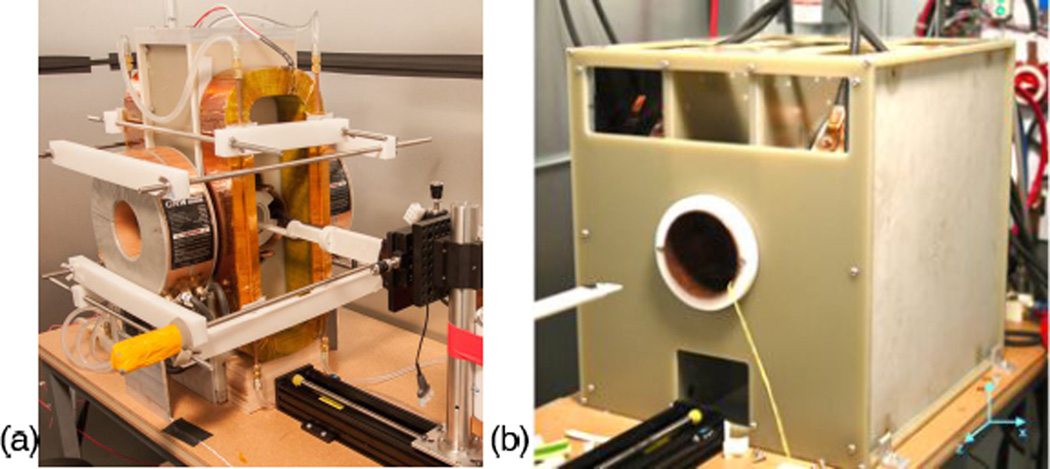
The imaging experiments were performed on the Berkeley field free line (FFL) projection MPI scanner (Fig. 7(a)) [27] and 3D FFP MPI scanner (Fig. 7(b)). The gradient strength of FFL scanner is 2.25 T/m along x and z axes, yielding an imaging resolution of 3.9 mm in z axis and 7.6 mm in x axis with the contrast agent Resovist [27]. The 3D FFP MPI scanner has a gradient strength of 7 T/m in the x axis, and 3.5 T/m in y and z axes, yielding an image resolution of 2.5 mm in all axes with Resovist. Both scanners excite along the z axis at 22 kHz. Alongside with a triangular slow-shifting magnetic field in x axis, the excitation field covers each pFOV in a Cartesian trajectory [28], while the additional slow-shifting magnetic fields in z axis (as well as y axis in the case of Berkeley 3D FFP MPI scanner) slowly translate the pFOV to cover the entire imaging sample [13].
Figure 7.
MPI scanners. (a) Berkeley FFL projection MPI scanner, with a gradient strength of 2.25 T/m along x and z axes. (b) Latest Berkeley 3D x-space MPI scanner, with a gradient strength of 7 T/m in the x axis and 3.5 T/m in y and z axes.
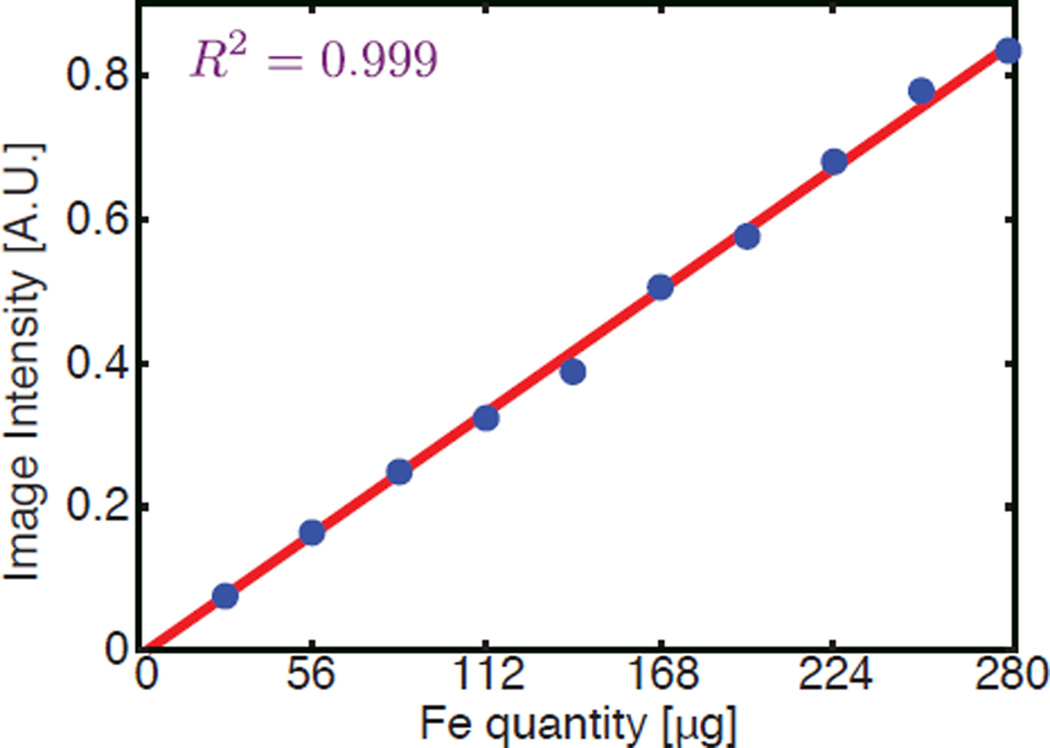
To test the linearity of the system, we acquired a series of images on the Berkeley FFL scanner, each containing a single point source tracer with iron quantity ranging from 28 µg to 280 µg Fe, with a step size of 28 µg for a total of 10 measurements. An image of 1 cm by 1 cm is taken and reconstructed for each sample, and we measure the peak image intensity of each impulse response.
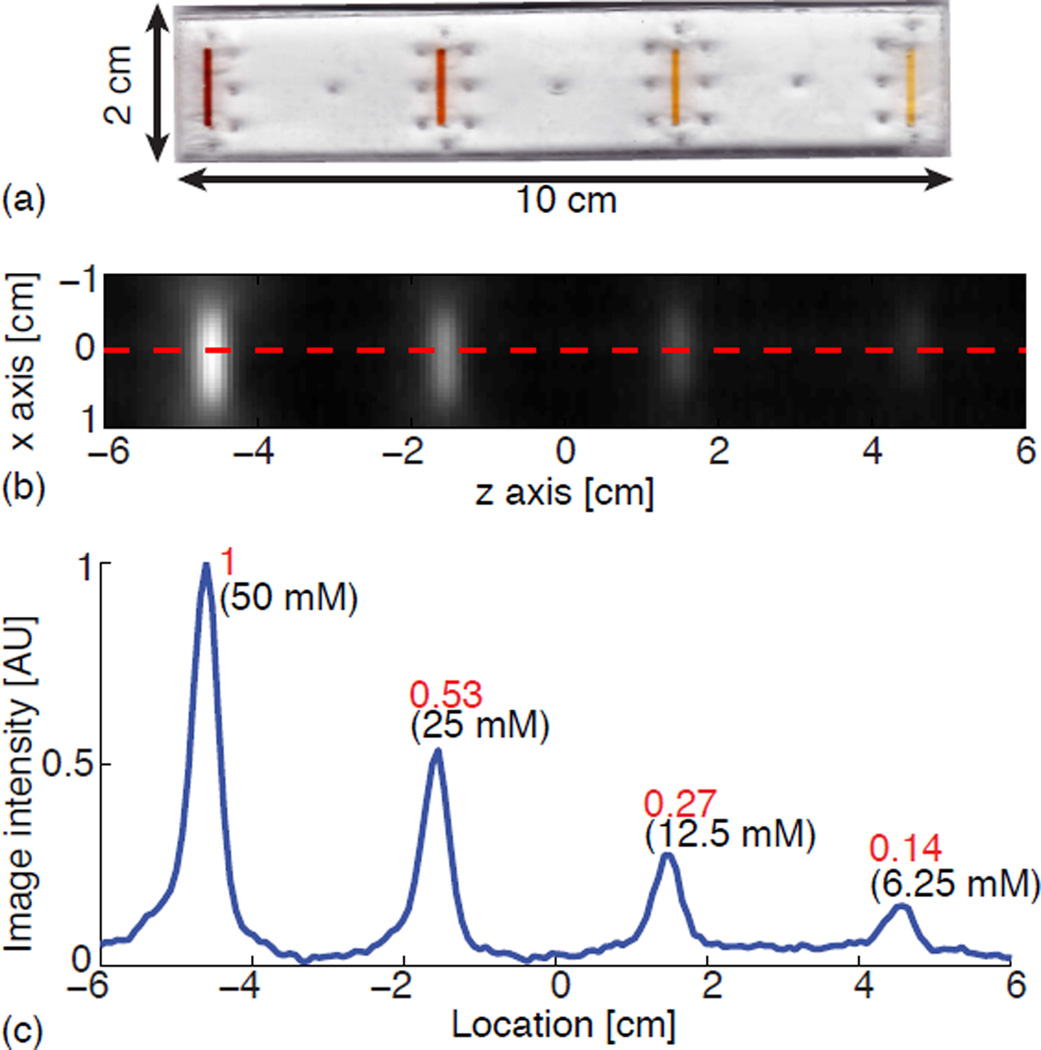
To test linearity and shift invariance simultaneously, we constructed an acrylic phantom containing multiple line sources of different concentrations (Fig. 9(a)) and imaged it using the FFL scanner. The phantom measures 10 cm by 2 cm and contains four laser-cut channels. Each channel has a width of 1.5 mm, a thickness of 3 mm and a length of 1 cm. The channels are spaced at 3 cm intervals and filled with exponentially decreasing concentrations of Resovist tracer: 50, 25, 12.5 and 6.25 millimoles Fe/L. The phantom was imaged with a 2D FOV of 6 cm × 12 cm in the horizontal xz imaging plane, with a scan time of 39 seconds. The FFL scanner has a pFOV of about 6 cm × 2.5 cm. The total scan was completed with a pFOV overlap ratio of 75%.
Figure 9.
Experimental demonstration of MPI’s linearity and shift invariance after recovery and stitching. (a) Linearity and shift invariance phantom. The phantom is injected with diluted Resovist, with iron concentration of 50, 25, 12.5, and 6.25 millimoles Fe/L in each channel from left to right respectively. (b) The undeconvolved native image is reconstructed after recovery and stitching. (c) The center line of the reconstructed image shows that the signal intensity is linearly proportional to the particle concentration, and the PSF shape and resolution is the same regardless of location.
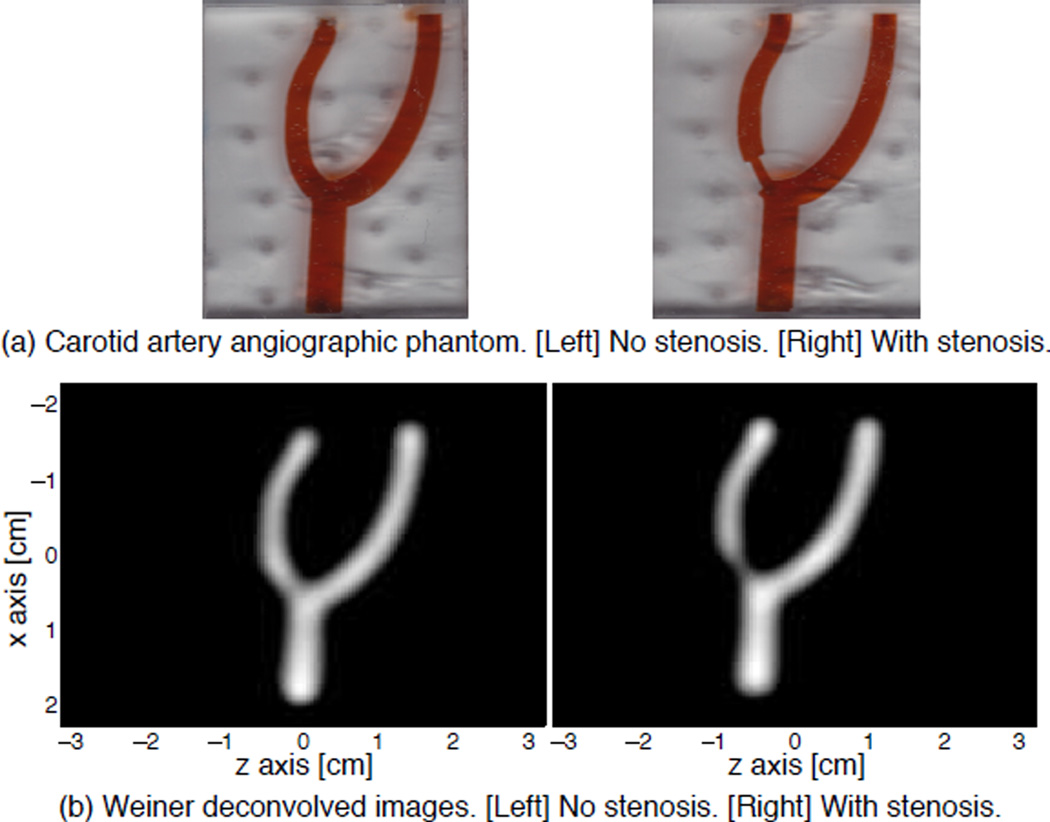
We also constructed two laser-cut acrylic “carotid artery” phantoms imitating two models of carotid arteries with and without a stenosis model (Fig. 10a). We scanned this phantom on a 3D FFP MPI scanner. The channel representing the common carotid artery is 4.5 mm wide, and the branching channels representing the external and internal carotid arteries have a width of 3 mm. Both are approximately 75% the size of a typical human carotid artery. In one of the phantoms, we created a stenosis where the internal carotid artery is half occluded. The phantom is filled with 20-fold diluted Resovist at 25 millimoles Fe/L concentration. The phantom was imaged with a full 3D FOV at a spatial coverage of 4.5 cm × 4.5 cm × 6.2 cm, and a scan time of 141 seconds. The pFOV size was around 4.5 cm × 4.5 cm × 1.3 cm. The overlap ratio between two successive pFOVs were 80%.
Figure 10.
MPI shows promise as a quantitative angiographic imaging modality. (a) The carotid artery phantom is filled with 20× diluted Resovist (25 millimoles Fe/L). The phantoms represent the internal carotid artery with no occlusion and half occlusion. (c) Reconstructed native MPI images with baseline recovery, followed by mild Wiener deconvolution with a simulated 2D PSF, and displayed at 10% leveling. The occlusion in the phantom is very well captured in the MPI images.
C. X-space Reconstruction and Recovery Algorithm Implementation
The received particle signals of the imaging phantoms are reconstructed using the two-step x-space reconstruction algorithm [12], [29]: the signal is first velocity compensated and then gridded to the instantaneous FFP position to form the MPI image of each pFOV scans. Due to relaxation effects and other non-interference noise sources in MPI scanners, the particle signal is non-zero at the edges of the pFOVs, where the FFP velocity is zero. To avoid the noise amplification at the two edges, we only reconstruct the central 95% of each pFOV. Experimentally, the data loss and the noise gain are negligible with a small amount of edge pFOV discarded.
The baseline or DC recovery continuity enforcement algorithm was implemented as described in Section III using MATLAB (Mathworks, Natick, MA). The computational time required for complete DC baseline recovery was minimal, on the order of milliseconds per line-scan using standard computing hardware (2× Intel Xeon E5645 CPUs, each with 6 cores, 2.4 GHz, 144 GB RAM, 64-bit Windows Server 2008 R2). Finally, we averaged the DC recovered pFOV scans to assemble a final MPI image.
V. Results
Figure 8 shows the results of the linearity test. As demonstrated in this figure, MPI image is linear with respect to iron quantity with a near-perfect correlation coefficient (R2 = 0.999) after we recover the DC offsets and stitch the pFOVs. The detection limit depends on the tracer type and has considerable room for improvement as we improve the system sensitivity and address interference sources in our system.
Figure 8.
Experimental demonstration of MPI’s linearity after recovery and stitching. The peak intensity of the corresponding MPI image is linearly proportional to the input particle quantity, showing a near-perfect correlation coefficient (R2 = 0.999). The amount of iron tested ranges from 28 µg to 280 µg, with a step size of 28 µg. An image of 1 cm by 1 cm is taken and reconstructed for each sample, and the peak value of each impulse response is plotted.
Figure 9 shows the result of the linearity and shift-invariance phantom. The reconstructed image following baseline recovery faithfully reflects the exponentially decreasing iron concentration within the channels. The center line of the reconstructed image shows that the signal intensity is linearly proportional to the particle concentration, and the PSF is the same regardless of location, verifying the linearity and shift invariance of the system.
Figure 10 shows the carotid angiographic phantoms, and the reconstructed MPI images with baseline recovery and mild Wiener deconvolution. The occlusion in the vessel is clearly depicted by the reduced brightness, as well as the narrowing. These images are quantitative as the baseline recovery algorithm ensures the linearity and shift invariance of MPI system. This experiment demonstrates the tremendous potential of MPI for angiographic imaging.
VI. Discussion
A. Tradeoffs Between Speed and Absolute Quantitation in MPI
Linearity and shift invariance (LSI) are crucial properties for quantitative imaging. In fact, almost all existing medical imaging modalities are modeled as LSI systems, including Ultrasound, CT, PET/SPECT and MRI. Linearity in MPI means that each pixel value is linearly related to the true nanoparticle concentration at that pixel. Shift-invariance means the MPI scanning process blurs the image of the nanoparticle concentration identically at every location in the image. Applications of quantitative MPI could include tracking and quantitating stem cells, or inflammation. As human MPI systems are developed, LSI qualities will also be crucial for clinicians to make quantitative diagnoses, such as ejection fraction, lumen diameter, and tumor volume.
In this paper, we both mathematically proved and experimentally demonstrated that MPI is linear and shift invariant, but only after the DC restoration algorithm recovers the lost first-harmonic image information. The modified x-space image reconstruction requires overlapping pFOVs, and full coverage of the entire FOV. These conditions enable a fast, robust algorithm to restore the lost DC information in realtime without inverting a large system matrix. Other imaging modalities also require boundary conditions. For example, MRI pulse sequence designers must choose the minimum number of phase encodes based on the FOV size to prevent spatial aliasing. In MPI, we need these conditions to ensure an absolutely quantitative and linear, shift-invariant MPI scan.
It is likely that clinicians will prefer speed over absolute quantification for certain clinical applications. For example, for cardiac imaging or coronary artery imaging, scanning speed is crucial because of the speed of cardiac motion. Also, the heart itself spans only a small fraction of the full patient FOV. Acquiring all the pFOVs out to the edge of the chest would require far more scan time than simply covering the heart. Clearly, full FOV acquisition may not be prudent for such clinical applications. Hence, one could modify the proposed method by finding a region near the heart (e.g., pericardiac fat) containing no contrast agent and use this region to provide the zero boundary condition. This would also still permit true quantitative and LSI imaging. Indeed, physicians may abandon absolute quantification for relative quantitation when imaging speed is paramount. Suppose we quickly scan only a small FOV over the heart at high speed. Then one could reconstruct a continuous image between pFOVs, using the continuity algorithm demonstrated here. As a result, the entire image would have an arbitrary DC baseline; but physicians may obviate this artifact with routine tools like window and level adjustment.
The second requirement, overlapping pFOVs, is somewhat similar to the requirement of adequate sampling to prevent spatial aliasing in CT, PET or MRI. We have found that, in practice, about 15% overlap is required during the scan (results not shown). Of course, this implies a small loss of overall imaging speed. Note that increasing the overlap region size can boost SNR, since we average independent noise sources across the overlapping regions. Our experimental pulse sequences on the latest 3D MPI scanner in Fig. 8(a) demonstrate that even with a 80% overlap, we can still achieve a reasonable scan time of 141 seconds at a 3D volumetric coverage of 4.5 cm × 4.5 cm × 6.2 cm. Clearly, optimizing the overlap region between pFOVs will require a delicate tradeoff between SNR, scan time, and motion artifacts. Hence, the optimal overlap region is likely to depend on the particular clinical application.
B. Parallels Between the System Function Method and X-space Image Reconstruction Methods
This analysis is the first time that the mathematical tools of x-space reconstruction have been applied to the Fourier decomposition that inspired Philips’ excellent System Function method [10]. This effort could begin the unification of the two MPI image reconstruction methods. There remain significant differences between the complexity, speed and robustness of the two methods. We hope that these parallels will help researchers compare tradeoffs between the two dominant image reconstruction methods currently used in MPI.
Indeed, in theory, an MPI image could be reconstructed by summing the Sn -weighted Chebyshev-basis images in Eqn. 7, as proposed first by Rahmer et al. [10]. This image reconstruction method would be slightly slower than x-space reconstruction method (only due to the FFT operation), but faster than the system matrix inversion method. Of course, this reconstruction method and system function reconstruction method both fundamentally lack the first harmonic data, since high-pass filtering is essential for all MPI methods. Hence, we recommend applying a continuity algorithm to restore the lost DC offset information for both methods. Indeed, the successful demonstration of reconstruction using Chebyshev basis set would be a welcomed advancement to the field.
This analysis also confirms the Rayleigh limit of spatial resolution in MPI, given by Rahmer et al. [10] and Goodwill et al. [12]. One might hope that an infinite number of Fourier harmonic coefficients could enable reconstruction of an MPI image at arbitrarily high spatial resolution. However, this analysis confirms that even with an infinite number of Fourier coefficients, one can only perfectly reconstruct an MPI image that has already been blurred by the derivative of the Langevin function, ρ̂(x) ≜ ρ(x) * ℒ̇ (Gx / Hsat), as shown by Eqn. 5. Exceeding this spatial resolution defined by the nanoparticle’s Langevin function and the applied gradient field then must rely on some form of deconvolution.
C. Higher Harmonic Restoration
Here we focused exclusively on the loss of first harmonic information due to the high-pass filter. However, the high-pass filter may not be sharp enough to leave the 2nd, or even 3rd, harmonic information intact. It is straightforward to extend the analysis above to include 2nd or 3rd harmonic restoration, which is precisely equivalent to restoring the linear or quadratic terms of our reconstructed MPI scans. Fortunately, low spatial frequency information can be robustly recovered provided there is adequate SNR and adequate overlap. While our current high-pass filter only removes the first harmonic, this may be an area of fruitful future investigation.
D. Extension to MPI Fluoroscopy
To date, the Fourier analysis of MPI, whether employed for x-space or system function methods, always assumes a periodic time domain received signal. This implies a discrete Fourier spectrum. Physically, this is only true when we repeat the scan of the same y-line in image space several times. However, the only clinically pertinent reason to scan the same line repeatedly is to increase SNR through averaging. We expect that future MPI scanners will scan faster, perhaps even a single period per y-line, with no repetition. At that point our received spectrum can no longer be modeled as a discrete spectrum. Fortunately, we believe that the modified x-space image reconstruction presented here will remain effective and robust, since it does not directly rely on the Fourier coefficients.
VII. Conclusions
All MPI scanners employ high-pass filters to prevent direct feedthrough of the first harmonic from the transmit coil to the receiver coil, which could easily drown the received MPI signal. For a simple case of 1D sinusoidal excitation, we showed in theory, simulation, and in experiment that this high-pass temporal filtering removes only a DC component of an MPI scan. If left uncorrected, this loss of information destroys the shift invariance of x-space MPI images and also produces severe image artifacts. We showed both theoretically and experimentally that our proposed continuity algorithm restores the lost DC offsets accurately. We also showed that this restores linearity and shift invariance in x-space MPI. Last, we demonstrated the experimental MPI scans reconstructed with this modified x-space algorithm and measured near-perfect linearity and shift invariance with respect to the concentrations of SPIO contrast agent. This effort represents a crucial step toward making MPI a quantitative tracer imaging modality.
Acknowledgements
This work was supported in part by CIRM Tools and Technology Grant RT2-01893, National Institute of Biomedical Imaging and Bioengineering Grant Number 1R01EB013689, CIRM fellowship 2013, and a UC Discovery grant. The contents of this publication are solely the responsibility of the authors and do not necessarily represent the official views of CIRM, the National Institute of Biomedical Imaging and Bioengineering, the National Institutes of Health, or any other agency of the State of California.
Appendix
A. Sum of Harmonic Components Manifests Linearity and Shift-Invariance
One apparent paradox uncovered in the analysis in Theory Section is the fact that each harmonic image is shift variant, yet the sum of all basis images is shift invariant. Here we resolve this paradox by summing all the harmonic basis functions, and showing that the shift-variant term, cancels out only after we add all the terms together.
Here, we rely on the Chebyshev polynomial identity [30]:
First, we adapted the analytic expression of Sn from [10] to our notations, which has the form:
| (10) |
where β = −4B1 mG f0 / Hsat, is a constant dependent on scanning parameters and particle properties; and ρ̂(x), is the native MPI image reconstructed using the x-space method.
Let us substitute the Fourier coefficient Sn into the image decomposition equation (Eqn. 7), we have:
We conclude that the sum of all the linear but shift-variant harmonic images does indeed provide a linear and shift-invariant MPI image.
B. Mathematical Proof of LSI Restoration
Here we give a complete derivation of the DC recovery algorithm and prove that our algorithm robustly restores all the lost image information, and the linearity and shift invariance of MPI images.
First of all, let us denote the ideal native MPI image as ρ̂(x), the center position of each pFOV as xi, the noise in this pFOV image as ni (x). Let us also denote the lost DC value from the ith pFOV scan as δi, while the estimator of this lost DC value as δ̂i. Then with an unmodified x-space reconstruction, the lossy pFOV image will have this form:
| (11) |
The lost DC value δi can be estimated by maximizing the continuity between the ith pFOV scan and its previous scans over the overlapping region. Let us denote Pi as the dataset that includes all the points within the overlapping region between the ith and (i − 1)th pFOV scan, which is defined as . Let’s further denote g0 (x) ≜ 0 and n0 (x) ≜ 0, corresponding to a virtual 0th scan that incorporates the boundary condition into the same mathematical framework. Thus, the process of estimation for each DC offset, δ̂i, can be expressed as
| (12) |
As one would hope, δ̂i is an unbiased estimate of the actual DC loss to each pFOV, provided that all the image noise, ni (x), is zero-mean, i.e.,
| (13) |
where E {X} denotes the expected value of a random variable X.
After restoring the DC values to each of the pFOVs, our final estimate of the true MPI nanoparticle density can be computed as
| (14) |
This analysis proves that restored image ĝi (x) is an unbiased estimation of the ideal native MPI image ρ̂(x) with no amplification of noise and within the same subregion, which we already know to be linear and shift invariant from Eqn. 5. This algorithm obtains (at least) two estimates of the native MPI image in the overlapping zone, and we can average these to reduce image noise. To form our final MPI image, we simply join all the pFOVs numerically on an interpolated uniform grid that spans the full FOV. This algorithm is able to reconstruct an accurate rendition of the ideal MPI image ρ̂(x), with fully restored LSI properties. Fig. 5 and Fig. 6 illustrates the recovered images from both simulation and experiment, demonstrating that the continuity algorithm does recover the lost DC image information.
References
- 1.Gleich B, Weizenecker J. Tomographic imaging using the nonlinear response of magnetic particles. Nature. 2005 Jun;435(7046):1214–1217. doi: 10.1038/nature03808. [DOI] [PubMed] [Google Scholar]
- 2.Weizenecker J, Gleich B, Rahmer J, Dahnke H, Borgert J. Three-dimensional real-time in vivo magnetic particle imaging. Physics in Medicine and Biology. 2009 Mar;54(5):L1–L10. doi: 10.1088/0031-9155/54/5/L01. [DOI] [PubMed] [Google Scholar]
- 3.Neuwelt EA, Hamilton BE, Varallyay CG, Rooney WR, Edelman RD, Jacobs PM, Watnick SG. Ultrasmall superparamagnetic iron oxides (USPIOs): a future alternative magnetic resonance (MR) contrast agent for patients at risk for nephrogenic systemic fibrosis (NSF)? Kidney International. 2008 Mar;75(5):465–474. doi: 10.1038/ki.2008.496. [DOI] [PMC free article] [PubMed] [Google Scholar]
- 4.Lu M, Cohen MH, Rieves D, Pazdur R. FDA report: Ferumoxytol for intravenous iron therapy in adult patients with chronic kidney disease. American Journal of Hematology. 2010 May;85(5):315–319. doi: 10.1002/ajh.21656. [DOI] [PubMed] [Google Scholar]
- 5.Coresh J, Selvin E, a Stevens L, Manzi J, Kusek JW, Eggers P, Van Lente F, Levey AS. Prevalence of chronic kidney disease in the United States. JAMA: the Journal of the American Medical Association. 2007 Nov;298(17):2038–2047. doi: 10.1001/jama.298.17.2038. [DOI] [PubMed] [Google Scholar]
- 6.Heinrich MC, Kuhlmann MK, Kohlbacher S, Scheer M, Grgic A, Heckmann MB, Uder M. Cytotoxicity of iodinated and Gadolinium-based contrast agents in renal tubular cells at angiographic concentrations: in vitro study. Radiology. 2007;242(2):425–434. doi: 10.1148/radiol.2422060245. [DOI] [PubMed] [Google Scholar]
- 7.Katzberg RW, Haller C. Contrast-induced nephrotoxicity: clinical landscape. Kidney International. 2006 Apr;69:S3–S7. doi: 10.1038/sj.ki.5000366. [DOI] [PubMed] [Google Scholar]
- 8.Sadowski EA, Bennett LK, Chan MR, Wentland AL, Garrett AL, Garrett RW, Djamali A. Nephrogenic Systemic Fibrosis: risk factors and incidence estimation. Radiology. 2007;243(1):148–157. doi: 10.1148/radiol.2431062144. [DOI] [PubMed] [Google Scholar]
- 9.Prince JL, Links JM. Medical imaging signals and systems. River, NJ: Pearson Prentice Hall Upper Saddle; 2006. [Google Scholar]
- 10.Rahmer J, Weizenecker J, Gleich B, Borgert J. Signal encoding in magnetic particle imaging: properties of the system function. BMC Medical Imaging. 2009 Jan;9:4. doi: 10.1186/1471-2342-9-4. [DOI] [PMC free article] [PubMed] [Google Scholar]
- 11.Rahmer J, Weizenecker J, Gleich B, Borgert J. Analysis of a 3D system function measured for magnetic particle imaging. IEEE Trans Med Imag. 2012;31(6):1289–1299. doi: 10.1109/TMI.2012.2188639. [DOI] [PubMed] [Google Scholar]
- 12.Goodwill PW, Conolly SM. The x-space formulation of the magnetic particle imaging process: one-dimensional signal, resolution, bandwidth, SNR, SAR, and magnetostimulation. IEEE Trans Med Imag. 2010 Jun;29(11):1851–1859. doi: 10.1109/TMI.2010.2052284. [DOI] [PubMed] [Google Scholar]
- 13.Goodwill PW, Conolly SM. Multi-dimensional x-space magnetic particle imaging. IEEE Trans Med Imag. 2011 Mar;30(9):1581–1590. doi: 10.1109/TMI.2011.2125982. [DOI] [PMC free article] [PubMed] [Google Scholar]
- 14.Knopp T, Biederer S, Sattel T. Prediction of the spatial resolution of magnetic particle imaging using the modulation transfer function of the imaging process. IEEE Trans Med Imag. 2011;30(6):1284–1292. doi: 10.1109/TMI.2011.2113188. [DOI] [PubMed] [Google Scholar]
- 15.Huang CR, Pan WD, Chen HQ, Copley AL. Thixotropic properties of whole blood from healthy human subjects. Biorheology. 1987;24(6):795–801. doi: 10.3233/bir-1987-24630. [DOI] [PubMed] [Google Scholar]
- 16.Fahraus R, Lindqvist T. The viscosity of the blood in narrow capillary tubes. American Journal of Physiology. 1931;96(3):562–568. [Google Scholar]
- 17.Weizenecker J, Gleich B, Rahmer J, Borgert J. Particle dynamics of mono-domain particles in magnetic particle imaging. Proc. 1st Int. Workshop Magnetic Particle Imag. 2010:3–15. [Google Scholar]
- 18.Reeves DB, Weaver JB. Simulations of magnetic nanoparticle Brownian motion. Journal of Applied Physics. 2012 Dec;112(12):124311. doi: 10.1063/1.4770322. [DOI] [PMC free article] [PubMed] [Google Scholar]
- 19.Goodwill PW, Tamrazian A, Croft LR, Lu CD, Johnson EM, Pidaparthi R, Ferguson RM, Khandhar AP, Krishnan KM, Conolly SM. Ferrohydrodynamic relaxometry for magnetic particle imaging. Applied Physics Letters. 2011;98(26):262502. [Google Scholar]
- 20.Croft LR, Goodwill PW, Ferguson RM, Krishnan KM, Conolly SM. Relaxation in x-space magnetic particle imaging. IEEE Trans Med Imag. 2012;31(12):2335–2342. doi: 10.1109/TMI.2012.2217979. [DOI] [PMC free article] [PubMed] [Google Scholar]
- 21.Ferguson RM, Khandhar AP, Jonasson C, Blomgren J, Krishnan KM. Size-dependent relaxation properties of monodisperse magnetite nanoparticles measured over seven decades of frequency by AC Susceptometry. 2013 doi: 10.1109/TMAG.2013.2239621. in press. [DOI] [PMC free article] [PubMed] [Google Scholar]
- 22.Reilly JP. Peripheral nerve stimulation by induced electric currents: exposure to time-varying magnetic fields. Medical and Biological Engineering and Computing. 1989;27(2):101–110. doi: 10.1007/BF02446217. [DOI] [PubMed] [Google Scholar]
- 23.Reilly JP. Maximum pulsed electromagnetic field limits based on peripheral nerve stimulation: application to IEEE/ANSI C95. 1 electro-magnetic field standards. IEEE Transactions on Biomedical Engineering. 1998;45(1):137–141. doi: 10.1109/10.650371. [DOI] [PubMed] [Google Scholar]
- 24.Saritas EU, Goodwill PW, Zhang GZ. Safety limits for human-size magnetic particle imaging systems. In: Buzug TM, Borgert J, editors. Magnetic Particle Imaging. Vol. 140. Lubeck, Germany: Springer Proceedings in Physics; 2012. pp. 325–330. [Google Scholar]
- 25.Rahmer J, Gleich B, Schmidt J, Schmale I, Bontus C, Kanzenbach J, Borgert J, Woywode O, Weizenecker J. Increased volume coverage in 3D magnetic particle imaging. Proceedings of the 4th International Symposium on Applied Sciences in Biomedical and Communication Technologies - ISABEL ’ 11; 2011. pp. 1–5. [Google Scholar]
- 26.Schmale I, Rahmer J, Gleich B, Kanzenbach J, Schmidt JD, Bontus C, Woywode O, Borgert J. First phantom and in vivo MPI images with an extended field of view. Proceedings of SPIE medical imaging. 2011:796510. [Google Scholar]
- 27.Goodwill PW, Konkle JJ, Zheng B, Saritas EU, Conolly SM. Projection x-space magnetic particle imaging. IEEE Trans Med Imag. 2012;31(5):1076–1085. doi: 10.1109/TMI.2012.2185247. [DOI] [PMC free article] [PubMed] [Google Scholar]
- 28.Knopp T, Biederer S, Sattel T, Weizenecker J, Gleich B, Borgert J, Buzug TM. Trajectory analysis for magnetic particle imaging. Physics in Medicine and Biology. 2009 Jan;54(2):385–397. doi: 10.1088/0031-9155/54/2/014. [DOI] [PubMed] [Google Scholar]
- 29.Goodwill PW, Lu K, Zheng B, Conolly SM. An x-space magnetic particle imaging scanner. Review of Scientific Instruments. 2012;83(3):033708. doi: 10.1063/1.3694534. [DOI] [PMC free article] [PubMed] [Google Scholar]
- 30.Wolfram Research Inc. Chebyshev polynomials of the second kind: Summation. [Jan. 15, 2013];2001 Oct 29; http://functions.wolfram.com/Polynomials/ChebyshevU.


