

Significance
Cilia and flagella are ubiquitous in eukaryotes, enabling cells to move and pump fluid. Understanding how flagella beat is critical in understanding medical “ciliopathies” (e.g., hydrocephalus, male and female infertility). We introduce a unique flagellar model system: the male microgametes of the malaria parasite Plasmodium berghei. These microorganisms are isolated swimming flagella, unencumbered by large structures such as a cell body (as in Chlamydomonas algae). We measure their 3D beating patterns using high-speed holographic microscopy and find a surprising diversity of waveforms. Structural chirality (handedness) in the flagellum is not manifested in the beat patterns. This interrupts the link between the molecular structure of the flagellum and its dynamics, which was believed to break left-right symmetry in developing embryos.
Keywords: digital holographic microscopy, low Reynolds number, ciliary and flagellar motion, malaria transmission
Abstract
Axonemes form the core of eukaryotic flagella and cilia, performing tasks ranging from transporting fluid in developing embryos to the propulsion of sperm. Despite their abundance across the eukaryotic domain, the mechanisms that regulate the beating action of axonemes remain unknown. The flagellar waveforms are 3D in general, but current understanding of how axoneme components interact stems from 2D data; comprehensive measurements of flagellar shape are beyond conventional microscopy. Moreover, current flagellar model systems (e.g., sea urchin, human sperm) contain accessory structures that impose mechanical constraints on movement, obscuring the “native” axoneme behavior. We address both problems by developing a high-speed holographic imaging scheme and applying it to the (male) microgametes of malaria (Plasmodium) parasites. These isolated flagella are a unique, mathematically tractable model system for the physics of microswimmers. We reveal the 3D flagellar waveforms of these microorganisms and map the differential shear between microtubules in their axonemes. Furthermore, we overturn claims that chirality in the structure of the axoneme governs the beat pattern [Hirokawa N, et al. (2009) Ann Rev Fluid Mech 41:53–72], because microgametes display a left- or right-handed character on alternate beats. This breaks the link between structural chirality in the axoneme and larger scale symmetry breaking (e.g., in developing embryos), leading us to conclude that accessory structures play a critical role in shaping the flagellar beat.
Flagella and cilia are ubiquitous across the eukaryotic domain. They perform critical roles such as the propulsion of microorganisms and sperm, sensory detection, and transport of fluids in the brain (1–3). Although the appearance of motile cilia and flagella can vary in different organisms, it is based on an underlying structural motif: a cylinder of nine microtubule doublets that move lengthwise relative to each other under the action of dynein molecules. The peripheral doublets in the axoneme often surround a central pair of singlet microtubules; the whole structure is then referred to as a “9+2” axoneme. Interestingly, motility does not seem to be contingent on the central microtubules. Motile flagella with three, one, or zero central microtubules (4, 5) have been reported. Dynein molecules are distributed along the length of each of the peripheral doublets asymmetrically. Viewed from the axoneme’s basal end, the dyneins are permanently anchored to one doublet and face its clockwise neighbor, where they can attach and move longitudinally. This structural chirality has been invoked as the underlying cause of symmetry breaking in developing embryos (6). Certain “nodal” cilia present in the early stages of development have been shown to rotate consistently in the same direction, counterclockwise, viewed from the basal end. The collective effect from many such cilia is unidirectional fluid circulation within the embryo, which has been posited to carry certain signaling molecules to their receptors (7). This symmetry breaking has been shown to have far-reaching consequences. Among other things, it leads to the familiar left-right patterning of organs in the human body (e.g., heart to the left, liver to the right). Although the link between functional cilia and symmetry breaking has been discussed for some time (8, 9), the proposed link between the axoneme’s structure and its motion is more speculative. We note that these nodal cilia do not have a central pair of microtubules (they are “9+0” axonemes), but the chirality in the dynein configuration is the same.
Indeed, although the structure and components of axonemes are fairly well known, the way in which these parts interact to produce beating action remains an open question. A range of medical conditions can arise from cilia and flagella malfunctioning. Understanding how beat patterns arise in correctly functioning axonemes is a critical step in understanding these “ciliopathies” (e.g., hydrocephalus, male and female infertility). Recent theoretical investigations into the hydrodynamics of beating flagella and cilia (10–12) have made progress in understanding the mechanical constraints governing these structures, how they interact, and what their optimal configurations might be. Several competing hypotheses have been advanced to describe the operating principles of a single flagellum (13–15), but these theories have only been tested by data from conventional (2D) videomicroscopy.
Another factor complicating analysis of experimental data arises from the choice of specimen, in that most experimental studies have used sperm in their model systems. However, sperm vary in morphology and demonstrate a wide variety of swimming patterns, even among the standard models. For example, human sperm tails beat in a quasiplanar fashion in typical physiological conditions (2); sea urchin sperm can adopt helical or planar beating patterns depending on external conditions (16), or more complex patterns in proximity to a surface (17); and quail sperm exhibit a self-similar hierarchy of meandering structures (18). The underlying “engine” is a 9+2 axoneme in all cases, but each has a particular set of accessory structures, such as the fibrous sheath found in human sperm (2). These structures alter the shape (and therefore the hydrodynamics) and introduce passive mechanical constraints to the axoneme, complicating modeling efforts. The biflagellated alga Chlamydomonas reinhardtii is another model system for eukaryotic flagella, for which a number of mutant strains are available. However, in the case of C. reinhardtii, the large cell body (diameter of ∼10 μm) is coupled hydrodynamically to the flagella, influencing their motion (19, 20).
We have overcome these problems by identifying a unique model system to give uncomplicated access to the beat pattern of a 9+2 axoneme. In recent years, proteomic surveys have revealed that the (male) microgametes of the rodent malaria parasite Plasmodium berghei may be a suitable candidate (21). In malaria and related Apicomplexan parasites, male and female cells (gametocytes) are taken up into the midgut when an insect vector, typically a mosquito, takes a blood meal from an infected host. In the midgut, gametes are rapidly generated (each male gametocyte produces up to eight microgametes within 10–20 min), and microgametes must find and fertilize female gametes within 30–60 min for the parasites to reach the next stage in their life cycle (22) (SI Text). The microgametes are assembled in the cytoplasm of the male cells and have no intraflagellar transport apparatus, such as that found in the alga C. reinhardtii (23). In fact, they are structurally simple microorganisms (sketches in Fig. 1 A–C). Wass et al. (21) record that the microgamete contains just four “compartments”: the nucleus, the axoneme, the cell membrane, and the cytoplasm. It therefore represents a type of “sperm” stripped down to a bare minimum of functioning components. Mitochondria, accessory structures, the intraflagellar transport apparatus, and a large accompanying “cell body” are all absent, making it an excellent limiting-case model system for understanding the axoneme. This is of particular interest in light of recent experiments where beating action was obtained from “artificial axonemes” composed of a small set of components, either robotic (24) or those containing just three key ingredients (microtubules, motors, and cross-linkers) plus an energy source (3, 25). The microgametes have a basal body composed of nine microtubule singlets (26), but unlike most sperm, there is no clearly defined “head” structure. The ultrastructure of the microgametes uncovered by cryo-EM studies (27) shows nuclear material distributed along the axoneme over a length of 1–2 μm. This reduces the effective cross-section of the microgamete, which may be an adaptation to facilitate easy movement between tightly packed RBCs in the mosquito midgut (SI Text).
Fig. 1.
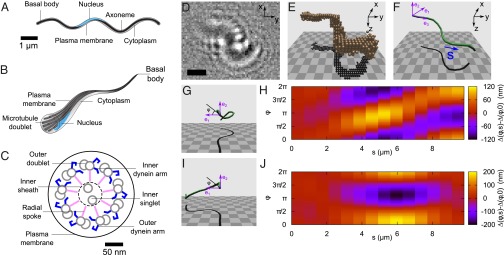
Longitudinal (A) and angled (B) cross-sectional illustrations show the simplicity of a typical P. berghei microgamete. The sketches are based on electron micrographs in studies by Straschil et al. (27) and Sinden et al. (26), and are labeled to show the key features of the flagellum. (C) Cross-sectional schematic diagram of a microgamete detailing the elements common to a typical 9+2 axoneme. The flagellar waveform is driven by microtubule doublets, which, in turn, are driven by the shearing force generated by the dynein arms. (D) Raw holographic data of a P. berghei microgamete. (Scale bar = 3 μm.) (E) Reconstructed volume pixels (voxels), derived from data in D, encompassing the volume occupied by the microgamete. The z axis is the illumination direction. (F) Segmented contour fitted to the voxel data in E. The contour length s increases from tail to head, and the purple axes show the material reference frame, with e3 lying along the gamete center line, in each segment. (G) Quasihelical waveform. At each joint, the material reference frame rotates about a line in the e1e2 plane, at an angle φ to the e1 axis. The e3 vector then points along the next segment. The material reference frame is thus fixed to the underlying structure of the gamete (the microtubules), which allows us to extract the differential shear at each joint. (H) Differential shear map corresponds to the waveform in G. In the absence of twist, the microtubules would lie parallel to the horizontal axis, at an unknown φ offset. The diagonal feature indicates that a wave of sliding has passed circumferentially around the gamete. (I) Example of a quasiplanar waveform. (J) Differential shear in the flagellum (analyzed in the same way as for H corresponding to the waveform in I).
To identify the mechanical processes underlying the beat pattern and the resulting large-scale swimming dynamics, accurate data on the shape and motion of the flagellum are required. Unfortunately, the beat frequency (typically 10–100 Hz) and the 3D nature of the waveform have proved too challenging for conventional approaches. Digital holographic microscopy (28, 29) allows 3D imaging at frame rates limited by the imaging device, which is a complementary metal oxide semiconductor (CMOS) camera in our case. As a consequence of their “minimal” construction, the microgametes are relatively small objects, ∼10 μm in length (L) and 200 nm in diameter (a) (27). Their refractive index is close to that of their surroundings, which places them within the Rayleigh–Gans (weak) scattering regime. In this regime, extended objects may be modeled as a superposition of scattering centers lying within the object’s volume (30). We used the Rayleigh–Sommerfeld back-propagation method to reconstruct the optical field away from the focal plane (31) and the Gouy phase anomaly method (32) to localize the microgamete in three dimensions (details are provided in Materials and Methods and SI Text). Unlike previous holographic studies that have tracked the average positions of microorganisms in three dimensions (28, 29, 33), our approach allows us to measure the position and configuration of the subjects so as to study the swimming strokes in detail.
The goal of this study was to measure and analyze the 3D dynamics of the model flagellar microswimmer P. berghei. We have developed a high-speed holographic microscope that we use to characterize swimming behavior. Using this instrument, we map the differential shear between microtubules in the flagellum in planar and helical waveforms. We also measure dynamic quantities, such as the beat frequency, beat wavelength, and wave speed, and overturn the hypothesis that chirality in the axoneme structure results in chiral flagellar waveforms.
Results and Discussion
Differential Shear Displacement.
By examining the instantaneous 3D geometry of a flagellar waveform, we measure the local differential shear displacement (2) between opposite sides of the axoneme, which can be used to estimate the underlying pattern of microtubule sliding. Fig. 1 D–F shows the results of reconstruction based on a single frame of raw data (Fig. 1D). A volume of interest (VOI) is extracted from the reconstructed optical field (Fig. 1E), and a contour is fitted through the center of mass of the VOI (Fig. 1F). This contour takes the form of joints (j) connected by segments (Tj) of a constant length Δs = 0.7 μm (more details and an error analysis are provided in SI Text). To infer the relative sliding of the underlying microtubules, we need to make some assumptions about the axoneme. First, we make a typical assumption that the energetic cost of twisting a straightened axoneme about its length is much higher than the cost of bending the same axoneme (11, 34). Second, we assume that the relative sliding is minimal (zero) at the basal body of the axoneme. We assign a “head” and “tail” to the axoneme and locate the basal body at the “tail”, based on observations of the release of microgametes, the swimming direction, and the shape of the microorganism; this is described in further detail in the section on dynamics. We use the variable s to denote position along the fitted contour, ranging from s = 0 (passive, “tail”) to s = L (active, “head”). Third, we assume that only the lowest wavenumber azimuthal modes are allowed (35). In other words, when the axoneme bends, doublets on the inside of the bend slide forward relative to the centerline and those on the outside slide backward; the others vary smoothly between these extrema. With these assumptions in place, we define a material reference frame (36) that maps to the underlying microtubules, specified by the unit vectors (e1, e2, e3) (Fig. 1F). To infer structural deformations, we examine how this material frame is transformed as we pass along the contour, from s = 0 → L. At each joint, the material frame is rotated about a vector located in the e1e2 plane; this vector is oriented at an angle φ to the e1 axis (Fig. 1 G and I). The material reference frame is rotated about this line, through an angle θ, so that after the rotation, the e3 axis points along the next segment of the contour.
Given this 3D representation of the microgamete, we can map the differential shear (2, 37),  . This quantity describes the relative sliding of microtubules that produces a particular waveform, in the absence of shearing at the basal body [denoted
  ] and twist. This highlights the regions where peripheral microtubules would be displaced relative to the centerline, as a function of s and position around the axoneme circumference φ. Fig. 1 G and H shows a reconstructed frame with a largely helical configuration, with its corresponding pattern of differential shear displacement, and Fig. 1 I and J shows a reconstructed frame with a largely planar configuration, with its corresponding pattern of differential shear displacement. Both of these frames were taken from the same gamete and occurred 2 s apart in a video sequence. This change in the flagellar waveform between two relatively closely spaced times is quite remarkable, given that waveforms are usually classified as either planar or helical. The absence of mechanical accessory structures in this microgamete allows a broad variety of waveforms, showing the versatility of the bare axoneme.
Dynamics.
By measuring the geometry of flagellar waveforms with high temporal resolution (500 Hz to 1 kHz), we can examine how flagellar beats initiate and propagate (Movies S1 and S2). As previously observed elsewhere, the microgametes swim in two distinctive modes, fast and slow (38). These swimming modes appear to transport the microgamete in opposite directions, and the forward (or fast) mode was the most prevalent. Fig. 2A shows a spatiotemporal map of flagellar curvature during fast beating. Vector manipulation gives the external bending angle between consecutive segments, Tj and Tj+1, as a function of s and time. Waves of curvature clearly propagate from head to tail as the microgamete swims, demonstrated by light-colored bands inclined from the upper right to lower left. Based on the swimming direction of the axoneme, we can infer the position of the basal body: When the microgametes are released (exflagellate) from the gametocyte, they are initially anchored within the cell by the basal body from which they are constructed. As they swim away, the leading “head” end of the microgamete is noticeably more active than the trailing end. More evidence of this is given in the section on average motility parameters, where we find that the basal region shows a smaller average curvature (implying a higher bending stiffness or resistance to sliding).
Fig. 2.

(A) Exterior angle θ (Left), as indicated (Right), between two adjacent segments as a function of contour length s (micrometers) and time (seconds). The bright bands inclined from the upper right to the lower left show waves of curvature passing along the gamete from the “head” end (s = L) to the “tail” end (s = 0) of the gamete. (B) Power spectrum of curvature fluctuations, with harmonic components as indicated. P.S.D., power spectral density. (C) Deviation from linear swimming speed. A straight-line fit was performed to 4 s of center-of-mass displacement data to find a straight line speed of 6.2 μm/s. This graph of residuals (rCM − vCMt) shows no evidence of the beat frequency in the center-of-mass displacement.
A curious aspect of fast beating is that the waves of curvature propagate toward the basal body rather than away from it. To our knowledge, this is unique among sperm documented in the literature [although it has been observed in other microorganisms, such as trypanosomes (39)]. This beat pattern may facilitate the microgamete’s exploration of a convoluted substrate (e.g., close-packed RBCs) when searching for female gametes in the blood meal (SI Text and Fig. S1). It is energetically efficient to explore an environment and look for paths of least resistance to travel along, and a recent investigation into the motility of the parasite Trypanosoma brucei (40) has shown that swimming speed can be enhanced by the presence of a microstructured substrate (in that case, a 2D array of micropillars).
Fig. 2B shows the power spectrum of these curvature fluctuations (averaged over all s values) with dominant harmonic components at 11.3 Hz and 24.9 Hz. Although the beating is clearly periodic, the displacement of the microgamete’s center of mass does not share this periodicity and is fairly constant as a function of time. Fig. 2C shows the deviation from a constant swimming speed. A microgamete’s center of mass was calculated in each frame over a period of 4 s, yielding a straight-line swimming speed of 6.2 μm/s. The graph shows the deviation of the center-of-mass position from the predicted displacement; no periodic fluctuation of the displacement is apparent.
Waveform Chirality.
The 3D nature of our data allows us to obtain quantities that are inaccessible to standard 2D microscopy. We define a local chirality, H, as the angle between a segment (Tj) and the plane formed by the two previous segments (defined by Tj−2 ∧ Tj−1; Fig. 3 A and B). Fig. 3C shows a spatiotemporal map of chirality derived from the same data as Fig. 2. The map shows propagating waves of alternating handedness, indicated by the sequential red and blue bands (Fig. 3C); these waves are of the same frequency and phase as the bending waves shown in Fig. 2A. The ability to change chirality seems to be a generic feature of microgamete motion because we observed this in every individual in our dataset (n = 24), both in fast- and slow-beating modes. The periodic reversal is somewhat unexpected in light of the axoneme’s structural chirality. In contrast to recent theories and experiments suggesting that symmetry breaking in developing embryos occurs because chirality is hard-wired into the axoneme structure (6, 7), we find no evidence of fixed chirality in this mechanically simple axonemal flagellum. We therefore suggest that, in general, mechanical accessory structures are responsible for symmetry breaking. Previous studies of more complex cells, such as sea urchin sperm (17) and trypanosomes (39), have inferred chiral properties from differential interference contrast (DIC) and dark-field images. However, the beat pattern of P. berghei microgametes is more complex, with no discernible beat plane and varying amounts of planarity in successive beats. Movie S3 has been arranged to demonstrate this aspect of motility. The contour in Movie S3 has been translated and rotated so that the head and tail points of the microgamete overlap on a straight line pointing away from the observer. Successive beats are seen as prominences that intersect this point, appearing as loops of varying area, according to how helical the particular wave is. Curiously, we find no discernible pattern in the orientation or shape of these waves; although successive waves have opposite chirality, their shapes are dissimilar.
Fig. 3.

(A and B) Demonstration of how we define local chirality using three contiguous segments of the contour. H is the angle between the third segment and the plane of the first two segments. The sign is determined as positive (right-handed) if Tj lies in the same half-space as the cross-product Tj−2 ∧ Tj−1 and as negative (left-handed) if not. (C) Temporal pattern of local chirality as a function of contour length s and time. The bands correspond to those in Fig. 2A, but waves alternate in time between left- and right-handed character. deg, degrees. (D) Raw data correspond to a left-handed waveform with holographic reconstruction in E. (F and G) Raw and reconstructed data for a right-handed structure. Note the superficial similarity of D and F; the fundamental difference in the waveform is revealed only with holographic reconstruction. The photos (D and F) are 17 μm on a side.
To clarify the notion of handedness in flagellar waveforms further, Fig. 3D shows an example of a single frame of data with a left-handed character; segments in the reconstruction in Fig. 3E have been colored according to the scheme in Fig. 3C to indicate local chirality. Fig. 3 F and G shows raw and reconstructed data for a purely right-handed waveform. The handedness of the waveform is not easily attainable from the raw data but may be quantified using the holographic reconstruction. The two segments nearest the (x, y) origin in each reconstruction (obscured in Fig. 3E) are colored black, because two preceding segments are required to establish chirality.
Average Motility Parameters.
The reconstruction of a segmented contour enables unequivocal measurements of motility parameters. In Fig. 4, we show average values of some parameters obtained from our set of 24 individuals, moving in forward (F) and reverse (R) directions. The frequency, wave speed, and center-of-mass velocity are markedly dissimilar in these different modes (Fig. 4). Interestingly, the characteristic length of curvature fluctuations (“wavelength”) is similar in both cases (averaging 5.6 μm in forward and 4.5 μm in reverse), which matches the diameter of murine RBCs (4–7 μm) (41). Again, this is suggestive that microgametes may have evolved an adaptation in which swimming speed is enhanced by friction generated from mechanical interactions between cells and obstacles in the environment (40) (more details are provided in SI Text).
Fig. 4.

(A) Principle beat frequency component of forward (F) and reverse (R) microgamete waveforms. (B) Speed at which waves of curvature propagate along the microgamete (Materials and Methods). (C) Resulting characteristic wavelength, found by dividing wave speed by frequency. (D) Speed of the microgamete’s center of mass over a linear trajectory of around 20 μm. (E) Average curvature of forward-swimming gametes as a function of the normalized contour length (contour length s/microgamete total length L). In A–E, each point represents data from a different microgamete (from five independent infections). The boxes in A–D represent a mean value (±SEM) of forward and reverse swimming directions. The boxes in E represent data binned in increments of Δs/L = 0.08 (±SEM).
Fig. 4E shows the average curvature  as a function of contour length. We only show data from forward swimmers because the number of reverse swimmers is smaller (n = 5 compared with n = 19 for the forward swimmers). The smaller sample size and lower beat frequency lead to inconclusive
  data in reverse swimmers. There is a clear head/tail asymmetry, where the average curvature increases toward the “head” (s = L) end of the microgamete and is independent of the actual physical length. This adds extra support to our claim that the relative sliding of microtubules is smaller at the trailing end of the gamete (which contains the basal body). The curvature data are normalized by the total microgamete length L because there is considerable variation (14%) in the length of microgametes (L = 8.4 ± 1.4 μm) that cannot be explained by measurement error (estimated at ±100 nm). This may be a result of variation in the number of microtubules available, or accuracy possible, in the short time available for microgamete synthesis.
Conclusions
We have used high-speed digital holographic microscopy to investigate the 3D dynamics of a eukaryotic flagellum. This method allows us to characterize the waveforms and swimming behavior of the microorganism, as well as giving insight into the action of the underlying microtubules. In presenting our results, we also introduce P. berghei microgametes as model microswimmers. To our knowledge, they are the simplest naturally occurring example of a swimming axoneme (in mechanical terms at least). As a result, they do not suffer from the shortcomings of other models, for example, sea urchin sperm cells or the alga C. reinhardtii, where flagella are attached to a large, hydrodynamically important cell body (19, 20). Furthermore, the microgametes lack mechanical accessory structures that may help to guide the flagellar beat, instead allowing the axoneme to behave in a less constrained fashion. Last, in contrast to prior assertions regarding a closely related structure, we find that the chirality of the 9+2 axoneme structure does not directly transfer to the overall beating motion. Although both left- and right-handed waveforms have been observed in other species, the use of a mechanically unconstrained flagellum demonstrates that there is no inherent bias in chirality coming from the axoneme. This result, along with the general irregularity of the beat pattern, suggests that mechanical accessory structures play crucial but overlooked roles in determining the dynamics of flagella. This has implications not only for analyzing swimming behavior but for understanding the root causes of symmetry breaking in developing embryos.
Materials and Methods
Microgamete Preparation.
We used the rodent malaria parasite P. berghei, line 820cl1m1cl1 (42). Infections were initiated in male MF1 mice (8–10 wk old), which had been pretreated with phenylhydrazine at 120 mg/kg (2 d before infection) to enhance the production of gametocytes (43). Five independent infections were initiated with 107 parasitized RBCs. Infected blood was collected by tail snip when gametocytes reached maturity (day 4 or 5 postinfection). To stimulate the differentiation of gametocytes into microgametes for each sample, 2 μL of infected blood was added to 1 mL of complete ookinete culture media [900ul RPMI + 100ul FCS (pH 8)] and incubated at 21 °C (44). All of the work involving mice was carried according to the Animals (Scientific Procedures) Act, 1986 and approved by Edinburgh University.
Microscope and Optical Setup.
Experiments were performed on a Nikon Ti inverted microscope, with a 60× magnification water immersion objective lens, as described elsewhere (32). Illumination was provided by a Thorlabs M660L2 high-power light-emitting diode, with a peak emission wavelength of  nm and an FWHM bandwidth of ∼40 nm.
Data Acquisition.
A Mikrotron MC-1362 monochrome CMOS camera was used to record video images; the camera was connected to a frame grabber card with 1 GB of onboard random-access memory. Video data were initially acquired at 1 kHz with an exposure time of 0.994 ms, but this appeared to be a significant oversampling of the motion of the microgametes. In further experiments, we decreased the frame rate to 500 Hz (1.994-ms exposure time), which was entirely sufficient to capture the dynamics of the beating pattern. No distinction was observed between data taken at different frame rates. Imaging a standard reference chart allowed us to calibrate our image sampling frequency (pixel spacing) as 4.29 pixels per micrometer.
Preliminary Image Processing.
Video recordings were edited by hand to extract regions of ∼30 μm on a side with microgametes in them. An example region is shown in Movie S4. For each reduced video recording, a background frame was obtained by averaging a series of images of the same subregion from a period when the microgamete was not present in the images. Pixel values in frames containing microgametes were then normalized (divided) by their values in the background frames to remove the static background contribution in the image and improve the overall signal-to-noise ratio.
Holographic Reconstruction.
From each frame, a stack of reconstructed image planes was generated, spaced Δz = 0.233 μm apart. This resulted in an image stack with the same sampling frequency (4.29 samples per micrometer) in x, y, and z. An example image stack is shown in Movie S5.
Image Processing.
The image stacks were then subjected to several steps of processing. We first applied spatial bandpass filters in the x–y plane to remove high-frequency pixel noise. We then took the intensity gradient in the z direction,  , as in previous work (32). Next, we performed a Gaussian fit on each column of volume pixels (voxels) in the stack at particular xy coordinates [Ixy(z)] to isolate the point of highest intensity in the z direction. This volume containing “bright” pixels, one per xy address, was convolved with a 3D Hanning filter. The procedure of fitting and convolution was repeated. The brightest region in the volume was extracted, starting at the voxel with maximum intensity and stepping outward until the intensity dropped to zero. This VOI was then ready for contour fitting.
Contour Fitting.
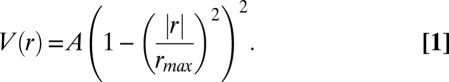
The VOI extracted in the image processing step was reduced and then fitted piecewise with straight line segments. To reduce the size of the VOI, each voxel within it was modeled as the source of a truncated scalar potential, with a radial profile given by
 |
This potential was evaluated at every point in the stack.
It should be noted that the VOI shown in Fig. 1E depicts the locations, but not weights, of the voxels. Voxels near the center of this VOI have a significantly stronger weighting (A) than those at the edges. Locations where the potential was greater than a threshold value were set to 1, and those with lower potential were set to zero. The active voxel furthest from the center of mass was used as a starting point, and the VOI was stepped through in increments of Δs = 0.7 μm, tracing the locus of points that lie inside the VOI, furthest from its surface. This chain of points (not including the starting point) makes up the estimate of the microgamete position in each frame.
Data Analysis.
Motility parameters (Fig. 4) were extracted from curvature data similar to the representative set in Fig. 2A. To obtain beat frequency, we found curvature as a function of time at each contour joint j and took the power spectrum. A single data point in Fig. 4A represents the mean power spectra over all j values for one microgamete. Wave speed was found by examining the phase of the principal frequency component as a function of j for each microgamete. As waves propagate along the flagellum, there is a phase lag between consecutive joints. Thus, the wave speed was calculated from the distance between each joint, the phase at each joint, and the frequency. Wavelength was found by dividing wave speed by frequency. Although the microgamete never truly adopts a sine-wave shape, the wavelength is a valid characteristic length scale.
Supplementary Material
Acknowledgments
We extend special thanks to W. C. K. Poon for the loan of equipment and introducing the authors. We also thank T. A. Wood and A. P. Waters for helpful discussions, C. J. Brokaw and C. K. Omoto for suggestions regarding the geometrical analysis, and Francesca Bourne for help with Fig. 1. L.G.W. was supported by the Rowland Institute at Harvard; L.M.C. was supported by the Natural Environment Research Council; and S.E.R. was supported by the Wellcome Trust (WT082234MA), The Royal Society, and the Centre for Infection, Immunity, and Evolution at the University of Edinburgh.
Footnotes
The authors declare no conflict of interest.
This article is a PNAS Direct Submission. R.E.G. is a guest editor invited by the Editorial Board.
This article contains supporting information online at www.pnas.org/lookup/suppl/doi:10.1073/pnas.1309934110/-/DCSupplemental.
References
- 1.Satir P. Studies on cilia ii. Examination of the distal region of the ciliary shaft and the role of the filaments in motility. J Cell Biol. 1965;26(3):805–834. doi: 10.1083/jcb.26.3.805. [DOI] [PMC free article] [PubMed] [Google Scholar]
- 2.Gaffney E, Gâdelha H, Smith D, Blake J, Kirkman-Brown J. Mammalian sperm motility: Observation and theory. Annu Rev Fluid Mech. 2011;43:501–528. [Google Scholar]
- 3.Sanchez T, Welch D, Nicastro D, Dogic Z. Cilia-like beating of active microtubule bundles. Science. 2011;333(6041):456–459. doi: 10.1126/science.1203963. [DOI] [PMC free article] [PubMed] [Google Scholar]
- 4.Marchese-Ragona S, Glazzard A, Holwill M. Motile characteristics of 9+2 and 9+1 flagellar axonemes of Crithidia oncopelti. J Exp Biol. 1989;145(1):199–213. [Google Scholar]
- 5.Michalik P, Alberti G. On the occurrence of the 9+0 axonemal pattern in the spermatozoa of sheetweb spiders (Araneae, Linyphiidae) Journal of Arachnology. 2005;33(2):569–572. [Google Scholar]
- 6.Hirokawa N, Okada Y, Tanaka Y. Fluid dynamic mechanism responsible for breaking the left-right symmetry of the human body: The nodal flow. Annu Rev Fluid Mech. 2009;41:53–72. [Google Scholar]
- 7.Hirokawa N, Tanaka Y, Okada Y, Takeda S. Nodal flow and the generation of left-right asymmetry. Cell. 2006;125(1):33–45. doi: 10.1016/j.cell.2006.03.002. [DOI] [PubMed] [Google Scholar]
- 8.Afzelius BA. A human syndrome caused by immotile cilia. Science. 1976;193(4250):317–319. doi: 10.1126/science.1084576. [DOI] [PubMed] [Google Scholar]
- 9.Nonaka S, et al. De novo formation of left-right asymmetry by posterior tilt of nodal cilia. PLoS Biol. 2005;3(8):e268. doi: 10.1371/journal.pbio.0030268. [DOI] [PMC free article] [PubMed] [Google Scholar]
- 10.Osterman N, Vilfan A. Finding the ciliary beating pattern with optimal efficiency. Proc Natl Acad Sci USA. 2011;108(38):15727–15732. doi: 10.1073/pnas.1107889108. [DOI] [PMC free article] [PubMed] [Google Scholar]
- 11.Eloy C, Lauga E. Kinematics of the most efficient cilium. Phys Rev Lett. 2012;109(3):038101. doi: 10.1103/PhysRevLett.109.038101. [DOI] [PubMed] [Google Scholar]
- 12.Elgeti J, Gompper G. Emergence of metachronal waves in cilia arrays. Proc Natl Acad Sci USA. 2013;110(12):4470–4475. doi: 10.1073/pnas.1218869110. [DOI] [PMC free article] [PubMed] [Google Scholar]
- 13.Riedel-Kruse IH, Hilfinger A, Howard J, Jülicher F. How molecular motors shape the flagellar beat. HFSP J. 2007;1(3):192–208. doi: 10.2976/1.2773861. [DOI] [PMC free article] [PubMed] [Google Scholar]
- 14.Brokaw CJ. Thinking about flagellar oscillation. Cell Motil Cytoskeleton. 2009;66(8):425–436. doi: 10.1002/cm.20313. [DOI] [PubMed] [Google Scholar]
- 15.Lindemann CB. Experimental evidence for the geometric clutch hypothesis. Curr Top Dev Biol. 2011;95:1–31. doi: 10.1016/B978-0-12-385065-2.00001-3. [DOI] [PubMed] [Google Scholar]
- 16.Woolley DM, Vernon GG. A study of helical and planar waves on sea urchin sperm flagella, with a theory of how they are generated. J Exp Biol. 2001;204(Pt 7):1333–1345. doi: 10.1242/jeb.204.7.1333. [DOI] [PubMed] [Google Scholar]
- 17.Cosson J, Huitorel P, Gagnon C. On the contribution of dynein-like activity to twisting in a three-dimensional sliding filament model. Cell Motil Cytoskeleton. 2003;54(1):56–63. doi: 10.1002/cm.10085. [DOI] [PubMed] [Google Scholar]
- 18.Woolley DM. A novel motility pattern in quail spermatozoa with implications for the mechanism of flagellar beating. Biol Cell. 2007;99(12):663–675. doi: 10.1042/BC20070050. [DOI] [PubMed] [Google Scholar]
- 19.Polin M, Tuval I, Drescher K, Gollub JP, Goldstein RE. Chlamydomonas swims with two “gears” in a eukaryotic version of run-and-tumble locomotion. Science. 2009;325(5939):487–490. doi: 10.1126/science.1172667. [DOI] [PubMed] [Google Scholar]
- 20.Bayly PV, et al. Propulsive forces on the flagellum during locomotion of Chlamydomonas reinhardtii. Biophys J. 2011;100(11):2716–2725. doi: 10.1016/j.bpj.2011.05.001. [DOI] [PMC free article] [PubMed] [Google Scholar]
- 21.Wass MN, et al. Proteomic analysis of Plasmodium in the mosquito: Progress and pitfalls. Parasitology. 2012;139(9):1131–1145. doi: 10.1017/S0031182012000133. [DOI] [PMC free article] [PubMed] [Google Scholar]
- 22.Sinden RE. The cell biology of sexual development in Plasmodium. Parasitology. 1983;86(Pt 4):7–28. doi: 10.1017/s0031182000050824. [DOI] [PubMed] [Google Scholar]
- 23.Cole DG. The intraflagellar transport machinery of Chlamydomonas reinhardtii. Traffic. 2003;4(7):435–442. doi: 10.1034/j.1600-0854.2003.t01-1-00103.x. [DOI] [PubMed] [Google Scholar]
- 24.Sareh S, Rossiter J, Conn A, Drescher K, Goldstein RE. Swimming like algae: Biomimetic soft artificial cilia. J R Soc Interface. 2012;10(78):20120666. doi: 10.1098/rsif.2012.0666. [DOI] [PMC free article] [PubMed] [Google Scholar]
- 25.Sanchez T, Chen DT, DeCamp SJ, Heymann M, Dogic Z. Spontaneous motion in hierarchically assembled active matter. Nature. 2012;491(7424):431–434. doi: 10.1038/nature11591. [DOI] [PMC free article] [PubMed] [Google Scholar]
- 26.Sinden RE, Talman A, Marques SR, Wass MN, Sternberg MJ. The flagellum in malarial parasites. Curr Opin Microbiol. 2010;13(4):491–500. doi: 10.1016/j.mib.2010.05.016. [DOI] [PubMed] [Google Scholar]
- 27.Straschil U, et al. The Armadillo repeat protein PF16 is essential for flagellar structure and function in Plasmodium male gametes. PLoS ONE. 2010;5(9):e12901. doi: 10.1371/journal.pone.0012901. [DOI] [PMC free article] [PubMed] [Google Scholar]
- 28.Xu W, Jericho MH, Meinertzhagen IA, Kreuzer HJ. Digital in-line holography for biological applications. Proc Natl Acad Sci USA. 2001;98(20):11301–11305. doi: 10.1073/pnas.191361398. [DOI] [PMC free article] [PubMed] [Google Scholar]
- 29.Sheng J, et al. Digital holographic microscopy reveals prey-induced changes in swimming behavior of predatory dinoflagellates. Proc Natl Acad Sci USA. 2007;104(44):17512–17517. doi: 10.1073/pnas.0704658104. [DOI] [PMC free article] [PubMed] [Google Scholar]
- 30.Bohren C, Huffman D. Absorption and Scattering of Light by Small Particles. New York: John Wiley & Sons; 1983. [Google Scholar]
- 31.Lee S-H, Grier DG. Holographic microscopy of holographically trapped three-dimensional structures. Opt Express. 2007;15(4):1505–1512. doi: 10.1364/oe.15.001505. [DOI] [PubMed] [Google Scholar]
- 32.Wilson L, Zhang R. 3D localization of weak scatterers in digital holographic microscopy using Rayleigh-Sommerfeld back-propagation. Opt Express. 2012;20(15):16735–16744. [Google Scholar]
- 33.Su TW, Xue L, Ozcan A. High-throughput lensfree 3D tracking of human sperms reveals rare statistics of helical trajectories. Proc Natl Acad Sci USA. 2012;109(40):16018–16022. doi: 10.1073/pnas.1212506109. [DOI] [PMC free article] [PubMed] [Google Scholar]
- 34.Hines M, Blum JJ. On the contribution of dynein-like activity to twisting in a three-dimensional sliding filament model. Biophys J. 1985;47(5):705–708. doi: 10.1016/S0006-3495(85)83967-9. [DOI] [PMC free article] [PubMed] [Google Scholar]
- 35.Hilfinger A, Jülicher F. The chirality of ciliary beats. Phys Biol. 2008;5(1):016003. doi: 10.1088/1478-3975/5/1/016003. [DOI] [PubMed] [Google Scholar]
- 36.Powers T. Dynamics of filaments and membranes in a viscous fluid. Rev Mod Phys. 2010;82(2):1607–1631. [Google Scholar]
- 37.Omoto CK. Mechanochemical coupling in cilia. Int Rev Cytol. 1991;131:255–292. doi: 10.1016/s0074-7696(08)62021-5. [DOI] [PubMed] [Google Scholar]
- 38.Sinden RE, Croll NA. Cytology and kinetics of microgametogenesis and fertilization in Plasmodium yoelii nigeriensis. Parasitology. 1975;70(1):53–65. doi: 10.1017/s0031182000048861. [DOI] [PubMed] [Google Scholar]
- 39.Rodríguez JA, et al. Propulsion of African trypanosomes is driven by bihelical waves with alternating chirality separated by kinks. Proc Natl Acad Sci USA. 2009;106(46):19322–19327. doi: 10.1073/pnas.0907001106. [DOI] [PMC free article] [PubMed] [Google Scholar]
- 40.Heddergott N, et al. Trypanosome motion represents an adaptation to the crowded environment of the vertebrate bloodstream. PLoS Pathog. 2012;8(11):e1003023. doi: 10.1371/journal.ppat.1003023. [DOI] [PMC free article] [PubMed] [Google Scholar]
- 41.Foster H, Small JD, Fox J, editors. The Mouse in Biomedical Research. Vol 3. New York: Academic Press; 1983. [Google Scholar]
- 42.Ponzi M, et al. Egress of Plasmodium berghei gametes from their host erythrocyte is mediated by the MDV-1/PEG3 protein. Cell Microbiol. 2009;11(8):1272–1288. doi: 10.1111/j.1462-5822.2009.01331.x. [DOI] [PubMed] [Google Scholar]
- 43.Reece SE, Drew DR, Gardner A. Sex ratio adjustment and kin discrimination in malaria parasites. Nature. 2008;453(7195):609–614. doi: 10.1038/nature06954. [DOI] [PMC free article] [PubMed] [Google Scholar]
- 44.Janse CJ, et al. In vitro formation of ookinetes and functional maturity of Plasmodium berghei gametocytes. Parasitology. 1985;91(Pt 1):19–29. doi: 10.1017/s0031182000056481. [DOI] [PubMed] [Google Scholar]
Associated Data
This section collects any data citations, data availability statements, or supplementary materials included in this article.