

Significance
The study of mRNA and microRNA (miRNA) expression profiles of cells and tissue has become a major tool for therapeutic development. The results of such experiments are expected to change the methods used in the diagnosis and prognosis of disease. We introduce surprisal analysis, an information-theoretic approach grounded in thermodynamics, to compactly transform the information acquired from microarray studies into applicable knowledge about the cancer phenotypic state. The analysis of mRNA and miRNA expression data from ovarian serous carcinoma, prostate adenocarcinoma, breast invasive carcinoma, and lung adenocarcinoma cancer patients and organ-specific control patients identifies cancer-specific signatures. We experimentally examine these signatures and their respective networks as possible therapeutic targets for cancer in single-cell experiments.
Keywords: microarray, deep sequencing, network connectivity, biomarker, maximal entropy
Abstract
Toward identifying a cancer-specific gene signature we applied surprisal analysis to the RNAs expression behavior for a large cohort of breast, lung, ovarian, and prostate carcinoma patients. We characterize the cancer phenotypic state as a shared response of a set of mRNA or microRNAs (miRNAs) in cancer patients versus noncancer controls. The resulting signature is robust with respect to individual patient variability and distinguishes with high fidelity between cancer and noncancer patients. The mRNAs and miRNAs that are implicated in the signature are correlated and are known to contribute to the regulation of cancer-signaling pathways. The miRNA and mRNA networks are common to the noncancer and cancer patients, but the disease modulates the strength of the connectivities. Furthermore, we experimentally assessed the cancer-specific signatures as possible therapeutic targets. Specifically we restructured a single dominant connectivity in the cancer-specific gene network in vitro. We find a deflection from the cancer phenotype, significantly reducing cancer cell proliferation and altering cancer cellular physiology. Our approach is grounded in thermodynamics augmented by information theory. The thermodynamic reasoning is demonstrated to ensure that the derived signature is bias-free and shows that the most significant redistribution of free energy occurs in programming a system between the noncancer and cancer states. This paper introduces a platform that can elucidate miRNA and mRNA behavior on a systems level and provides a comprehensive systematic view of both the energetics of the expression levels of RNAs and of their changes during tumorigenicity.
Transcriptomic technologies enable effective molecular phenotyping of cancers, providing novel insights into the disease that are both experimentally and clinically relevant. One key outcome of such studies is biomarker discovery (1–4). An up to date discussion of the different approaches can be found in ref. 5. Despite the progress in analysis it is still the case that aggressive tumors do not respond well to currently available therapeutics (6), and the need to identify potential cancer targets remains (7). Analytical methods for processing transcriptomic datasets that illuminate novel biology are therefore critically important to the field and may help develop better therapeutics and disease treatment options. Consequently, numerous tools exist and additional efforts are underway to develop increasingly informative methods. (Additional discussion of the different approaches can be found in SI Appendix, section I).
Analytical methods often seek to learn new biology from transcriptomic data by focusing on differential transcript abundance (typically reported as fold change) between experimental (i.e., diseased) and reference (i.e., nondiseased) samples. An emphasis on fold change (usually above a minimal threshold) can identify cellular functions associated with a disease process. However, transcripts showing large fold change carry greater influence in the analysis at the expense of those abundant species that may have shown significant change in abundance but not a high degree of fold change. The issue is that a low-abundance transcript showing a large fold change in abundance between experimental and control samples is identified as more important for discriminating between cellular states than an equal or greater change in abundance of a strongly expressed transcript showing a far smaller fold change. However, absolute expression level and fold change may both contain information about the physiological phenomena, and, it is impossible to argue (without a complete understanding of cellular physiology) which of the two observations is more relevant. Unbiased, principled approaches are therefore desirable.
Surprisal analysis is one such unbiased approach. Although the application of surprisal analysis to in vitro transcriptomic data has been previously described in detail (8), for the purpose of this manuscript we highlight the more relevant key elements of this approach as it relates to transcript expression profiles of patients. First, it is worth noting that this method has roots in both thermodynamics and information theory and has been used extensively starting with the analysis of specificity and selectivity in elementary chemical reactions (9). Second, as in its application to physical and chemical systems, the application of surprisal analysis to biological systems is built on the premise that these systems will tend toward a state of maximal entropy within the bounds imposed by one or more constraints. In biological systems, the constraints are not currently known but can be thought of as cellular design features, ultimately encoded within the genome that provide bounds on molecular phenotypes. The system is thus in a state of constrained equilibrium. It is not a true equilibrium because of the presence of constraints. Just as in its application to physical and chemical systems, even one constraint can enforce a state of constrained equilibrium that is qualitatively distinct from other possible states of the biological system. In the case of transcriptomic data, such molecular constraints are in essence phenotypes that can each be represented by a certain profile of transcript abundance. Constraints are not static and can change in response to genetic and environmental perturbations. By invoking the premise of maximal entropy stated above, any change to the constraints will be followed by a move of the system toward a new state of constrained equilibrium. At the molecular level these changes of state will be reflected in differential abundance of transcripts following systems response to environmental stimuli.
Further, surprisal analysis defines a special state termed “the balance state.” Biologically, this corresponds to a state in which transcript levels are not changing, within the bounds of the experimental time course. In surprisal analysis this state is directly inferred from the experimental data. By analogy to thermodynamic equilibrium states of well-defined physical systems, we can assign a thermodynamic weight for each transcript from its abundance in the balance state. Abundant transcripts contribute more weight than those expressed at low levels. So defined, the balance state serves as an internal thermodynamic reference point against which measured transcript abundance can be compared. Differences between the measured transcript abundance and the inferred abundance in the balance state reflect the influence of one or more constraints. In addition to inferring a balance state, surprisal analysis simultaneously determines a parsimonious set of transcriptional phenotypes or patterns and associated weights that can be used to mathematically relate measured transcript abundance to balance state values to within the accuracy allowed by experimental noise (10). The result is a mathematical representation and compaction of the experimental data that can be used, not only in the context of data analysis but also to make predictions regarding how targeted perturbations to the system might influence the system. Examples of previous such applications include the prediction of the effect of a limited perturbation such as the addition of a drug (11) or of the work required to drive the cell to a given phenotype (12).
In summary, a key component of surprisal analysis is that it enables the ranking of the transcripts according to their abundance and also a characterization of their fold change. These two contributions are the balance state and the deviations from it, respectively.
In this paper, we apply surprisal analysis to the coordinated analysis of messenger RNA (mRNA) and microRNA (miRNA) expression data of cancer patients from ovarian serous carcinoma, prostate adenocarcinoma, breast invasive carcinoma, and lung adenocarcinoma patients and to the expression profiles of tissue-specific, noncancer controls. We identified a cancer-specific transcriptional pattern phenotype that we call a disease signature. The cancer-specific signature consists of about a hundred genes that have a significant contribution to the cancer state and that reliably distinguishes between noncancer and cancer patients. The top most deviations from the balance state are found to be from 20 genes affiliated with the biological hallmarks of the cancer machinery. Using the Gene Ontology tool (13) we determine that these RNAs contribute to the regulating of the cellular cancer-signaling pathways.
In addition to uncovering previously undescribed mRNA and miRNA therapeutic targets we suggest that the disease signature also reveals modulations of the connectivity in miRNA and mRNA networks in human cancers. Furthermore, we uncover correlative behavior between the miRNAs and the cancer-specific mRNA signatures; mRNAs present in a cancer-specific mRNA signature display complimentary conserved binding sites specific to miRNAs present in the cancer-specific miRNA signatures. To validate these last findings we designed gene-silencing experiments where we demonstrate experimentally that modifying even a single biomolecule connection in the cancer-specific gene network reverses the cancer state phenotype, reducing cancer cell proliferation and altering cancer cell physiology in vitro and on a single-cell level.
Results
Surprisal Analysis.
The results are based on surprisal analysis (8, 14) as given in Eq. 1. The essence is that we identify a balanced state level, and the measured expression level of mRNA (or miRNA) i for patient n,  , is expressed with respect to the balanced state as
Here  is the inherent reference value, the level of RNA i in the balance state. Thermodynamically, the balanced state is a reference common to all phenotypes and all patients. As further discussed in the next section and in SI Appendix, section II,
  is the thermodynamic weight of RNA i in patient n. In the next paragraph we devote considerable attention to validating this thermodynamic concept in cells of human patients and specifically showing that the reference value as inferred from measured levels does not significantly vary with the patient index n. It is convenient to write the expression level in the balance state as
  .
.
In Eq. 1,
 is the potential of patient n in the dominant phenotype. Patient variability for a given phenotype is expressed by the dependence of
  on the patient index n. The limited patient variability is shown by the variation between different columns in the heat maps shown in Figs. 1 and 2.
  is the contribution of mRNA (or miRNA) i to the dominant phenotype. The dependence on the index i is shown by the variation between different rows in the heat maps shown in Figs. 1 and 2. The residual in Eq. 1 can be the contribution of ongoing secondary processes and may also be corrupted by experimental noise (10) in which case just the dominant phenotype suffices to account for the data to within its known accuracy.
Fig. 1.

The cancer-specific mRNA signature distinguishes diseased and healthy patients. (A) The heat map shows the twenty most up-regulated and twenty most down-regulated mRNAs in four different carcinomas. Each row in the heat map is a different gene. Each vertical column in the heat map shows the disease signature for a particular patient. There are 8 healthy and 13 diseased patients shown for ovarian cancer, 37 healthy and 140 diseased patients for prostate cancer, 20 healthy and 20 diseased patients for breast cancer, and 15 healthy and 15 diseased patients for lung cancer. For all cancers and for a sample of 268 patients, an mRNA that is up-regulated in diseased patients is found to be down-regulated in healthy patients and vice versa. Similar thermodynamic behavior is observed across patients; however, the greatest patient-specific variability in the cancer state came from prostate patients. (B) The plots show the first and dominant Lagrange multiplier,  , as described in Eq. 1, plotted versus the same scale of patient index, n, as the heat map in A. The sign of
  is opposite for healthy and diseased patients, thereby providing a disease signature.
Fig. 2.

The cancer-specific miRNA signature distinguishes diseased and healthy patients. (A) Heat maps showing in the vertical direction the wide gap between healthy and diseased patients and, in the horizontal direction, the patient variability. Shown for the twenty most up-regulated and the twenty most down-regulated miRNAs in four carcinomas. The labeling of miRNA has been shortened to the number following hsa-mir. In the case of the ovarian data, UL70-3p should be preceded by hcmv-miR, 19-3p should be preceded by ebv-mir-BART, and K12-3 should be preceded by kshv-mir . Each column represents a healthy or a diseased patient. There are 8 healthy and 8 diseased patients for the ovarian data, 10 healthy and 10 diseased patients for the prostate data (SI Appendix, group 2 of Table S12), 17 healthy and 17 diseased patients for the breast data, and 35 healthy and 58 diseased patients for the lung data shown. (B) Quantitative representation of the distinction between healthy and diseased patients. Shown is the multiplier  (Eq. 1) for the cancer signature versus the patient index n. Also in this way of representing the data it is clear that patient variability in the values of
  is moderate compared with the change in sign between the healthy and diseased patients. Both healthy and disease signatures are deviations in opposite direction from the balance state.
Balance State in Human Cancers.
Surprisal analysis, Eq. 1, examines the observed expression level of an RNA in comparison with a reference value, the level in the balance state,  . The reference value is a characteristic of the RNA and the networks it is involved in. In the balance state the cellular processes are balanced, and therefore there is no net change, as previously described in refs. 8, 14, and 15. As shown in the SI Appendix, section II, the theory requires that the balance state is common to all of the patients. As discussed above, this requirement is intentionally not imposed a priori in the surprisal analysis of the data, because in the balance state the logarithm of the expression levels of the RNA i carry a patient index n,
  . We show that despite patient variability the balance state is common to both healthy and diseased patients within a dataset for a particular carcinoma (SI Appendix, Fig. S1). This behavior was also similar across different datasets (Materials and Methods). Next, subject to tissue-specific expression of certain RNAs, the balance state is shown to be common across the different carcinomas (SI Appendix, Fig. S1 and Tables S1–S10). We anticipate that slight variability (≤10%) between diseased patients can also arise from varying amounts of necrotic or dead cells in the heterogeneous tumor samples before microarray processing (SI Appendix, Table S10). We have previously investigated the role of experimental noise by examining the balance state at different points in time during carcinogenesis of a homogenous cell population in vitro (8, 10).
To compare the balance states of different cancers we rank the RNAs in each according to their thermodynamic stability where the more stable are the lower in free energy. As in cell lines (8, 14), we find that in humans too the most stable RNAs are the most highly expressed in the balanced state. These are mRNAs and miRNAs involved in networks maintaining cellular homeostasis (SI Appendix, Tables S1–S4). We further confirm the function of biomolecules that dominate the balance state to be heavily involved in the regulation of cellular homeostasis via conducting gene ontology enrichment analysis (SI Appendix, Figs. S4–S7), using the scheme of ref. 13.
There is an almost complete overlap in the top 10 miRNAs that contribute the greatest free energy to the balance state across cancers (SI Appendix, Table S5). There is also significant overlap of mRNAs (SI Appendix, Table S5). Both lung patients and prostate patients have TPT1 and ACTG1, genes involved in cell motility and cell structure, common to their balance state, whereas both breast and ovarian patients share RGS1, a gene involved in GTPase activity and signaling, in their balance state (16). We also identify the top 100 mRNAs and miRNAs with the greatest contribution of free energy to the balance state and find greater overlap of mRNAs and miRNAs across patients (SI Appendix, Tables S6–S9).
Cancer-Specific Signature.
Surprisal analysis resolves the deviation of the (logarithm of the) measured expression level from the value of the balanced state. In this paper we highlight the dominant contribution to this deviation as shown in Eq. 1 and SI Appendix, section III. For all four cancers and for both mRNA and miRNA expression-level data, we find that surprisal analysis identifies the largest deviation from the balance state as specific to the cancer phenotypic state (SI Appendix, Fig. S8). This signature robustly distinguishes healthy patients from cancer patients (Figs. 1A and 2 and SI Appendix, Fig. S9). The analysis also identifies the thermodynamic potential of each patient, denoted as  for patient number n (Eq. 1 and SI Appendix, sections II–V). The subscript 1 is the ranking of the deviation and refers to the cancer signature. The potential
  does vary slightly between different patients in the same disease (Figs. 1B and 2B). As seen, the range of this variation is typically significantly smaller than the difference in the potential between diseased and healthy patients. Surprisal analysis also ranks the biomolecules that contribute to programming a system away from cellular homeostasis as defined by the balance state toward the cancer phenotypic state. In Eq. 1,
  is the weight of RNA i in the cancer phenotype. Here too, 1 signifies the leading phenotype. It is a result of the thermodynamic analysis that the product
  of the potential
  by the weight of the RNA i is the work needed to reprogram to the cancer phenotype in patient index n. Surprisal analysis identifies those miRNAs or mRNA that are the most up-regulated and those that are most down-regulated in the disease signature. The disease pattern is defined relative to the thermodynamic balance state. The healthy patients are, on the average, as deviant from the balance state as the diseased patients but in an opposite direction (see Fig. 4). We observe miRNAs and mRNA that are most up-regulated in the healthy to be significantly down-regulated in the diseased and vice versa (SI Appendix, Tables S13, S15, S17, and S19).
Fig. 4.
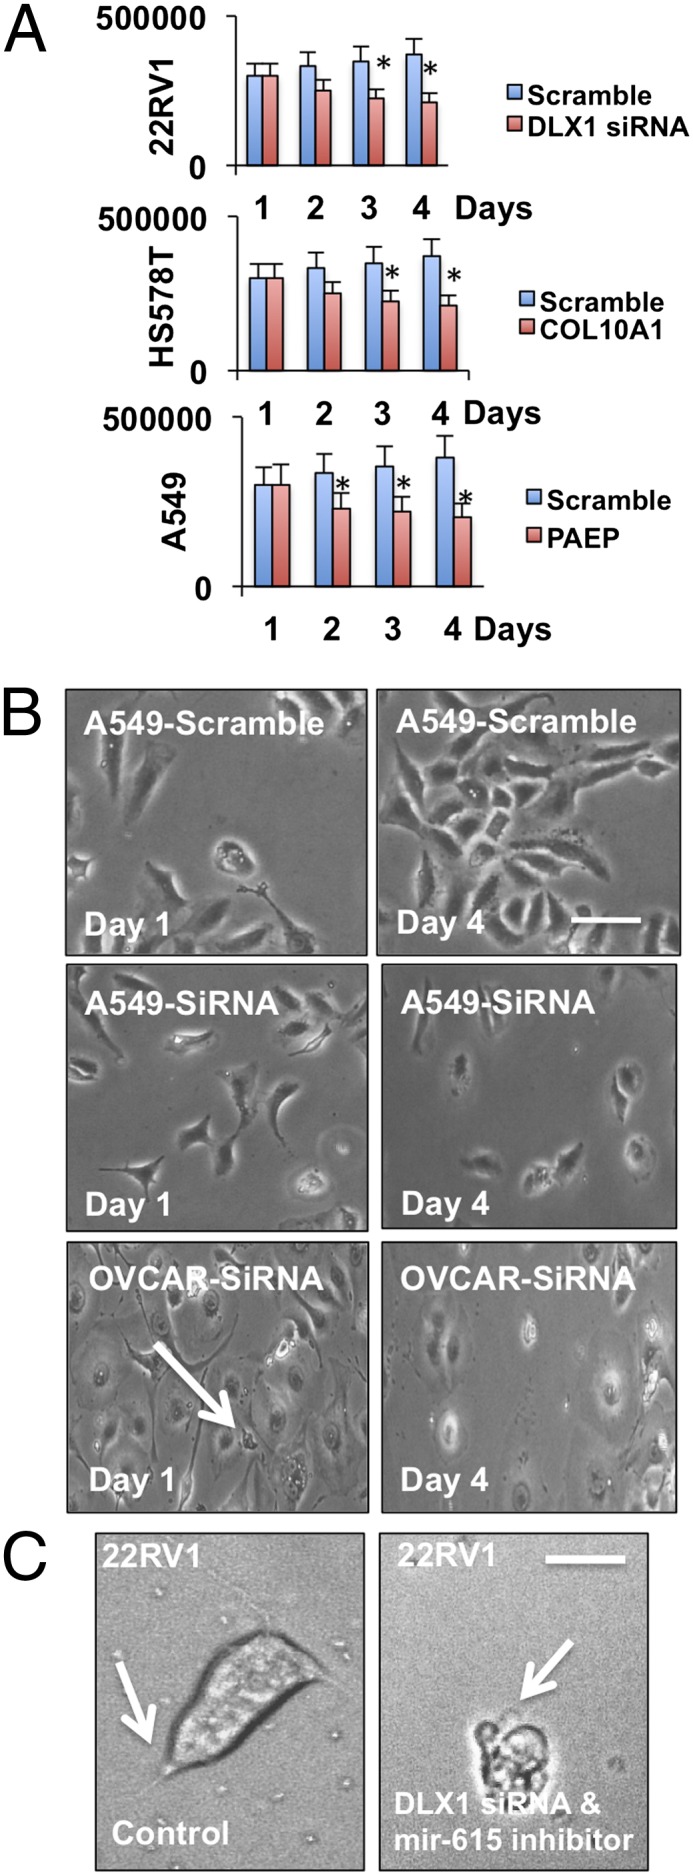
Modulation of the cancer state. (A) Cell proliferation assay in the presence of scramble or siRNA. Cell counts were conducted at 1, 2, 3, and 4 d. (B) Real-time bright-field images of lung A549 and ovarian OVCAR cancer cell line in the presence or absence of scramble or target siRNA 40 μM. (C) Single-cell microscopy of 22RV1 prostate cancer cells treated with or without scramble or target siRNA. (Scale bar, 20 μm.)
Cancer-Specific mRNA Signature.
We identified a mRNA signature for prostate, ovarian, lung, and breast carcinomas (SI Appendix, section IV and Tables S12, S14, S16, and S18). Here we discuss the major biological implications. Cancer is characterized by uncontrolled cell growth and proliferation (17). As expected, biomolecules involved in regulating cell growth and differentiation appear to contribute the greatest free energy to reprogramming a system from the balance state and are most present in the cancer-specific gene signature. Genes commonly associated with the six hallmarks of cancer, including resisting cell death, angiogenesis, and metastasis, are also present in the cancer-specific signature (18). It is well known that the underlying mechanism in maintaining these cancer hallmarks is genome instability (19). We previously demonstrated alterations in gene expression in vitro are maintained through subsequent cell divisions (8, 14, 15). Additionally, in the thermodynamic gene signature of lung adenocarcinoma patients, not only are genes involved in cancer oncogenesis and cancer cell metabolism present in the diseased signature, such as FTH1 and FTl (20), respectively, but also genes specific to lung cancer response to inflammation; genes critical for the presentation of foreign antigens to the immune system were also detected (Fig. 1A and SI Appendix, Table S12). We identify a mRNA disease signature that distinguishes lung adenocarcinoma, breast invasive carcinoma, ovarian serous cytadenocarcinoma, and prostate adendocarcimona from normal tissue. However, slight variability in the thermodynamic mRNA signatures for these cancers across patients was detected. In prostate adenocarcinomas patients, we analyzed different groups of patients chosen randomly (Materials and Methods) and identified a consistent set of genes in the cancer thermodynamic signature of each group (SI Appendix, Table S10). However, genes present in the signature of some patient groups are not observed in others, and this may arise since only a subset of an organism’s genomic DNA is transcribed into mRNAs at any given cell cycle (21).
Cancer-Specific miRNA Signature.
Global microRNAome profiling demonstrated drastic changes in the expression of multiple miRNAs in many common human cancers (22). Several studies have suggested that miRNA expression behavior can provide a more accurate method of classifying cancer subtypes than transcriptome profiling of an entire set of known protein-coding genes (23). Differential miRNA expression behavior has been able to successfully classify poorly differentiated cancers (24), whereas mRNA gene expression behavior failed to classify them (25).
Surprisal analysis of breast cancer patients implicates miR-141 in the thermodynamic miRNA signature (SI Appendix, Table S15). MiR-141 was found to be significantly hormone regulated in breast cancer cells and is also reported to be down-regulated in breast cancer stem cells. Loss of miR-141 plays a role in triggering expansion of the stem cell population in breast tumors (26). Mir-206 was implicated in the thermodynamic miRNA signature of lung cancer patients (SI Appendix, Table S13), and studies have only recently indicated miR-206 in both invasion and metastasis of lung cancer (27).
Quantitative Signature of Cancer RNA Expression Levels.
The disease signature, as characterized by surprisal analysis, quantifies the major fold change in the expression level of both miRNAs and mRNAs (Fig. 3). At the same time, Fig. 3 shows rather clearly that the disease is only a perturbation of the balance state. The implications for network connectivity are discussed below. Another quantitative aspect, shown graphically in Figs. 1 and 2, is that those RNAs most up-regulated in diseased patients are those most down-regulated in healthy patients and vice versa.
Fig. 3.

The disease signature accounts for the expression level of both miRNAs and mRNAs. Unlike the balance state alone, including the disease signature as in Eq. 1 provides an accurate description of the expression level of both miRNAs and mRNAs of any particular patient over several orders of magnitude of the data. Shown is a scatter plot of RNAseq-measured miRNA data represented in terms of surprisal analysis graphed versus the actual raw data for a prostate diseased patient and for a lung-healthy patient.
Cancer mRNA and miRNA Networks.
As for mRNAs, the effect of miRNAs on cell pathology and physiology is likely regulated not only by individual miRNAs but also by networks of miRNAs. Through the determination of the balance state we can construct balance state networks, as previously described (14). Here surprisal analysis provides both the connectivity itself and the strength of the connectivity for the mRNA and miRNA networks. We identified the miRNA and mRNA contributing in the cancer state (SI Appendix, Tables S13, S15, S17, and S19) and ask how the disease alters the networks identified in the balanced state. As discussed in ref. 14, the strength of a connectivity is determined by the product of the free energy of the two RNAs. Because the disease signature is only a lesser change in the free energy, the disease modifies the strength of the network connectivities but not the network framework. Additional discussion is found in SI Appendix, section V.
Modulation of a Single mRNA and miRNA Connectivity in Vitro Results in Deviation of Cancer Cells from the Cancer Phenotypic State.
We report an experimental demonstration of biological constraints governing the deviation of a physiological system toward either a cancer diseased or healthy phenotypic state. Breast, ovarian, lung, and prostate cancer cell lines were cultured in vitro as discussed in Materials and Methods. Cells were transfected with scramble or siRNA against the gene with the greatest thermodynamic influence in the cancer disease signature (Fig. 4). Cell proliferation rates were observed using the cell proliferation assay described in Materials and Methods. Cancer cell lines treated with the siRNA showed significant decrease compared with scramble controls (Fig. 4A).
In breast cancer cells, COL10A1 was found to contribute the greatest thermodynamically to the cancer state. This gene is overexpressed in many tumors, including breast and ovarian tumors (28). Inhibition in vitro of COL11A1 in OVCAR ovarian cancer cell lines reduced cell proliferation and altered cell structure, with fewer cell extensions observed (Fig. 4C). In lung cancer cell lines, PAEP was targeted. PAEP is a tumor suppressor also implicated in both breast and ovarian cancer (29). PAEP inhibition in the adenocarcinomic human alveolar basal epithelial cell lines (A549) resulted in significant reduction in cell proliferation as early as 48 h subsequent siRNA gene knockdown (Fig. 4B).
Furthermore, we targeted the gene with greatest thermodynamic influence (DLX1) in the cancer state in human prostate carcinoma epithelial cell line (22RV1) and also inhibited a single miRNA in the DLX1 mRNA and miRNA connectivity, inhibiting hsa-miR-615. Inhibition of DLX1 reduced prostate cancer cell proliferation (22RV1) in vitro (Fig. 4A). Inhibition of both DLX1 and mir-615 not only reduced cell proliferation, but on a single-cell level this modulation resulted in the presence of a unique cellular physiology, with an increase in cell volume and presence of necrotic-like vacuoles, indicating the onset of cell death (Fig. 4C). A reduced presence of lamellipodia and filopodia was also observed (Fig. 4C). Cellular lamellipodia and filopodia assembly is a key mechanism enabling cancer cell metastasis.
Our cell culture experiments reveal that an inhibition of a miRNA or an mRNA or both that are dominant in the disease signature deviates the cell away from the cancer phenotype.
Concluding Remarks
Surprisal analysis integrates information theory and thermodynamics toward an effective information quantification and compaction of data and provides an unbiased characterization of systems not in equilibrium. We applied surprisal analysis to a large number of patient expression profiles of both miRNA and mRNA to characterize and elucidate cancer-specific signatures and previously undescribed cancer targets and reveal connectivity in miRNA and mRNA networks.
We identify a balance state, a robust thermodynamic reference common to human carcinomas. Diverse patient populations exhibit this characteristic distribution of RNAs stability. The dominant deviation from the balanced state was identified as the cancer-specific disease pattern, a signature comprised of unique mRNAs and miRNAs capable of distinguishing diseased patient samples from normal controls. The balance state and the main deviation provide a description of energetics and change over a wide dynamic range.
Materials and Methods
TCGA Gene and miRNA Dataset and Patient Information.
Level 3 miRNA and gene expression data were obtained from The Cancer Genome Atlas (TCGA) data portal. Both microarray and deep-sequencing datasets from ovarian serious cystadenocarcinoma, lung adenocarcinoma, prostate adenocarcinoma, and breast invasive carcinoma were acquired in August 2012.
The numbers of patients in each mRNA data file are as follows: lung, 15 healthy and 15 diseased; prostate, 37 healthy and 140 diseased; and ovarian, 8 healthy and 13 diseased; and breast, 10 healthy and 10 diseased. In the case of the miRNA data, the lung data comprise 35 healthy and 58 diseased and were analyzed as a single set. For the three other cancers, the limiting number of patients is the healthy group. For the purpose of analysis we formed sets of data. Each set consisted of healthy patients and an equal number of diseased patients with different diseased patients in different sets.
Signature and Network Validation.
Cancer-specific gene and miRNA signatures capable of distinguishing diseased and healthy patients were subjected to literary review and validation in the miRBase database and the National Center for Biotechnology Information database TargetScan (31) and Phenomir (32). mRNA-miRNA networks were validated by MicroCosm database. Gene Ontology Enrichment Analysis was conducted as previously described (29). Briefly, single-rank analysis was conducted, and threshold was set a P value of 10−11.
Cell Lines.
Mammalian cell lines described in this study were purchased from American Type Culture Collection. Cell lines were maintained in standard conditions (33) The following cancer cell lines were used: human prostate carcinoma epithelial cell line (22RV1), human ovarian carcinoma cell line (OVCAR), adenocarcinomic human alveolar basal epithelial cells (A549), and human mammary carcinosarcoma cells lines (HS578T).
Cell Proliferation Assay.
Cell proliferation was monitored at 1, 2, 3, and 4 d using a protocol described in ref. 33. At the end of each time period, the cells were trypsinized to produce a single-cell suspension, and the viable cell number in each well was counted using trypan blue (Gibco) to detect viable cells and a hemocytometer (LW Scientific). All experiments in this study were conducted under a protocol approved by the Western Institutional Review Board (protocol 12-001039).
Single-Cell Microscopy.
This protocol was followed as previously described in detail (33). Image analysis was performed using ImageJ.
Nanoparticle Delivery of siRNA.
The protocol was followed as previously described in detail (33).
Reagents and Supplies.
siRNA (PAEP, catalog no. sc-43807; COL10A1, catalog no. sc-95312; COL11A1, catalog no. sc-72956; DLX1, catalog no. sc-105301) were from Santa Cruz Biotechnologies. hsa-miR-615 miScript inhibitor (GGGGGUCCCCGGUGCUCGGAUC) was from Qiagen.
Statistical Analysis of Cell Proliferation Assay.
Results are shown as mean ± SEM. Student t test was used for in vitro experimental correlations. *P < 0.05, **P < 0.01 was considered statistically significant.
Supplementary Material
Acknowledgments
This work was supported by a Prostate Cancer Foundation creativity grant. F.R. is Director of Research, Fonds National de la Recherche Scientifique.
Footnotes
The authors declare no conflict of interest.
This article contains supporting information online at www.pnas.org/lookup/suppl/doi:10.1073/pnas.1316991110/-/DCSupplemental.
References
- 1.Rhodes DR, Chinnaiyan AM. Integrative analysis of the cancer transcriptome. Nat Genet. 2005;37(Suppl):S31–S37. doi: 10.1038/ng1570. [DOI] [PubMed] [Google Scholar]
- 2.Segal E, Friedman N, Kaminski N, Regev A, Koller D. From signatures to models: Understanding cancer using microarrays. Nat Genet. 2005;37(Suppl):S38–S45. doi: 10.1038/ng1561. [DOI] [PubMed] [Google Scholar]
- 3.Bhattacharjee A, et al. Classification of human lung carcinomas by mRNA expression profiling reveals distinct adenocarcinoma subclasses. Proc Natl Acad Sci USA. 2001;98(24):13790–13795. doi: 10.1073/pnas.191502998. [DOI] [PMC free article] [PubMed] [Google Scholar]
- 4.Golub TR, et al. Molecular classification of cancer: Class discovery and class prediction by gene expression monitoring. Science. 1999;286(5439):531–537. doi: 10.1126/science.286.5439.531. [DOI] [PubMed] [Google Scholar]
- 5.Schmid PR, Palmer NP, Kohane IS, Berger B. Making sense out of massive data by going beyond differential expression. Proc Natl Acad Sci USA. 2012;109(15):5594–5599. doi: 10.1073/pnas.1118792109. [DOI] [PMC free article] [PubMed] [Google Scholar]
- 6.Nelson WG. Profiling prostate cancer. Proc Natl Acad Sci USA. 2011;108(52):20861–20862. doi: 10.1073/pnas.1118444109. [DOI] [PMC free article] [PubMed] [Google Scholar]
- 7.Markert EK, Mizuno H, Vazquez A, Levine AJ. Molecular classification of prostate cancer using curated expression signatures. Proc Natl Acad Sci USA. 2011;108(52):21276–21281. doi: 10.1073/pnas.1117029108. [DOI] [PMC free article] [PubMed] [Google Scholar]
- 8.Remacle F, Kravchenko-Balasha N, Levitzki A, Levine RD. Information-theoretic analysis of phenotype changes in early stages of carcinogenesis. Proc Natl Acad Sci USA. 2010;107(22):10324–10329. doi: 10.1073/pnas.1005283107. [DOI] [PMC free article] [PubMed] [Google Scholar]
- 9.Levine RD, Bernstein RB. Energy disposal and energy consumption in elementary chemical reactions. Information theoretic approach. Acc Chem Res. 1974;7(12):393–400. [Google Scholar]
- 10.Gross A, Levine RD. Surprisal analysis of transcripts expression levels in the presence of noise: A reliable determination of the onset of a tumor phenotype. PLoS ONE. 2013;8(4):e61554. doi: 10.1371/journal.pone.0061554. [DOI] [PMC free article] [PubMed] [Google Scholar]
- 11.Shin YS, et al. Protein signaling networks from single cell fluctuations and information theory profiling. Biophys J. 2011;100(10):2378–2386. doi: 10.1016/j.bpj.2011.04.025. [DOI] [PMC free article] [PubMed] [Google Scholar]
- 12.Gross A, Li CM, Remacle F, Levine RD. Free energy rhythms in Saccharomyces cerevisiae: A dynamic perspective with implications for ribosomal biogenesis. Biochemistry. 2013;52(9):1641–1648. doi: 10.1021/bi3016982. [DOI] [PMC free article] [PubMed] [Google Scholar]
- 13.Eden E, Navon R, Steinfeld I, Lipson D, Yakhini Z. GOrilla: A tool for discovery and visualization of enriched GO terms in ranked gene lists. BMC Bioinformatics. 2009;10:48. doi: 10.1186/1471-2105-10-48. [DOI] [PMC free article] [PubMed] [Google Scholar]
- 14.Kravchenko-Balasha N, et al. On a fundamental structure of gene networks in living cells. Proc Natl Acad Sci USA. 2012;109(12):4702–4707. doi: 10.1073/pnas.1200790109. [DOI] [PMC free article] [PubMed] [Google Scholar]
- 15.Kravchenko-Balasha N, et al. Convergence of logic of cellular regulation in different premalignant cells by an information theoretic approach. BMC Syst Biol. 2011;5:42. doi: 10.1186/1752-0509-5-42. [DOI] [PMC free article] [PubMed] [Google Scholar]
- 16.Amson R, Pece S, Marine J-C, Di Fiore PP, Telerman A. TPT1/ TCTP-regulated pathways in phenotypic reprogramming. Trends Cell Biol. 2013;23(1):37–46. doi: 10.1016/j.tcb.2012.10.002. [DOI] [PubMed] [Google Scholar]
- 17.Cornu M, Albert V, Hall MN. mTOR in aging, metabolism, and cancer. Curr Opin Genet Dev. 2013;23(1):53–62. doi: 10.1016/j.gde.2012.12.005. [DOI] [PubMed] [Google Scholar]
- 18.Hainaut P, Plymoth A. Targeting the hallmarks of cancer: Towards a rational approach to next-generation cancer therapy. Curr Opin Oncol. 2013;25(1):50–51. doi: 10.1097/CCO.0b013e32835b651e. [DOI] [PubMed] [Google Scholar]
- 19.Hanahan D, Weinberg RA. Hallmarks of cancer: The next generation. Cell. 2011;144(5):646–674. doi: 10.1016/j.cell.2011.02.013. [DOI] [PubMed] [Google Scholar]
- 20.Fisher J, et al. Ferritin: A novel mechanism for delivery of iron to the brain and other organs. Am J Physiol Cell Physiol. 2007;293(2):C641–C649. doi: 10.1152/ajpcell.00599.2006. [DOI] [PubMed] [Google Scholar]
- 21.Gautier EL, et al. Immunological Genome Consortium Gene-expression profiles and transcriptional regulatory pathways that underlie the identity and diversity of mouse tissue macrophages. Nat Immunol. 2012;13(11):1118–1128. doi: 10.1038/ni.2419. [DOI] [PMC free article] [PubMed] [Google Scholar]
- 22.Ng EKO, et al. Circulating microRNAs as specific biomarkers for breast cancer detection. PLoS ONE. 2013;8(1):e53141. doi: 10.1371/journal.pone.0053141. [DOI] [PMC free article] [PubMed] [Google Scholar]
- 23.Yang Z, et al. Preferential regulation of stably expressed genes in the human genome suggests a widespread expression buffering role of microRNAs. BMC Genomics. 2012;13(Suppl 7):S14. doi: 10.1186/1471-2164-13-S7-S14. [DOI] [PMC free article] [PubMed] [Google Scholar]
- 24.Gommans WM, Berezikov E. Controlling miRNA regulation in disease. Methods Mol Biol. 2012;822:1–18. doi: 10.1007/978-1-61779-427-8_1. [DOI] [PubMed] [Google Scholar]
- 25.Krell J, Frampton AE, Stebbing J. MicroRNAs in the cancer clinic. Front Biosci (Elite Ed) 2013;5:204–213. doi: 10.2741/e608. [DOI] [PubMed] [Google Scholar]
- 26.Zhao L, et al. MiRNA expression analysis of cancer-associated fibroblasts and normal fibroblasts in breast cancer. Int J Biochem Cell Biol. 2012;44(11):2051–2059. doi: 10.1016/j.biocel.2012.08.005. [DOI] [PubMed] [Google Scholar]
- 27.Wang X, Ling C, Bai Y, Zhao J. MicroRNA-206 is associated with invasion and metastasis of lung cancer. Anatom Record. 2011;294(1):88–92. doi: 10.1002/ar.21287. [DOI] [PubMed] [Google Scholar]
- 28.Chang HJ, et al. MMP13 is potentially a new tumor marker for breast cancer diagnosis. Oncol Rep. 2009;22(5):1119–1127. doi: 10.3892/or_00000544. [DOI] [PubMed] [Google Scholar]
- 29.Kunert-Keil C, Steinmüller F, Jeschke U, Gredes T, Gedrange T. Immunolocalization of glycodelin in human adenocarcinoma of the lung, squamous cell carcinoma of the lung and lung metastases of colonic adenocarcinoma. Acta Histochem. 2011;113(8):798–802. doi: 10.1016/j.acthis.2010.11.009. [DOI] [PubMed] [Google Scholar]
- 30.Leber MF, Efferth T. Molecular principles of cancer invasion and metastasis (review) Int J Oncol. 2009;34(4):881–895. doi: 10.3892/ijo_00000214. [DOI] [PubMed] [Google Scholar]
- 31.Lewis BP, Shih IH, Jones-Rhoades MW, Bartel DP, Burge CB. Prediction of mammalian microRNA targets. Cell. 2003;115(7):787–798. doi: 10.1016/s0092-8674(03)01018-3. [DOI] [PubMed] [Google Scholar]
- 32.Ruepp A, Kowarsch A, Theis F. PhenomiR: microRNAs in human diseases and biological processes. Methods Mol Biol. 2012;822:249–260. doi: 10.1007/978-1-61779-427-8_17. [DOI] [PubMed] [Google Scholar]
- 33.Zadran S, Amighi A, Otiniano E, Wong K, Zadran H. ENTPD5-mediated modulation of ATP results in altered metabolism and decreased survival in gliomablastoma multiforme. Tumour Biol. 2012;33(6):2411–2421. doi: 10.1007/s13277-012-0505-1. [DOI] [PubMed] [Google Scholar]
Associated Data
This section collects any data citations, data availability statements, or supplementary materials included in this article.