

Abstract
Networks are employed to represent many nonlinear complex systems in the real world. The topological aspects and relationships between the structure and function of biological networks have been widely studied in the past few decades. However dynamic and control features of complex networks have not been widely researched, in comparison to topological network features. In this study, we explore the relationship between network controllability, topological parameters, and network medicine (metabolic drug targets). Considering the assumption that targets of approved anticancer metabolic drugs are driver nodes (which control cancer metabolic networks), we have applied topological analysis to genome-scale metabolic models of 15 normal and corresponding cancer cell types. The results show that besides primary network parameters, more complex network metrics such as motifs and clusters may also be appropriate for controlling the systems providing the controllability relationship between topological parameters and drug targets. Consequently, this study reveals the possibilities of following a set of driver nodes in network clusters instead of considering them individually according to their centralities. This outcome suggests considering distributed control systems instead of nodal control for cancer metabolic networks, leading to a new strategy in the field of network medicine.
Introduction
Ever since Otto Warburg discovered the unique characteristics of tumor cell metabolism over 80 years ago [1], the interpretation of cancer as a genetic disease has gradually been displaced by the understanding of it as a metabolic disease [2]. Cancerous cells have to reprogram their metabolic states during tumor initiation and progression through genetic and epigenetic alterations in metabolic genes, in order to respond to the demanding requirements for growth [3]. Understanding the details of human metabolism has facilitated the reconstruction of genome-scale metabolic models (GEMs) of various cell types and diseases. [4]–[6]. There are four generic reconstructed genome-scale human metabolic networks: Recon1 [7], Recon2 [8], the Edinburgh Human Metabolic Network (EHMN) [9], and HumanCyc [10]. For the study of particular human cell types, tissue-specificity, and cancer; metabolic models have been reconstructed either manually or automatically. Manually reconstructed metabolic models include models of the liver (HepatoNet1, [11]), kidney [12], brain [13], erythrocytes [14], alveolar macrophages [15] as well a model of the core metabolic pathways participating in cancer growth [16]. The first automatic reconstructed metabolic model has been developed by Schlomi et al. for 10 different human tissues [17] as subsets of Recon1. Later they proposed a different algorithm to generate a more flexible and functional tissue-specific model [18]. Folger et al. [19] have constructed a large-scale metabolic model of different cancers. Agren et al. [20] have developed the INIT algorithm (Integrative Network Inference for Tissues) which relies on the Human Protein Atlas (HPA) as the main evidence source, and on tissue-specific gene expression data [21] and metabolomic data from the Human Metabolome DataBase (HMDB) [22] as extra sources of evidence. Finally, Wang et al. [23] have developed a new approach named metabolic Context-specificity Assessed by Deterministic Reaction Evaluation (mCADRE) in order to build 126 human tissue-specific metabolic models.
Reconstructed human metabolic networks provide a useful tool for the study of diseases and the development of drugs. Several simulations and modeling methods have been developed to address the issues of drug-target prediction [24]–[28]. The topological features of metabolic networks contribute to the robustness and flexibility of the complex biosystems and may explain, in general, the fact that many drug candidates are ineffective (the drug effect is compensated by other pathways in the network) or show unexpected severe side effects [29]–[31]. Prompted by these findings, many scientists have proposed a system-oriented drug design strategy to replace the current “one gene, one drug, one target, one disease” approach [31]–[33]. Hence the concept of polypharmacology has been proposed for those drugs acting on multiple targets instead on one target [34]. It is also reasonable that multiple target modifications can more effectively convert the system from a disease state to a normal state than a single target modification. In fact, successful applications of multi-component therapies have been reported and multi-component drugs are already on the market [35], [36]. Systems analysis will help us not only in the discovery of novel drug targets but also in developing new systems-based therapy strategies [37].
Network medicine is a new subject that tries to link topological network properties to biological function and disease. Network medicine explores the molecular complexity of a special disease and relationships between distinct phenotypes which may lead to the identification of disease modules and pathways [38]. A better understanding of the implications of cellular interconnectedness for disease progression will lead to discovery of new disease genes and pathways. These advances may also reshape clinical practice, from discovery of more accurate biomarkers to a better disease classification leading to personalized therapies and treatment. Recently, there have been some studies on disease clustering approaches which aim to find different disease modules and predict new genes. Barabasi et al. [39] have shown that each disease has its own unique module and that different disease modules can overlap. In another study with respect to the prediction of new genes, Chen et al. [40] have validated three unknown genes (LPL, LACTB, and PPM1L) as obesity genes in transgenic mice. In other work, Oti et al. [41] have found Janus kinase 3 (JAK3) as a candidate protein for severe combined immunodeficiency syndrome. The controllability of networks is becoming a key issue in many disciplines, including sociology and biology [42]–[45]. Network controllability is the ability to guide a system's behavior towards a desired state through appropriate management of some input variables [46], [47]. The difficulty in control theory is because of the system's architecture and the dynamical rules which makes controllability to be possible only in systems where both issues are well mapped [48]. In the last decades, it has been demonstrated it is fair to expect that the network topology would definitely affect controllability as well. This approach helps us avoid any entanglement due to nonlinear effects and consideration of networks with thousands to millions of nodes [49]. So, structural controllability could be an appropriate choice for dealing with large biological networks. Despite extensive interest in the study of topological features over the last decade, dynamic and control aspects of complex networks have not followed the same pace of research development. For example, different topological properties such as highly connected nodes, betweenness and closeness centralities have been chosen as candidates for an encoding part of system controllability but there is no agreement at present on what network property is suitable for [48], [50], [51]. Liu et al. [48] have proposed analytical tools for the controllability of complex networks. Their approach is based on the identification of a subset of nodes (called driver nodes) in a directed network that can control the dynamics of the system. They have shown that the number of driver nodes is determined primarily by the degree distribution of a network. It means that while homogeneous (dense) networks could be controlled using a few driver nodes, inhomogeneous (sparse) networks (found in many real networks) are the most difficult to control due to a high number of driver nodes. In addition, driver nodes tend to avoid high-degree nodes (called hubs) in both dense and sparse (real) systems. Consequently, random networks are easier to control [48]. One year later, they have introduced a new network centrality called control centrality in order to address the importance of a given node in maintaining a system's controllability [51].
There have been reactions to Liu's work. Ferrarini [52] has introduced five unconventional thoughts on Liu's approach using the control of edges instead of nodes, which may be more useful in complex networks. In another comment, Benarjee et al. [53] have doubts about using degree centrality for controlling a system. They believe that an effective understanding of controllability in directed networks can be reached using distance based measures of closeness centrality (CC) and betweenness centrality (BC), and may not require the knowledge of local connectivity measures such as in-degree and out-degree, because degree reflects information about the immediate neighborhood of a node. In contrast, CC and BC signifies a node's potential to communicate with further nodes through the network. This shows the important role that CC and BC may play in determining controllability. However the main challenge still remains to determine which node is the driver node. In 2012, Nepusz et al. considered the controllability of a system based on edge dynamics. In this approach, each node accepts information through its inbound edge and spreads the results to its neighbouring nodes using the outbound edges [54]. They have shown that networks with scale-free degree distribution are easier to control. In the same year, Nacher et al. [50] introduced a new approach which investigated the dependence of the size of the minimum dominating set (MDS) of nodes on topological features of directed real networks for the purposes of control design. Having computed the MDS in real networks and in computer-generated networks with a variety of topologies, they demonstrated that the MDS size depends on the average degree of all nodes in the network. They have shown that the more homogeneous a network, the larger the fraction of individuals required for dominating the entire system. Also, the more heterogenous a network is, the easier it is to control the system. In addition, the MDS tends to target highly connected nodes, which is in contrast to the Liu et al. study [48]. However they mention that their results do not contradict Liu's work because of different strategies. Liu's work assumes that only driver node values could be directly controlled through external signals, whereas the MDS method undertakes that each driver node is sufficiently smart to control individual links separately. On the other hand, in the MDS approach, a node with degree k is treated as if it were a set of k nodes [50]. So they believe that the MDS approach complements Liu's results.
Both nodal and edge dynamics frameworks (the approaches mentioned above) have been implied for covering unipartite graphs. In 2013, Nacher et al. introduced a modified version of MDS in order to study the controllability of bipartite networks. The results demonstrated that MDS tends to select high degree nodes and nodes with a high betweenness centrality in bipartite networks. But the author mentioned that this approach may not be possible in some kinds of biological networks such as Protein-Protein Interaction (PPI) and metabolic networks.
In this paper, we have tried to explore possible relation between topological analysis, structural controllability, and metabolic networks. We have applied a comprehensive (local and global) topological analysis of recently published genome-scale metabolic models of normal and cancer tissue-specific models to assess the controllability relation between topological parameters and drug targets (as driver nodes),with the assumption that the targets of approved anticancer metabolic drugs are driver nodes and therefore control cancer metabolic networks. In addition, the outcomes of metabolic networks controllability could create insights leading to the discovery of novel drug targets. We have shown that besides primary network parameters, more complex network metrics such as motif and clusters may also provide new tools for addressing network controllability in metabolic networks. Characterizing the drug target in enzyme-centric clusters shows that most of the drug targets belong to one specific cluster of an enzyme-centric network. This could provide new insight into considering distributed control systems (DCS) instead of nodal control for cancer metabolic networks [55], [56]. If so, DCS may be considered as a new strategy in the field of network medicine.
Materials and Methods
Metabolic and enzyme-centric network construction of cancer and normal cell types
Omics data such as transcriptomic data are often noisy. In addition, mRNA expressions are relative to a reference condition and sometimes do not correlate well with enzyme levels [57]. Therefore, a prerequisite for reconstructing reasonable and reliable tissue-specific models is to consider other resources as well. We used metabolic networks of 15 cancer cell types and their corresponding normal cell types in our study (categorized according to Table 1). These networks have been constructed on the basis of the INIT algorithm [20] which integrates tissue-specific gene expression data into a general human metabolic model. Therefore, each normal and cancer model contains metabolites and reactions different to the others. We have written MATLAB scripts to compare metabolites and reactions between normal and cancer models (File_S1). Full lists of metabolites and reactions of all 15 cancers and their associated normal models are summarized in the Files_S2, S3.
Table 1. List of 15 cancer cell types and their corresponding normal cell types.
| Cancerous cell | Normal cell |
| Breast | Breast Glandular |
| Cervical | Cervix squamous |
| Colorectal | Colon Glandular |
| Endometrial | Corpus Endometrial-Corpus Glandular |
| Renal | Kidney Glomeruli-Kidney Tubules |
| Liver | Liver Hepatocyt |
| Lung | Lung Alveolar |
| Ovarian | Ovary Stromal |
| Pancreatic | Pancreas Islet |
| Prostate | Prostate Glandualr |
| Skin | Skin Epidermal |
| Stomach | Stomach Glandular (I&II) |
| Testis | Testis Leydig |
| Thyroid | Thyroid Glandular |
| Urothelial | Urinary Bladder |
All original SBML files have been downloaded from http://www.metabolicatlas.com/ [20].
The SBML files are bipartite graphs including two types of nodes (metabolites and reactions). Bipartite characteristics of metabolic networks make it difficult to analyse them with structural methods. In addition, metabolite-metabolite (metabolite-centric) and enzyme-enzyme (enzyme-centric) networks can provide extra insights and are therefore relevant for further analysis of the metabolism. It is also necessary to address structural controllability based on nodal dynamics (the approach of this study), and to construct metabolite- and enzyme-centric networks. We have written scripts in MATLAB software (R2012b) in order to construct undirected and directed metabolite-centric, as well as undirected and directed enzyme-centric networks based on SBML files. We have added network construction procedures including the algorithms in the File_S13. All the networks constructed are available in the File_S4. An example of a directed enzyme-centric metabolic network of cancer and normal breast cells imported in Cytoscape software [58] is shown in Figure 1. A summary of the kind of networks, the software and the parameters used for each analysis has been provided in Table 2.
Figure 1. Directed enzyme-centric metabolic networks of cancer and normal breast cells.

Table 2. A summary of the different networks, software and parameters used for each topological analysis.
| Primary topological analysis | |||
| Purpose of study: to check any structural differences between metabolite- and enzyme-centric of normal and cancer networks | |||
| Networks Types | metabolite-centric network | directed | |
| undirected | |||
| enzyme-centric network | directed | ||
| undirected | |||
| Software | Network Analysis plugin in Cytoscape | ||
| Parameters | directed | in-degree, out-degree, connected components, average number of neighbors, number of nodes, isolated node | |
| undirected | degree, connected components, network diameter, network centralization, characteristic path length, average number of neighbors, total number of nodes, network heterogeneity, isolated node | ||
| Centrality analysis | |||
| Purpose of study: to check distribution of drug targets among the 100 top of centralities | |||
| Networks Types | enzyme-centric network | directed | |
| Software | cytoHubba plugin in Cytoscape | ||
| Parameters | Maximal Clique Centrality (MCC), Density of Maximum Neighborhood Component (DMNC), Maximum Neighborhood Component (MNC), Degree, Edge Percolated Component (EPC), Bottleneck, Eccentricity, Closeness, Radiability, Betweenness, Stress, Clustering Coefficient | ||
| Motif discovery | |||
| Purpose of study: to check any differences between metabolite- and enzyme-centric of normal and cancer networks. | |||
| Networks Types | metabolite-centric network | directed | |
| enzyme-centric network | directed | ||
| Software | Quatexelero algorithm | ||
| Parameters | Motif of size 3 (13 types) | ||
| Clustering | |||
| Purpose of study: (1) to check any differences between number of clusters in normal and cancer networks, (2) to check distribution of drug targets among clusters | |||
| Networks Types | enzyme-centric network | directed | |
| Software | MCODE plugin in Cytoscape | ||
| Parameters | degree cutoff = 2, without loops, node score cutoff = 0.2, K-core = 2, Max. Depth = 100, Include haircut, without fluff | ||
Primary topological analysis of four different kinds of networks
Primary topological analysis has been carried out on four different networks of normal and cancer cell metabolic networks (undirected and directed metabolite-centric network, undirected and directed enzyme-centric network) using the Network Analysis plugin in Cytoscape [58]. The in-degree, out-degree, connected components, average number of neighbors, number of nodes and isolated node parameters have been measured for direct networks. The degree, connected components, network diameter, network centralization, characteristic path length, average number of neighbors, total number of nodes, network heterogeneity and isolated node parameters have been measured for undirected networks. A summary definition of the different parameters is available in the File_S5. We have provided all power-law plots for every constructed network with fitting results in the File_S12.
Centrality analysis
Centrality analysis has been carried out on the directed enzyme-centric networks of cancer and normal cell types using the cytoHubba plugin [59] in Cytoscape. We have used twelve centrality parameters: Maximal Clique Centrality (MCC), Density of Maximum Neighborhood Component (DMNC), Maximum Neighborhood Component (MNC), Degree, Edge Percolated Component (EPC), Bottleneck, Eccentricity, Closeness, Radiability, Betweenness, Stress and Clustering Coefficient [59].
Motif discovery
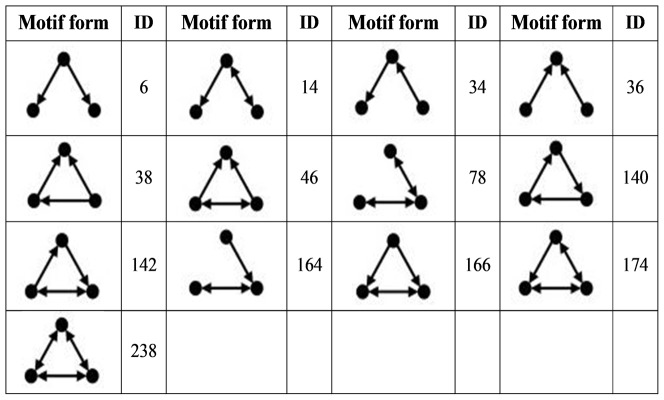
Motif finding has been carried out on the directed metabolic and enzyme-centric networks of cancer and normal cell types using the Quatexelero algorithm [60] (an enhanced Kavosh algorithm [61]). The analysis has been performed on motifs of size 3 (including 13 different types-Figure 2) because the motif of this size has been served as the building blocks of biological networks from bacteria to mammals [62].
Figure 2. Corresponding Motif IDs of size 3 used in this study.
Clustering
Clustering analysis has been performed on the directed enzyme-centric networks of cancer and normal cell types using the MCODE [63] plugin in Cytoscape. Clustering parameters during analysis have been shown in Table 2.
Anticancer metabolic drugs and their targets
For finding anticancer metabolic drugs and their targets, we have used the drug bank database [64]. All anticancer metabolic drugs and their targets are listed in the File_S6. The metabolic functions of the drug targets are listed in the File_S7. These data have been used for centrality and clustering analysis of enzyme-centric networks of cancer cell types.
Results
Primary topological analysis
Since metabolic networks satisfy power-law degree distribution, scale-free, and small-world properties [65], we have checked all constructed networks for basic network properties. Degree distribution of a scale-free network having k connections to other nodes satisfies the following relation [65]
where  is power-law parameter. For all constructed networks, we have applied curve fitting to aforementioned relation and have calculated values of
  and
and  (coefficient of determination or R-squared). Our results show that
  related to degree distribution (in-degree and out-degree for directed networks) for all metabolite-centric and enzyme-centric networks are less than two. According to the
  , all networks are scale free. In addition, calculated characteristic path length values have been implied on small-world property. Clustering coefficient, network diameter and connected components are other topological parameters that relate to network heterogeneity. The primary topological parameters related to directed metabolite-centric networks are shown in Table 3. Complete lists of data are available in the File_S8. All power-law plots for every constructed network with fitting results are available in the File_S12.
Table 3. Primary topological measures related to directed metabolite-centric networks.
| Name | In-degree | Out-degree | Clustering Coefficient | connected components | network diameter | characteristic path length | Avg. number of neighbors | number of nodes | isolated nodes | multi-edge node pairs | ||
| r 2 | γ | r 2 | γ | |||||||||
| Breast Cancer | 0.751 | −1.381 | 0.775 | −1.349 | 0.065 | 1751 | 15 | 5.23 | 3.582 | 4473 | 1746 | 466 |
| BreastGlandular | 0.736 | −1.35 | 0.775 | −1.343 | 0.074 | 1541 | 16 | 5.281 | 3.875 | 4313 | 1533 | 502 |
| Cervical Cancer | 0.748 | −1.332 | 0.739 | −1.315 | 0.075 | 1615 | 15 | 5.144 | 3.888 | 4443 | 1611 | 517 |
| Cervix Squamous | 0.716 | −1.348 | 0.749 | −1.326 | 0.065 | 1564 | 17 | 5.323 | 3.501 | 3900 | 1558 | 383 |
| Colon Glandular | 0.772 | −1.347 | 0.763 | −1.319 | 0.077 | 1742 | 16 | 5.192 | 3.91 | 4669 | 1735 | 594 |
| Colorectal Cancer | 0.761 | −1.374 | 0.784 | −1.353 | 0.069 | 1756 | 17 | 5.215 | 3.609 | 4469 | 1750 | 496 |
| Copus Endometrial | 0.728 | −1.405 | 0.78 | −1.394 | 0.056 | 1293 | 15 | 5.076 | 3.467 | 3329 | 1284 | 337 |
| Copus Glandular | 0.774 | −1.389 | 0.77 | −1.353 | 0.064 | 1720 | 17 | 5.298 | 3.495 | 4274 | 1716 | 377 |
| Endometrial Cancer | 0.739 | −1.395 | 0.739 | −1.343 | 0.069 | 1723 | 16 | 5.36 | 3.644 | 4389 | 1713 | 465 |
| Kidney Glomeruli | 0.766 | −1.361 | 0.802 | −1.352 | 0.069 | 1283 | 15 | 5.289 | 3.933 | 3798 | 1278 | 410 |
| Kidney Tubules | 0.757 | −1.354 | 0.745 | −1.303 | 0.063 | 1850 | 16 | 5.333 | 3.515 | 4599 | 1842 | 434 |
| Liver Cancer | 0.76 | −1.378 | 0.774 | −1.31 | 0.067 | 1796 | 16 | 5.298 | 3.644 | 4601 | 1788 | 493 |
| Liver Hepatocytes | 0.774 | −1.35 | 0.779 | −1.323 | 0.073 | 1715 | 17 | 5.418 | 3.885 | 4650 | 1707 | 536 |
| Lung Alveolar | 0.734 | −1.348 | 0.761 | −1.322 | 0.071 | 1447 | 14 | 5.078 | 3.914 | 4128 | 1437 | 488 |
| Lung Cancer | 0.742 | −1.362 | 0.739 | −1.348 | 0.07 | 1496 | 16 | 5.211 | 3.893 | 4267 | 1490 | 455 |
| Ovarian Cancer | 0.75 | −1.359 | 0.773 | −1.336 | 0.075 | 1625 | 14 | 5.249 | 3.856 | 4439 | 1620 | 523 |
| Ovary Stromal | 0.744 | −1.36 | 0.77 | −1.339 | 0.062 | 1293 | 14 | 5.038 | 3.617 | 3504 | 1286 | 334 |
| Pancreas Islet | 0.749 | −1.347 | 0.749 | −1.331 | 0.069 | 1662 | 15 | 5.079 | 3.688 | 4359 | 1652 | 480 |
| Pancreatic Cancer | 0.764 | −1.382 | 0.727 | −1.314 | 0.075 | 1621 | 16 | 5.227 | 3.899 | 4492 | 1613 | 521 |
| Prostate Cancer | 0.73 | −1.363 | 0.775 | −1.332 | 0.076 | 1567 | 16 | 5.182 | 3.923 | 4363 | 1560 | 492 |
| Prostate Glandular | 0.75 | −1.368 | 0.756 | −1.309 | 0.075 | 1561 | 14 | 5.175 | 3.936 | 4473 | 1557 | 485 |
| Renal Cancer | 0.772 | −1.39 | 0.743 | −1.323 | 0.076 | 1454 | 15 | 5.111 | 3.981 | 4306 | 1448 | 501 |
| Skin Cancer | 0.732 | −1.363 | 0.739 | −1.343 | 0.074 | 1393 | 15 | 5.193 | 3.971 | 4075 | 1386 | 479 |
| Skin Epidermal | 0.752 | −1.348 | 0.764 | −1.298 | 0.075 | 1444 | 16 | 5.115 | 3.9 | 4155 | 1434 | 459 |
| Stomach 1Glandular | 0.718 | −1.337 | 0.798 | −1.379 | 0.073 | 1617 | 14 | 5.088 | 3.906 | 4536 | 1610 | 495 |
| Stomach 2Glandular | 0.75 | −1.363 | 0.769 | −1.328 | 0.064 | 1824 | 14 | 5.19 | 3.536 | 4517 | 1816 | 421 |
| Stomach Cancer | 0.752 | −1.36 | 0.784 | −1.368 | 0.074 | 1518 | 14 | 5.217 | 3.893 | 4302 | 1511 | 497 |
| Testis Cancer | 0.756 | −1.355 | 0.728 | −1.372 | 0.072 | 1490 | 17 | 5.152 | 3.872 | 4148 | 1483 | 472 |
| Testis Leydig | 0.751 | −1.342 | 0.757 | −1.302 | 0.073 | 1776 | 15 | 5.193 | 3.802 | 4674 | 1768 | 519 |
| Thyroid Cancer | 0.752 | −1.368 | 0.781 | −1.338 | 0.073 | 1718 | 16 | 5.237 | 3.85 | 4673 | 1710 | 553 |
| Thyroid Glandular | 0.727 | −1.348 | 0.725 | −1.324 | 0.074 | 1771 | 16 | 5.241 | 3.837 | 4716 | 1762 | 525 |
| Urinary Bladder | 0.78 | −1.386 | 0.725 | −1.329 | 0.061 | 1795 | 15 | 5.252 | 3.476 | 4405 | 1787 | 440 |
| Urothelial Cancer | 0.742 | −1.346 | 0.713 | −1.322 | 0.075 | 1538 | 14 | 5.178 | 3.919 | 4403 | 1532 | 501 |
Anticancer metabolic drugs and their targets through centralities
Centrality parameters are global properties of a network that rank graph nodes according to their importance in the network. The higher the rank, the more important a node is in the network, indicating that it may play key roles in controlling cellular functions. We have carried out centrality analysis for directed enzyme-centric networks. All enzymes in 15 enzyme-centric networks have been sorted according to 12 different centrality parameters in order to check whether drug targets appears as highly connected nodes. As Figure 3 shows, drug targets are not available among the 100 top of 12 different centralities. All centrality data are available in the File_S9.
Figure 3. Cluster distribution in enzyme and metabolite-centric cancer and normal networks.

Motif discovery
Network motifs (one of the important local properties of networks) have served as the building blocks of biological networks from bacteria to mammals, and their function has been experimentally studied in some species such as the transcription network of E. coli [62]. For exploring significant differences between metabolite- and enzyme-centric networks of normal and corresponding cancer cell types, size 3 motif analysis has been carried out for these networks. In metabolite-centric networks there was no difference in motif distribution with size 3 between normal and cancer cell types. In addition, motifs with IDs “38, 46, 142, 166, 174, and 238” have positive Z-Scores for metabolic networks. For enzyme-centric networks, motif distributions in size 3 are different in normal and the corresponding cancer cell types. For example, in the breast enzyme-centric network, the feed forward loop (ID = 38) has a positive Z-Score in breast cancer but a negative Z-Score in the normal cell type (Table 4). All motif data are available in the File_S10.
Table 4. Motif finding in directed metabolic and enzyme-centric breast networks.
| Motif ID | Enzyme centric network | Metabolic centric network | ||
| Breast Cancer | Normal - Breast Grandular | Breast Cancer | Normal - Breast Grandular | |
| Z-SCORE | Z-SCORE | Z-SCORE | Z-SCORE | |
| 6 | −0.297858 | 6.904595 | −6.640324 | −5.26027 |
| 14 | −14.077722 | −5.136464 | −14.989574 | −16.436516 |
| 34 | −11.134564 | −4.373875 | −11.714442 | −8.455331 |
| 36 | −4.061103 | 2.328047 | −6.202353 | −4.754256 |
| 38 | 1.447868 | −3.813574 | 5.214613 | 3.870699 |
| 46 | 15.150644 | 6.304231 | 3.585829 | 3.334919 |
| 78 | 6.237981 | 11.685102 | −12.759671 | −8.828319 |
| 140 | 52.125441 | 36.997489 | −3.720983 | −3.250312 |
| 142 | 4.300469 | 4.41293 | 40.237059 | 42.413737 |
| 164 | 3.747944 | 10.054664 | −18.118178 | −18.989507 |
| 166 | −3.970751 | −5.07765 | 5.691384 | 5.705127 |
| 174 | −2.890623 | −3.240451 | 5.873318 | 8.981136 |
| 238 | NA | −11.224703 | 17.323516 | 5.615659 |
Clustering
We have carried out clustering analysis for exploring significant differences in the number of clusters in directed enzyme-centric networks of normal and corresponding cancer cell types. Results related to the MCODE clustering algorithm (Figure 4) show that the number of clusters in metabolite-centric networks in both normal and cancer cell types reveal no significant discrepancy. This is also true for the enzyme-centric networks of normal and cancer cell types. All clustering data are available in the File_S11.
Figure 4. Distribution of drug targets in twelve different centralities.

Anticancer metabolic drugs and their targets through clusters
In the next step, we have identified the drug target of anticancer metabolic drugs (extracted from the drug bank) through clusters in the enzyme-centric network of cancer cell types. The results shows drug targets gather in a specific cluster of an enzyme-centric network of the cancer cell (Figure 5, cluster number 14). All clustering data are available in the File_S11.
Figure 5. First 17 clusters of liver enzyme-centric cancer network.

Drug targets (green nodes) are in cluster number 14.
Discussion
Networks are considered to be a major representation of many nonlinear complex systems in the real world. The theory of complex networks uses methods previously developed in graph theory, statistics, physics, and computer simulation in order to study the topological features and relationships between structure and function in the formation of different real world networks such as social, information, and biological networks. Structural network controllability is a new field guiding a system's behavior towards a desired state through appropriate management of some input variables. The difficulty in control theory is because of the fact that two independent factors (with its own layer of unknown) contribute to controllability [48]: (1) the system's architecture, represented by the network in which components interact with each other; and (2) the dynamical rules that capture the time-dependent interactions between the components. Therefore, controllability has been possible just in systems where both issues are well mapped, for instance rate control for communication networks, small biological circuits, and the control of synchronized networks [45], [66], [67]. From the advances towards understanding complex networks accumulated in the last decade, we know that network topology fundamentally affects the dynamical processes on it, from epidemic spreading to synchronization phenomenon. So, it is fair to expect that the network topology would definitely affect controllability as well. This approach helps us avoid any entanglement due to nonlinear effects [49]. In addition, this kind of controllability (structural controllability) allows consideration of networks of arbitrary size (with thousands to millions of nodes). In structural network controllability, both nodal and edge dynamics frameworks have been implied for covering unipartite graphs [48], [50], [54]. In the nodal dynamics approach, Liu's work assumes that only driver node values could be directly controlled through external signals whereas Nacher's study (MDS method) undertakes that each driver node is sufficiently smart to control individual links separately [48], [50]. Although these two works have provided different results especially in targeting highly connected nodes by driver nodes, the authors mention that their results do not contradict because they use different strategies. Thus they believe that the MDS approach complements Liu's results [50].
In this study, we have explored the relationships between structural network controllability, topological parameters, and network medicine (metabolic drug targets). We have applied a topological analysis to genome-scale metabolic models of 15 normal and corresponding cancer cell types. First, we have constructed metabolite- and enzyme-centric networks based on the metabolic SBML files. We have performed primary topological analysis to check whether there are any structural differences in the metabolite-centric and enzyme-centric of normal and cancer metabolic networks. The results show all constructed networks satisfy scale-free and small-world properties. But there is not any significant differences between normal and cancer tissues. Next, we have used the MDS concept in metabolic networks since controlling cancer metabolism through internal signals seems more reasonable biologically. Metabolic networks are appropriate choice because they allow us to consider both metabolite-centric (nodes in original network) and enzyme-centric (edges in original network) networks separately. Based on an assumption (the targets of approved anticancer metabolic drugs are driver nodes and therefore control cancer metabolic networks), we wanted to explore whether it is possible to explore topological parameters which could specify driver nodes in the metabolic networks. So, we have done two studies based on the MDS controllability concept in the enzyme-centric metabolic networks: 1) to check whether driver nodes tend to be part of centrality indexes such as highly connected nodes (Hubs). 2) to explore topological parameters which could specify driver nodes in the metabolic networks.
In performing centrality analysis, the distribution of drug targets among the 100 top of twelve centrality parameters was not significant. It means that drug targets avoid being highly connected enzymes. So, different centralities used in this study could not consider as a driver node for controlling systems. Motifs, as another local property of networks, have also been examined and there was no difference in metabolite-centric networks of cancer and normal cell types, but there were significant discrepancies in the enzyme-centric networks of cancer cells and their corresponding normal cell types. The number of clusters between cancer and corresponding normal cell networks show no significant differences, but characterizing drug targets in enzyme-centric clusters shows that most of the drug targets belong in one specific cluster of an enzyme-centric network. Therefore our results indicate that besides primary network parameters, more complex network metrics such as motifs and clusters may be also appropriate parameters for controlling the metabolic systems. Besides, for metabolic networks, enzyme-centric networks could be more reliable in the context of controllability, although little attention has been paid to such networks in systems controllability. The outcomes of metabolic network controllability could create insights into the discovery of novel drug targets.The results also suggest considering DCS [55], [56] instead of nodal control could lead to a new strategy for cancer treatment in the network medicine field.
Supporting Information
Compare metabolites and reactions between normal and cancer models (including all networks).
(RAR)
Lists of metabolites and reactions of cancers models.
(XLSX)
Lists of metabolites and reactions of normal models.
(XLSX)
Constructed networks (including all normal and cancer networks).
(RAR)
Summary definition of the different parameters.
(DOC)
Anticancer metabolic drugs and their targets.
(XLSX)
Metabolic functions of the drug targets.
(XLSX)
Primary topological parameters for all constructed networks (including metabolite- and enzyme-centric directed and undirected networks).
(RAR)
Centrality data (including all enzyme-centric cancer networks).
(RAR)
Motif data (including metabolite- and enzyme-centric normal and cancer networks).
(RAR)
Clustering data (including all enzyme-centric cancer networks).
(RAR)
Power-law plots for every constructed network with fitting results (including metabolite- and enzyme-centric directed and undirected networks).
(RAR)
Network construction procedures.
(DOCX)
Funding Statement
The authors have no support or funding to report.
References
- 1. Warburg OH, Posener K, Negelein E (1953) Über den Stoffwechsel der Karzinomzellen. Biochem Zeitschr 152: 309–344. [Google Scholar]
- 2. Seyfried TN, Shelton LM (2010) Cancer as a metabolic disease. Nutrition & Metabolism 7. [DOI] [PMC free article] [PubMed] [Google Scholar]
- 3. Furuta E, Okuda H, Kobayashi A, Watabe K (2010) Metabolic genes in cancer: Their roles in tumor progression and clinical implications. Biochimica Et Biophysica Acta-Reviews on Cancer 1805: 141–152. [DOI] [PMC free article] [PubMed] [Google Scholar]
- 4. Feist AM, Palsson BO (2008) The growing scope of applications of genome-scale metabolic reconstructions using Escherichia coli. Nature Biotechnology 26: 659–667. [DOI] [PMC free article] [PubMed] [Google Scholar]
- 5. Thiele I, Palsson BO (2010) A protocol for generating a high-quality genome-scale metabolic reconstruction. Nature Protocols 5: 93–121. [DOI] [PMC free article] [PubMed] [Google Scholar]
- 6. Osterlund T, Nookaew I, Nielsen J (2012) Fifteen years of large scale metabolic modeling of yeast: Developments and impacts. Biotechnology Advances 30: 979–988. [DOI] [PubMed] [Google Scholar]
- 7. Duarte NC, Becker SA, Jamshidi N, Thiele I, Mo ML, et al. (2007) Global reconstruction of the human metabolic network based on genomic and bibliomic data. Proceedings of the National Academy of Sciences of the United States of America 104: 1777–1782. [DOI] [PMC free article] [PubMed] [Google Scholar]
- 8. Boccaletti S, Latora V, Moreno Y, Chavez M, Hwang D (2006) Complex networks: Structure and dynamics. Physics Reports 424: 175–308. [Google Scholar]
- 9. Hao T, Ma HW, Zhao XM, Goryanin I (2010) Compartmentalization of the Edinburgh Human Metabolic Network. Bmc Bioinformatics 11. [DOI] [PMC free article] [PubMed] [Google Scholar]
- 10. Romero P, Wagg J, Green ML, Kaiser D, Krummenacker M, et al. (2005) Computational prediction of human metabolic pathways from the complete human genome. Genome Biology 6. [DOI] [PMC free article] [PubMed] [Google Scholar]
- 11. Gille C, Bolling C, Hoppe A, Bulik S, Hoffmann S, et al. (2010) HepatoNet1: a comprehensive metabolic reconstruction of the human hepatocyte for the analysis of liver physiology. Molecular Systems Biology 6. [DOI] [PMC free article] [PubMed] [Google Scholar]
- 12. Chang RL, Xie L, Xie L, Bourne PE, Palsson BO (2010) Drug Off-Target Effects Predicted Using Structural Analysis in the Context of a Metabolic Network Model. PLOS Computational Biology 6. [DOI] [PMC free article] [PubMed] [Google Scholar]
- 13. Lewis NE, Schramm G, Bordbar A, Schellenberger J, Andersen MP, et al. (2010) Large-scale in silico modeling of metabolic interactions between cell types in the human brain. Nature Biotechnology 28: 1279–U1291. [DOI] [PMC free article] [PubMed] [Google Scholar]
- 14. Bordbar A, Jamshidi N, Palsson BO (2011) iAB-RBC-283: A proteomically derived knowledge-base of erythrocyte metabolism that can be used to simulate its physiological and patho-physiological states. Bmc Systems Biology 5. [DOI] [PMC free article] [PubMed] [Google Scholar]
- 15. Bordbar A, Lewis NE, Schellenberger J, Palsson BO, Jamshidi N (2010) Insight into human alveolar macrophage and M. tuberculosis interactions via metabolic reconstructions. Molecular Systems Biology 6. [DOI] [PMC free article] [PubMed] [Google Scholar]
- 16. Resendis-Antonio O, Checa A, Encarnacion S (2010) Modeling Core Metabolism in Cancer Cells: Surveying the Topology Underlying the Warburg Effect. PLOS One 5. [DOI] [PMC free article] [PubMed] [Google Scholar]
- 17. Shlomi T, Cabili MN, Herrgard MJ, Palsson BO, Ruppin E (2008) Network-based prediction of human tissue-specific metabolism. Nature Biotechnology 26: 1003–1010. [DOI] [PubMed] [Google Scholar]
- 18. Jerby L, Shlomi T, Ruppin E (2010) Computational reconstruction of tissue-specific metabolic models: application to human liver metabolism. Molecular Systems Biology 6. [DOI] [PMC free article] [PubMed] [Google Scholar]
- 19. Folger O, Jerby L, Frezza C, Gottlieb E, Ruppin E, et al. (2011) Predicting selective drug targets in cancer through metabolic networks. Mol Syst Biol 7. [DOI] [PMC free article] [PubMed] [Google Scholar]
- 20. Agren R, Bordel S, Mardinoglu A, Pornputtapong N, Nookaew I, et al. (2012) Reconstruction of Genome-Scale Active Metabolic Networks for 69 Human Cell Types and 16 Cancer Types Using INIT. PLOS Computational Biology 8. [DOI] [PMC free article] [PubMed] [Google Scholar]
- 21. Su AI, Wiltshire T, Batalov S, Lapp H, Ching KA, et al. (2004) A gene atlas of the mouse and human protein-encoding transcriptomes. Proceedings of the National Academy of Sciences of the United States of America 101: 6062–6067. [DOI] [PMC free article] [PubMed] [Google Scholar]
- 22. Wishart DS, Tzur D, Knox C, Eisner R, Guo AC, et al. (2007) HMDB: the human metabolome database. Nucleic Acids Research 35: D521–D526. [DOI] [PMC free article] [PubMed] [Google Scholar]
- 23. Gomez-Gardenes J, Moreno Y, Arenas A (2007) Paths to synchronization on complex networks. Phys Rev Lett 98: 034101. [DOI] [PubMed] [Google Scholar]
- 24. Keiser MJ, Setola V, Irwin JJ, Laggner C, Abbas AI, et al. (2009) Predicting new molecular targets for known drugs. Nature 462: 175–181. [DOI] [PMC free article] [PubMed] [Google Scholar]
- 25. Keiser MJ, Roth BL, Armbruster BN, Ernsberger P, Irwin JJ, et al. (2007) Relating protein pharmacology by ligand chemistry. Nat Biotechnol 25: 197–206. [DOI] [PubMed] [Google Scholar]
- 26. Gonzalez-Diaz H, Prado-Prado F, Garcia-Mera X, Alonso N, Abeijon P, et al. (2011) MIND-BEST: Web server for drugs and target discovery; design, synthesis, and assay of MAO-B inhibitors and theoretical-experimental study of G3PDH protein from Trichomonas gallinae. J Proteome Res 10: 1698–1718. [DOI] [PubMed] [Google Scholar]
- 27. Yang L, Wang K, Chen J, Jegga AG, Luo H, et al. (2011) Exploring off-targets and off-systems for adverse drug reactions via chemical-protein interactome–clozapine-induced agranulocytosis as a case study. PLOS Comput Biol 7: e1002016. [DOI] [PMC free article] [PubMed] [Google Scholar]
- 28. Xie L, Evangelidis T, Xie L, Bourne P (2011) Drug Discovery Using Chemical Systems Biology: Weak Inhibition of Multiple Kinases May Contribute to the Anti-Cancer Effect of Nelfinavir. PLOS Comput Biol 7: e1002037. [DOI] [PMC free article] [PubMed] [Google Scholar]
- 29. Kitano H (2004) Biological robustness. Nat Rev Genet 5: 826–837. [DOI] [PubMed] [Google Scholar]
- 30. Kitano H (2007) A robustness-based approach to systems-oriented drug design. Nat Rev Drug Discov 6: 202–210. [DOI] [PubMed] [Google Scholar]
- 31. Csete M, Doyle J (2004) Bow ties, metabolism and disease. Trends Biotechnol 22: 446–450. [DOI] [PubMed] [Google Scholar]
- 32. Zimmermann G, Lehár J, Keith C (2007) Multi-target therapeutics: when the whole is greater than the sum of the parts. Drug Discovery Today 12: 34–42. [DOI] [PubMed] [Google Scholar]
- 33. Morphy R, Rankovic Z (2007) Fragments, network biology and designing multiple ligands. Drug Discov Today 12: 156–160. [DOI] [PubMed] [Google Scholar]
- 34. Hopkins AL (2008) Network pharmacology: the next paradigm in drug discovery. Nat Chem Biol 4: 682–690. [DOI] [PubMed] [Google Scholar]
- 35. Nelson HS (2001) Advair: combination treatment with fluticasone propionate/salmeterol in the treatment of asthma. J Allergy Clin Immunol 107: 398–416. [DOI] [PubMed] [Google Scholar]
- 36. Gupta EK, Ito MK (2002) Lovastatin and extended-release niacin combination product: the first drug combination for the management of hyperlipidemia. Heart Dis 4: 124–137. [DOI] [PubMed] [Google Scholar]
- 37. Csermely P, Korcsmaros T, Kiss HJ, London G, Nussinov R (2013) Structure and dynamics of molecular networks: a novel paradigm of drug discovery: a comprehensive review. Pharmacol Ther 138: 333–408. [DOI] [PMC free article] [PubMed] [Google Scholar]
- 38. Barabasi AL, Gulbahce N, Loscalzo J (2011) Network medicine: a network-based approach to human disease. Nat Rev Genet 12: 56–68. [DOI] [PMC free article] [PubMed] [Google Scholar]
- 39. Lee DS, Park J, Kay KA, Christakis NA, Oltvai ZN, et al. (2008) The implications of human metabolic network topology for disease comorbidity. Proc Natl Acad Sci U S A 105: 9880–9885. [DOI] [PMC free article] [PubMed] [Google Scholar]
- 40. Chen Y, Zhu J, Lum PY, Yang X, Pinto S, et al. (2008) Variations in DNA elucidate molecular networks that cause disease. Nature 452: 429–435. [DOI] [PMC free article] [PubMed] [Google Scholar]
- 41. Oti M, Snel B, Huynen MA, Brunner HG (2006) Predicting disease genes using protein–protein interactions. Journal of Medical Genetics 43: 691–698. [DOI] [PMC free article] [PubMed] [Google Scholar]
- 42.Caldarelli G (2007) Scale-Free Networks: Complex Webs in Nature and Technology (Oxford Finance). Oxford University Press, USA.
- 43.Dorogovtsev SN, Mendes JFF (2003) Evolution of Networks: From Biological Nets to the Internet and WWW.
- 44. Dong-Hee K, Adilson EM (2009) Slave nodes and the controllability of metabolic networks. New Journal of Physics 11: 113047. [Google Scholar]
- 45. Marucci L, Barton D, Cantone I, Ricci M, Cosma M, et al. (2009) How to Turn a Genetic Circuit into a Synthetic Tunable Oscillator, or a Bistable Switch. PLOS ONE 4: e8083. [DOI] [PMC free article] [PubMed] [Google Scholar]
- 46.Luenberger DG (1979) Introduction to dynamic systems: theory, models, and applications. Wiley. [Google Scholar]
- 47.Slotine J-J, Li W (1991) Applied Nonlinear Control. Prentice Hall. [Google Scholar]
- 48. Liu YY, Slotine JJ, Barabasi AL (2011) Controllability of complex networks. Nature 473: 167–173. [DOI] [PubMed] [Google Scholar]
- 49. Strogatz SH (2001) Exploring complex networks. Nature 410: 268–276. [DOI] [PubMed] [Google Scholar]
- 50. Nacher J, Akutsu T (2012) Dominating scale-free networks with variable scaling exponent: heterogeneous networks are not difficult to control - Abstract - New Journal of Physics - IOPscience. New Journal of Physics 14. [Google Scholar]
- 51. Liu YY, Slotine JJ, Barabasi AL (2012) Control centrality and hierarchical structure in complex networks. PLOS One 7: e44459. [DOI] [PMC free article] [PubMed] [Google Scholar]
- 52. Ferrarini A (2011) Some thoughts on the control of network systems. Network Biology 1: 3–4. [Google Scholar]
- 53.Banerjee S, Roy S (2012) Key to Network Controllability.
- 54. Nepusz T, Vicsek T (2012) Controlling edge dynamics in complex networks. Nat Phys 8: 568–573. [Google Scholar]
- 55.Miller FP, John MB, Vandome AF (2010) Distributed Control System: VDM Publishing.
- 56.Russell J, Cohn R (2012) Distributed Control System. Tbilisi State University. [Google Scholar]
- 57. Olivares-Hernandez R, Bordel S, Nielsen J (2011) Codon usage variability determines the correlation between proteome and transcriptome fold changes. Bmc Systems Biology 5. [DOI] [PMC free article] [PubMed] [Google Scholar]
- 58. Shannon P, Markiel A, Ozier O, Baliga NS, Wang JT, et al. (2003) Cytoscape: a software environment for integrated models of biomolecular interaction networks. Genome Res 13: 2498–2504. [DOI] [PMC free article] [PubMed] [Google Scholar]
- 59. Lin CY, Chin CH, Wu HH, Chen SH, Ho CW, et al. (2008) Hubba: hub objects analyzer–a framework of interactome hubs identification for network biology. Nucleic Acids Res 36: W438–443. [DOI] [PMC free article] [PubMed] [Google Scholar]
- 60. Khakabimamaghani S, Sharafuddin I, Dichter N, Koch I, Masoudi-Nejad A (2013) QuateXelero: An Accelerated Exact Network Motif Detection Algorithm. PLOS One 8: e68073. [DOI] [PMC free article] [PubMed] [Google Scholar]
- 61. Kashani ZR, Ahrabian H, Elahi E, Nowzari-Dalini A, Ansari ES, et al. (2009) Kavosh: a new algorithm for finding network motifs. BMC Bioinformatics 10: 318. [DOI] [PMC free article] [PubMed] [Google Scholar]
- 62. Shen-Orr SS, Milo R, Mangan S, Alon U (2002) Network motifs in the transcriptional regulation network of Escherichia coli. Nat Genet 31: 64–68. [DOI] [PubMed] [Google Scholar]
- 63. Bader GD, Hogue CW (2003) An automated method for finding molecular complexes in large protein interaction networks. BMC Bioinformatics 4: 2. [DOI] [PMC free article] [PubMed] [Google Scholar]
- 64. Knox C, Law V, Jewison T, Liu P, Ly S, et al. (2011) DrugBank 3.0: a comprehensive resource for ‘omics’ research on drugs. Nucleic Acids Res 39: D1035–1041. [DOI] [PMC free article] [PubMed] [Google Scholar]
- 65.Junker B, Schreiber F (2008) Analysis of Biological Networks. Wiley-Interscience. [Google Scholar]
- 66. Wang W, Slotine JJ (2005) On partial contraction analysis for coupled nonlinear oscillators. Biol Cybern 92: 38–53. [DOI] [PubMed] [Google Scholar]
- 67. Sorrentino F, di Bernardo M, Garofalo F, Chen G (2007) Controllability of complex networks via pinning. Phys Rev E Stat Nonlin Soft Matter Phys 75: 046103. [DOI] [PubMed] [Google Scholar]
Associated Data
This section collects any data citations, data availability statements, or supplementary materials included in this article.
Supplementary Materials
Compare metabolites and reactions between normal and cancer models (including all networks).
(RAR)
Lists of metabolites and reactions of cancers models.
(XLSX)
Lists of metabolites and reactions of normal models.
(XLSX)
Constructed networks (including all normal and cancer networks).
(RAR)
Summary definition of the different parameters.
(DOC)
Anticancer metabolic drugs and their targets.
(XLSX)
Metabolic functions of the drug targets.
(XLSX)
Primary topological parameters for all constructed networks (including metabolite- and enzyme-centric directed and undirected networks).
(RAR)
Centrality data (including all enzyme-centric cancer networks).
(RAR)
Motif data (including metabolite- and enzyme-centric normal and cancer networks).
(RAR)
Clustering data (including all enzyme-centric cancer networks).
(RAR)
Power-law plots for every constructed network with fitting results (including metabolite- and enzyme-centric directed and undirected networks).
(RAR)
Network construction procedures.
(DOCX)