

Abstract
The encapsulation of bismuth as BiOCl/Bi2O3 within ultra-short (ca. 50 nm) single-walled carbon nanocapsules (US-tubes) has been achieved. The Bi@US-tubes have been characterized by high-resolution transmission electron microscopy (HR-TEM), energy-dispersive X-ray spectroscopy (EDS), thermogravimetric analysis (TGA), X-ray photoelectron spectroscopy (XPS), and Raman spectroscopy. Bi@US-tubes have been used for intracellular labeling of pig bone marrow-derived mesenchymal stem cells (MSCs) to show high X-ray contrast in computed tomography (CT) cellular imaging for the first time. The relatively high contrast is achieved with low bismuth loading (2.66% by weight) within the US-tubes and without compromising cell viability. X-ray CT imaging of Bi@US-tubes-labeled MSCs showed a nearly two-fold increase in contrast enhancement when compared to unlabeled MSCs in a 100 kV CT clinical scanner. The CT signal enhancement from the Bi@US-tubes is 500 times greater than polymer-coated Bi2S3 nanoparticles and several-fold that of any clinical iodinated contrast agent (CA) at the same concentration. Our findings suggest that the Bi@US-tubes can be used as a potential new class of X-ray CT agent for stem cell labeling and possibly in vivo tracking.
1. Introduction
Stem cell-based therapies represent a promising future for regenerative medicine. Imaging techniques provide a means for non-invasive monitoring and tracking of in vivo transplanted stem cells.1, 2 X-ray computed tomography (CT) is the most frequently used diagnostic imaging technology in the clinic to detect a wide range of diseases, including cancer. CT contrast agents (CAs) are generally administered to increase visibility of vasculature and tissues in the body, and their concentration is proportional to the CT signal attenuation.3 X-ray attenuation of each voxel is measured in Hounsfield units (HU) with a scale defined from values of air and water, respectively, fixed at 1000 and 0 HU. Micro-computed tomography (micro-CT) has emerged in recent years as a powerful and non-invasive preclinical imaging tool used to establish high-resolution images, with isotropic voxels in typical scan times ranging from minutes to tenths of minutes.4, 5 At present, CT is not considered to be a cellular imaging modality due to the lack of CAs that are either cell-permeable or surface-modified, so that they can bind selectively to receptors on the cell exterior.
Currently-approved CT contrast agents for clinical use are iodinated compounds that dominated the biomedical field due to their effective X-rays attenuation, versatile synthetic chemistry, water solubility, and excellent body tolerance.6, 7 However, their non-specific distribution and rapid pharmacokinetics have limited their vascular and targeting performance.8 Iodinated blood pool CAs of low molecular weights require rapid CT image acquisitions due to their rapid clearance through the kidneys.9 Several approaches have been reported which describe the encapsulation of water-soluble iodinated CAs (e.g., Iopamidol, Lipiodol, and Iopromide) into polymeric and lipid nanoparticulate systems.10-13 However, such nanoparticulate systems have shown a limited encapsulation efficiency which requires an excess concentration of phospholipids dissolved in high volume of alcohols, which is removed only by dialysis.
The insensitivity of X-ray based imaging techniques requires the development of nanoparticle-based CAs with very high radio-opaque densities, while maintaining particle integrity on the shelf and in circulation. Heavy metals have high toxicities in their free form; therefore, bio-elimination is an important pre-requisite consideration in the design of CT metal-containing agents. Metal-based nanoparticles with relatively long circulation times, such as gold (Au),14, 15 bismuth (Bi),16-19 and titanium (Ti),20 have been considered as non-targeted blood pool CAs. The suitability of gold14, 21-23 and bismuth sulfide (Bi2S3)19 nanoparticles as non-targeted X-ray CAs has been demonstrated in vivo in mice. For example, Bi2S3 and Au nanoparticles exhibit blood half-lives in mice of ~ 140 minutes and 14.6 hours, respectively.19, 23 The use of peptide-labeled Bi2S3 nanoparticle24 and bismuth-loaded NanoK25 for in vitro and in vivo targeted CT imaging have also been recently investigated. Although these nanoparticles exhibit long circulation times and excellent imaging efficacies, most of them possess particle sizes larger than the normal renal filtration threshold, due to the high amount of metal that needs to be clustered to overcome the inherent insensivity of the modality, and thus their in vivo stability remains unclear.26
The use of bismuth as a molecular probe for X-ray CT imaging offers advantages over conventional iodine-based agents. Because of its higher atomic number and electron density, bismuth (Z = 83) should have a greater X-ray attenuation intensity than iodine (Z = 53). Bismuth is also considered to be relatively non-toxic and has been used in cosmetics and medical applications.27, 28 It is possible that the encapsulation of bismuth within carbon nanotubes, and more specifically ultra-short carbon nanocapsules (US-tubes) derived from single-walled carbon nanotubes (SWNTs), has the potential to overcome many of the limitations for CT CAs in a manner similar to the encapsulation of Gd3+ ions within US-tubes that produced the high-performance MRI CAs called Gadonanotubes (GNTs).29, 30
SWNTs have many unique mechanical, electronic, and optical properties that are potentially useful in medicine, and there is currently an intense research effort to develop biomedical applications for this material, particularly for the treatment and diagnosis of cancer.31-33 US-tubes with 20-80 nm in length and ca. 1.4 nm in diameter have shown to be suitable candidates for biomedical applications involving cellular uptake and eventual elimination from the body.34, 35 In particular, they offer a convenient platform for encapsulating metal ions and small molecules, and potentially targeting them with peptides or antibodies for biomedical applications with exterior sidewall derivatization.36-38 In fact, we have previously used US-tubes to successfully encapsulate different materials of medical interest, such as cisplatin as a cancer therapeutic,39 I2 molecules for X-ray imaging,40 211AtCl molecules for α-radiotherapy,41 nitroxide radicals as spin labels for MRI and EPRI,42 and Gd3+ ions for MR imaging.29, 30, 43 Recently, Tran, et al. confirmed the cellular uptake of GNTs in MSCs without compromising cell viability, differentiation potential, proliferation pattern, or cell phenotype.43 Taking advantage of this previous work, we now propose to utilize US-tubes to encapsulate and transport Bi3+ ions as a promising new CT CA for the internal labeling and in vivo tracking of stem cells. Thus, we present the preparation, in vitro characterization, and performance of the Bi@US-tubes as a new CA for X-ray imaging applications.
2. Experimental
2.1 Materials
Bismuth(III) chloride (BiCl3) was obtained from Alfa Aesar. Bismuth(III) oxychloride (BiOCl) and bismuth(III) oxide (Bi2O3) were obtained from Aldrich Chemical Company. Full-length SWNTs were purchased from Carbon Solutions, Inc., CA, USA. Pluronic® F-108 NF was obtained from BASF. Tetrahydrofuran (THF) was dried prior to its use. All other reagents were of high purity grade and were used without further purification.
2.2 Preparation of US-tubes
Full-length SWNTs produced by the electric-arc discharge method were cut into US-tubes by fluorination and pyrolysis at 1000 °C under argon atmosphere.44 The cutting process reduced the amount of Ni and Y catalyst impurities to < 3%, while creating defect sites in the US-tube sidewalls. These defect sites allow for the loading of ions and molecules into the interior of the US-tubes.29 US-tubes were purified by hydrochloric acid (HCl) reflux using a Soxhlet extractor with a Wilmad glass fine frit to remove amorphous carbon and metal catalyst impurities and debundled by chemical reduction using Na0/THF to produce individualized US-tubes prior to loading with BiCl3 (see below).38 The US-tubes were collected by filtration, washed multiple times with deionized (DI) water, and dried at 120°C between each step described above.
2.3 Encapsulation of Bismuth within US-tubes
BiCl3 (15 mg) was first dissolved in 15 mL of HPLC water (pH 5.5) in a scintillation vial to produce an opaque white solution, due to the formation of BiOCl (Supporting Information, Figure 1S). Concentrated HCl was added dropwise to the solution with vigorous stirring until the color changed from white to colorless. 15 mg of US-tubes were added to the solution and then sonicated for 1 hour. The solution was left undisturbed for 24 hours to produce the Bi@US-tubes material. The supernatant solution was removed by decantation. The Bi@US-tubes were collected by filtration, washed with abundant diluted 1M HCl solution to remove surface adsorbed bismuth ions, and then with abundant DI water (pH 5.5). The resulting Bi@US-tube sample was then dried at 120 °C.
2.4 Characterization of the Bi@US-tubes
High-resolution transmission electron microscopy (HR-TEM) studies were performed using a JEOL 2000 FX microscope equipped with an energy-dispersive spectrometer (EDS) operated at 200 kV. Precautions were taken to minimize structural changes in the sample caused by electron beam heating effects. One such precaution was the use of a cold sample stage which kept the sample temperature in the range of −70 °C to −50 °C. The HR-TEM samples were prepared by placing a small amount of Bi@US-tubes on a copper grid coated with amorphous carbon holey film. No solvents were used during the procedure. Thermogravimetric analysis (TGA) was performed using a TA instrument Q600. The measurements were carried out with a heating rate of 10 °C min−1 from 50 to 800 °C under a flow of argon (100 mL min−1). X-ray photoelectron spectroscopy (XPS) was performed on a PHI Quantera SXM spectrometer equipped with an Al Kα radiation source (1486.6 eV). Samples were prepared by pressing them into indium foil. Raman spectroscopy was performed using a Renishaw inVia Raman Microscope operated with a 633 nm laser and 1800 l/mm grating. ICP-OES analyses were performed by a PerkinElmer Optima 4300 DV inductively-coupled plasma optical emission spectrometer. Bi3+-ion concentration was detected at 223.061 nm, while Y3+-ion was detected at 371.029 nm and used as the internal drift standard. ICP-OES samples were prepared by digesting the Bi@US-tubes in a scintillation vial with 500 μL of 26% HClO3 until the solution had evaporated to dryness. After digestion, samples were washed with a small amount of 2% HNO3 and transferred quantitatively to a 10 mL volumetric flask. Solutions of unlabeled and labeled cells were passed through a Millipore (Millex-MP) 0.22 μm filter prior to analysis. Five scans were performed for each sample, and the concentration determined from the average of scans.
2.5 Preparation of the Bi@US-tubes stock solution
Stock solution was made by suspending dry Bi@US-tubes in 0.17% (w/v) Pluronic® F-108 NF via probe sonication for 6 min, followed by centrifugation at 3200 rpm for 10 min to remove any unsuspended Bi@US-tubes. Pluronic® F-108 NF is a non-charged, non-cytotoxic surfactant that is commonly used to suspend carbon nanotube materials for in vitro and in vivo testing.43 The stability of the Bi@US-tubes suspension was examined by enclosing 10 mL of the Bi@US-tubes suspension inside a dialysis membrane (Slide-A-Lyzer Dialysis Cassette; 20,000 MW) cylinder, which was immersed in buffer solutions (PBS = phosphate-buffered saline, 6.7 mM PBS, pH = 7; EDTA = ethylenediaminetetraacetic acid, 6.7 mM PBS in 0.01 mM EDTA) at 37 °C for one week. Samples in triplicate were obtained from the dialysis-membrane cylinder at different time points (0, 3, 6, 24, 72, and 168 hours) to determine the Bi concentration by ICP-OES. For the cell labeling studies, the Bi3+ ion concentration of the stock solution was maintained from 60 to 66 μM, as confirmed by ICP-OES. Prior to their addition to cell cultures, stock solution was sterilized under UV light for 3 h.
2.6 Cell culture and cell-labeling experiments
MSCs were harvested and isolated from the bone marrow of male pigs, as previously reported.43, 45 MSCs were expanded in two successive passages at 20 × 103 cells/cm2. Cells in the second passage (P2) were frozen in cryovials and then thawed and expanded (P3) prior to labeling. Cell cultures were incubated at 37 °C (95% relative humidity in 5% CO2). MSCs were grown and maintained in alpha essential medium (αMEM) containing 10% fetal bovine serum (FBS) and 1% antibiotic supplement (200 mM L-glutamine, 10,000 units/mL penicillin, and 10 mg/mL streptomycin). All labeling studies were performed with P3 MSCs. Previous experimental assessments carried out with GNTs as magnetic nanolabels demonstrated that around 25 μM is an optimal concentration for labeling MSCs.43 Thus, MSCs were labeled with Bi@US-tubes (24 μM Bi3+ from the Stock Solution). After 24 h, the cells were washed with phosphate buffered saline (1xPBS) three times and exposed to trypsin-EDTA for 5 mins. The cell suspension of Bi@US-tubes-labeled MSCs in αMEM was then passed through a 70 μm nylon filter and transferred to centrifuge tubes. A density gradient centrifugation technique was performed to isolate Bi@US-tubes-labeled MSCs from the excess of Bi@US-tubes in solution. Histopaque®-1077 (Sigma-Aldrich) was slowly added in a 1:2 volume ratio (Histopaque:cells) to the bottom of the tube and centrifuged at 400 × g for 20 min. The extracted cells were washed twice with αMEM and centrifuged at 1500 rpm for 10 min. Control and labeled cells were counted (Beckman Coulter MultiSizer 3) and prepared for ICP-OES analysis.
2.7 Cell viability studies
A LIVE/DEAD viability/cytotoxicity assay kit (Invitrogen) was used to determine the viability of the Bi@US-tubes-labeled cells. Positive controls (unlabeled MSCs) and negative controls (unlabeled MSCs treated with 70% methanol for 20 min) were also evaluated. A green fluorescence was observed when calcein AM is cleaved by esterase activity in viable cells, whereas a red fluorescence was observed from ethidium homodimer-1 (EthD-1) which only enters cells with a compromised cellular membrane. Both LIVE/DEAD reagents were added to the cell samples and incubated in the dark for 30 min at room temperature. Typical analyses contained approximately 5 × 10⁵ cells per sample. Fluorescence-activated cell sorting (FACS) analysis was performed using a BD Excalibur Flow Cytometer.
2.8 Statistical Analysis
Statistical significance was determined by ANOVA analysis. The equality of mean response (viability) between replicate populations (n = 3) of Bi@US-tubes-labeled MSCs and unlabeled MSCs was tested using one-way analysis of variance (ANOVA, α = 0.05 and Tukey test). The null hypothesis is that the average fraction of viable cells between the labeled samples and the controls are equal.
2.9 Micro CT imaging studies
Micro-CT analysis was performed using a microcomputed tomography Skyscan 1172 scanner. The samples were imaged at a beam voltage of 100 kV, beam current of 100 mA, with a 1280×1024 camera resolution, a 1.0 mm aluminum filter, and the scanning resolution set to 10 microns per pixel. Each scan was performed at 180 degrees, with 0.7 degrees per rotation, a frame averaging of 4, and random camera movement set to 10. The reconstruction of these images into bmp files was performed by NReconversion 1.6 (Skyscan software). All samples were reconstructed with the following parameters: smoothing = 5, ring artifact reduction = 5, beam hardening correction = 30%, and thresholdings from 0 to 0.2207. All analyses were performed with Skyscan’s CTAn software, version 1.6. Empty US-tubes and Bi@US-tubes (5 mg each) were packed in separate tygon tube sample holders and analyzed for mean HU values. The empty tygon tube holder was used to calibrate the instrument for the sample response.
2.10 X-Ray CT imaging studies
Unlabeled and Bi@US-tubes-labeled MSCs pellets (30 × 106 MSCs/pellet) in 1 mL 1xPBS) were imaged with a Siemens SOMATOM Sensation-64 clinical CT scanner (Siemens Medical Systems, Forchheim, Germany). In order to image high resolution data, a ECG-gated coronary protocol with the following acquisition parameters were used: X-ray tube potential = 100 kV, effective tube current of 600mA, slice collimation = 64 × 0.6 mm2, pitch = 0.18 (rate was set at 60 beats per min), reconstructed using a B25f smooth kernel with slice thickness of 0.75 mm with 50% overlap. For quantitative analysis of the CT images, the densities were measured in regions of interest (ROI) expressed in Hounsfield units (HU = 1,000 (ktissue – kwater) / kwater), where k is the specific absorption. Radiodensity values were the average measured for axial, sagittal, and coronal views. Images were analyzed using Osirix v. 3.0.1 32 bit.
3. Results and Discussion
3.1 Characterization of Bi@US-tubes
Bi@US-tubes are nanoscale carbon capsules (derived from full-length single-walled carbon nanotubes) with a length of 20-80 nm and diameter of ~ 1.4 nm, which are internally loaded with Bi3+-ions (as BiCl3) as a new CT CA material. Subsequent work up of the resulting BiCl3@US-tubes material using pH 5.5 HPLC water, produces a BiOCl/Bi2O3-like precipitate within the US-tubes to yield a final material that is called Bi@US-tubes in this work. Figure 1 shows a summary for the synthesis of the Bi@US-tubes and their application as a new X-ray CT CA agent for stem cell labeling and tracking.
Figure 1.
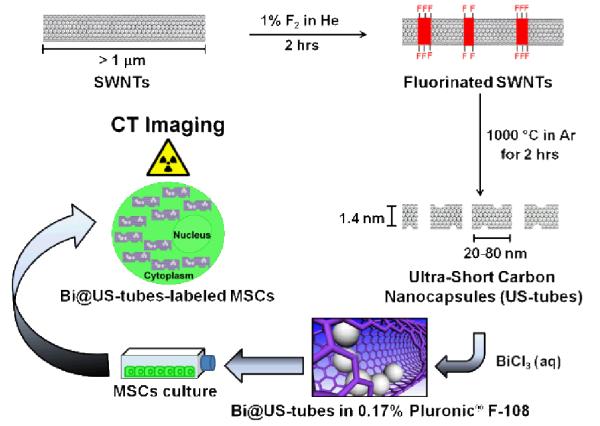
Schematic representation for the synthesis of the Bi@US-tubes and their application as a new X-ray CT CA agent for stem cell labeling and tracking.
Bi3+-ion loading occurs through the sidewall defects or the end of tube openings created during the SWNT cutting procedure (see Experimental Section). The bismuth content inside the US-tubes (Bi 2.66 % by weight) was determined by ICP-OES performed in-house and confirmed by a commercial laboratory (Galbraith Labs, Inc. Nashville, Tenn., USA), with agreement within 0.6%. Preparation of the Bi@US-tubes was accomplished by suspending US-tubes in an aqueous bismuth chloride solution in a scintillation vial under acidic conditions for 24 hours (see Experimental Section for details and Supporting Information, Figures 1S). The material was characterized by HR-TEM, EDS, TGA, XPS, and Raman spectroscopy. To determine the stability of the Bi@US-tubes in a biologically-relevant environment, dialysis studies in different media such as phosphate-buffered saline (PBS) and ethylenediaminetetraacetic acid (EDTA) at 37 °C were performed. Suspensions of Bi@US-tubes in 0.17% Pluronic® F-108 NF showed excellent stability in both media for over 168 hours, with more than 90% of the bismuth remaining within the nanocapsules (Supporting Information, Figure 2S).
To confirm the encapsulation of bismuth as BiOCl/Bi2O3 within the US-tubes, HR-TEM and EDS studies of the Bi@US-tubes sample were conducted (Figure 2). The HR-TEM image (inset) confirms the presence of small Bi3+-ion-containing clusters observed as dark spots (designated by arrows) along the length of bundled US-tubes. The EDS spectrum exhibited the chemical composition of the Bi@US-tubes, revealing the presence of carbon and nickel (metal catalyst) from the US-tube nanocapsules, copper (from the TEM grid), and bismuth, oxygen, and chloride (from the Bi3+-ion clusters). The Bi, O, and Cl energy (keV) peaks are in good agreement with previous reports of bismuth compounds.46-49
Figure 2.
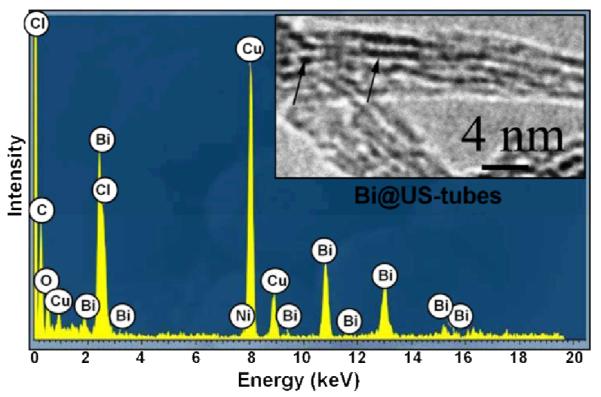
HR-TEM image and EDS spectrum of Bi@US-tubes.
EDS data shows a 1:1 (Bi:Cl) atomic ratio in the sample which is the same ratio as obtained by XPS. We could not use oxygen atomic percentages for a more detailed characterization of the bismuth-ion clusters because the US-tubes also likely to retain water molecules confined in their interior space.50 For this reason, we have simply used Bi@US-tubes through the manuscript as the abbreviation for the material. This abbreviation parallels that used previously for the Gd3+-ion-loaded gadonanotubes (i.e. Gd@US-tubes).29
Figure 3 shows the TGA curves of BiOCl, Bi2O3, US-tubes, and Bi@US-tubes under argon atmosphere. The TGA curve of Bi2O3 is stable over the entire temperature range.51 In contrast, the TGA curve of BiOCl starts to lose weight at a temperature as high as 610 °C, due to the decomposition of BiOCl into bismuth monoxide (BiO) and chlorine gas (Cl2).48, 51, 52 US-tubes showed a 1% weight loss from 50-100 °C, probably due to a small amount of residual water in the US-tube sample and did not show any further weight loss until over 250 °C. Only a 12% weight loss for the US-tubes was observed over the entire 250-800 °C range. The TGA behavior of the Bi@US-tube sample shows three weight loss steps. The first weight loss occurred over 150 to 450 °C probably due to the loss of BiCl3·H2O and BiClx (x = 1, 2, 3) species; the second weight loss between 450 to 650 °C is attributed to the decomposition of Bi(OH)2Cl; and the third weight loss at 610 °C is due to the decomposition of BiOCl.48, 52, 53 Overall, the Bi@US-tubes displayed approximately a 14% weight loss by 750 °C, suggesting a slow release/decomposition of the Bi3+-ion species from the US-tubes.
Figure 3.
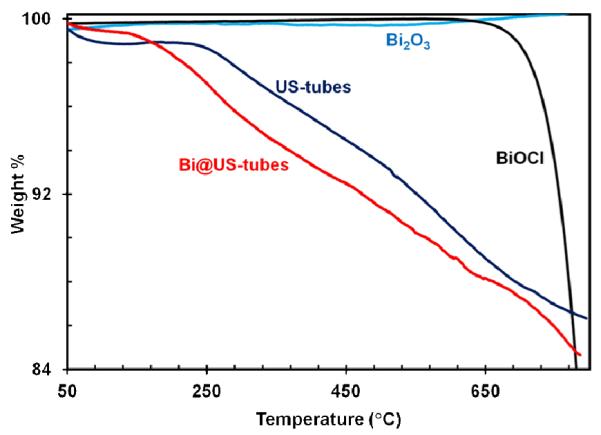
TGA curves for BiOCl, Bi2O3, US-tubes, and Bi@US-tubes under an argon atmosphere.
In order to assess the oxidation state of bismuth after encapsulation within the US-tubes, XPS measurements in the Bi 4f spectral region for the Bi@US-tubes, BiOCl, and Bi2O3 materials were performed (Figure 4). Table 1 shows the binding energies of the Bi 4f core level for the three bismuth materials. The XPS spectrum of Bi@US-tubes displays the Bi 4f7/2 and 4f5/2 peaks at 160.0 and 165.4 eV binding energies, respectively. The separation between Bi 4f7/2 and 4f5/2 peaks is 5.4 eV. The binding energies for the Bi@US-tubes are similar to the values obtained for the BiOCl, and Bi2O3 materials.54-57 These results support a Bi3+ oxidation state for bismuth within the Bi@US-tubes.
Figure 4.
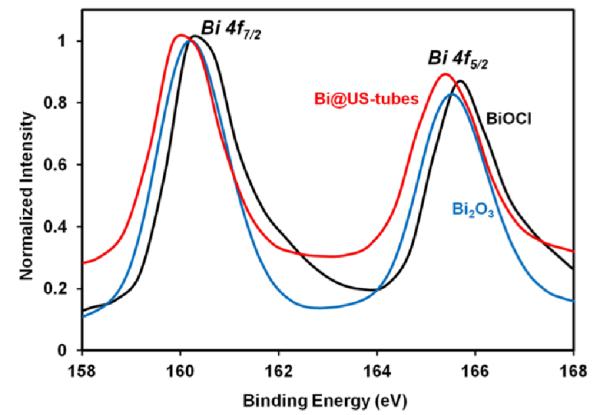
XPS spectrum of Bi@US-tubes, BiOCl, and Bi2O3 over the Bi 4f spectral region.
Table 1.
XPS binding energies (eV) of the Bi 4f spectral region for Bi@US-tubes, BiOCl, and Bi2O3.
| Material | Binding Energy (eV) | |
|---|---|---|
| Bi 4f7/2 | Bi 4f5/2 | |
| BiOCl | 160.5 | 165.7 |
| Bi2O3 | 160.2 | 165.6 |
| Bi@US-tubes | 160.0 | 165.4 |
Figure 5 shows Raman spectra of the US-tubes and Bi@US-tube samples. The G-, D-, and radial breathing modes (RBM) of the US-tubes are shown to be sensitive to encapsulation of bismuth ions within the US-tubes. US-tubes displayed well-known characteristic Raman peaks with RBM at ~132, 145, and 156 cm−1, and with D- and G- bands located at ~1,316 and 1,577 cm−1, respectively.44, 58 As denoted by an asterisk in the Bi@US-tubes spectrum, the G-band showed the formation of a shoulder ~1,555 cm−1 (Figure 5b) and RBM peaks at ~125 and 161 cm−1 with a broad tailing until 275 cm−1 (Figure 5c). A similar behavior has been observed for the encapsulation of ions and/or organic molecules in SWNTs.42, 59, 60 Compared to our previous findings for the encapsulation of nitroxide radicals within the US-tubes (Tempo- and Iodo-Tempo@US-tubes),42 the G-band shoulder and RBM peaks of the Bi@US-tubes (Figure 5b and 5c) are less intense due to the presence of Bi3+ ions than for organic molecules within the US-tubes. The peak at 125 cm−1 and the broad tail from 170 to 275 cm−1 in the RBM region are in good agreement with Bi-Cl and Bi-O vibration modes,46, 61-65 suggesting the presence of Bi3+-ion clusters within the US-tube.
Figure 5.

(a) Complete Raman spectra of US-tubes and Bi@US-tubes (b) the expanded G- and D- bands region, and (c) the expanded RBM region. Spectral changes due to encapsulation of bismuth within US-tubes are denoted by an asterisk.
3.2 Cell culture labeling and cytotoxicity studies
The clinical application of many of CAs are limited by their toxicity. Figure 6 shows the cell viability of unlabeled MSCs and Bi@US-tubes-labeled MSCs plotted from the fluorescence intensities of Calcein AM and EthD-1 using FACS analysis. Unlabeled MSCs controls show that more than 98% of the viable cells were calcein-positive. Cell viability showed no statistically significant difference (P < 0.05) between controls and labeled cell populations. MSCs were successfully labeled with the Bi@US-tubes (24 μM Bi3+ ions), which delivered 506 ng / 30 million cells or approximately 0.5 × 10⁸ Bi3+ ions per cell, without affecting cell viability for 24 hours (99% based on Calcein AM from LIVE/DEAD assay).
Figure 6.
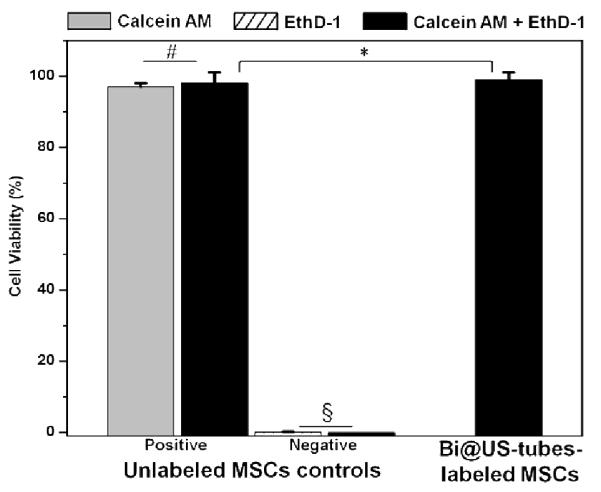
Cell viability of unlabeled MSCs and Bi@US-tubes-labeled MSCs after 24 hours using the LIVE/DEAD viability/toxicity assay kit. Plots show the average of cells and the error bars correspond to the standard deviation. Statistical significance was determined by ANOVA analysis (#P and §P < 0.05 for cell viability between unlabeled MSCs controls, and *P < 0.05 for labeled cells compared to controls).
Recently, Barnett et al. reported the encapsulation of bismuth into alginate-poly-L-lysine-alginate microcapsules (Bi X-Caps) as vehicles for therapeutic drug and cell delivery.66 Each Bi X-Caps contains around 2.87 to 3.23 ng / islet per cell transplantation procedure for in vitro and in vivo X-ray tracking. Assuming that each islet contained around 1000 cells per islet, Bi@US-tubes contain a 160-190 times lower bismuth concentration for labeling the same amount of cells compared to the Bi X-Caps, avoiding potential toxicity and differentiation pathway issues due to high payload of CA in labeled stem cells. In addition, our results are in good agreement with previous reports for labeling concentration and cellular uptake of Gadonanotubes (GNTs) and Gadofullerenes as magnetic nanolabels.43, 67 Since acceptable toxicity profiles have been reported for bismuth subsalicylate (Pepto-Bismol®) that is typically administered orally in several grams per day,27 free Bi3+-ions in cells (LD50 = 5 mM for hepatocytes and 8 mM for macrophages),19 Bi(NO3)3·5H2O in rats (LD50 = 4042 mg / Kg),68 and for US-tubes in Swiss mice (Dose Level = 1000 mg / Kg),35 we do not anticipate potential toxicity issues for applications in labeling and tracking stem cells, experimental small-animal, and clinical imaging. Nevertheless, additional studies are currently underway to fully assess the safety profile of Bi@US-tubes CAs.
3.3 Micro-CT and X-ray CT imaging
Finally, we have conducted phantom imaging studies for the Bi@US-tubes using micro-CT and a clinical X-ray CT scanner to evaluate their potential use as CT CAs. Figure 7 shows the micro-CT imaging from powders of empty US-tubes and Bi@US-tubes. As seen in the figure, the encapsulation of bismuth ions within US-tubes produces a significant opacity enhancement in comparison with empty US-tubes. Radiodensities of the empty US-tubes and Bi@US-tubes are 9.8 ± 1.1 HU and 12.0 ± 0.2 HU, respectively. The empty tygon tube holder exhibited an attenuation value of −977.9 ± 0.3 HU. The attenuation effect from the Bi@US-tubes is 1.2 times greater than for empty US-tubes.
Figure 7.
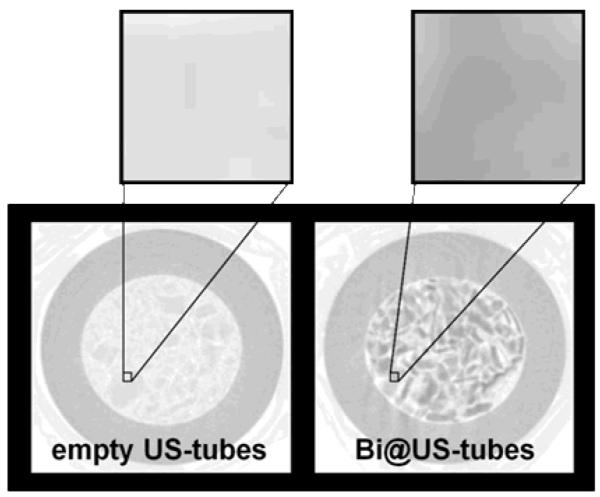
Micro-CT imaging from powders of empty US-tubes and Bi@US-tubes at 110 kV. Each tygon tube sample holder was packed with 5 mg of sample.
Similar to the results obtained for the powder samples in the micro-CT experiment, suspensions of the Bi@US-tubes also follow the same trend of 1.3 times greater attenuation compared to the empty US-tubes. The radiodensities from suspensions of the empty US-tubes and Bi@US-tubes in 0.17% Pluronic® F-108 NF were measured in a clinical X-ray CT scanner before stem cells labeling to give values of 36.9 ± 3.8 HU and 46.7 ± 4.9 HU, respectively. The attenuation of the Bi@US-tubes varied linearly as a function of bismuth concentration (Supporting Information, Figure 3S; r2 = 0.998, CT coefficient value = 1079 HU/ mM). Figure 8 shows the X-ray CT image of unlabeled and Bi@US-tubes-labeled MSCs cell pellets. Figure 8a shows a photograph of the Eppendorf tubes containing unlabeled MSCs and Bi@US-tubes-labeled MSCs (30 × 106 MSCs/pellet) in 1 mL 1xPBS. The unlabeled MSC pellet has a white color, but upon labeling with Bi@US-tubes, a darking arises due to the presence of the US-tubes. Figure 8b and 8c show the 2D axial CT view from the unlabeled MSCs and Bi@US-tubes-labeled MSCs pellets. Substantial CT contrast enhancement was observed between the unlabeled MSCs and Bi@US-tubes-labeled MSCs. Radiodensities of the unlabeled MSCs and Bi@US-tubes-labeled MSCs are 74.1 ± 1.5 HU and 110.1 ± 4.9 HU, respectively. The HU values are an indicator of the ability of the material under study to attenuate X-rays with respect to water (0 HU). A minimum difference of 30 HU is considered necessary to distinguish neighboring tissue or to detect “abnormalies”, such as tumors in otherwise normal tissue surroundings.7 There is a difference of 36 HU between both and a nearly two-fold increase in contrast enhancement of the Bi@US-tubes-labeled MSCs compared to unlabeled MSCs.
Figure 8.

X-ray CT imaging at 110 kV of the unlabeled and Bi@US-tubes-labeled MSCs cell pellets in 1xPBS. a) Photographs of unlabeled (left) and labeled (right) MSCs cell pellets before CT. b) 2D axial CT view of Bi@US-tubes-labeled MSCs showed a strong contrast enhancement compared to unlabeled MSCs. c) Regions of high densities were identified with a two-dimensional reconstruction using a color scale. The right panel in (c) indicates the color scale of radiodensities in HU.
Recently, Hossain et al. demonstrated that small bismuth nanoparticles located closer to cell nucleus show higher X-ray dose enhancement factor (DEF) values compare to other heavy metals.69 It is important to mention that the attenuation properties of a sample are energy- and material- dependent. For example, different body tissues attenuate an X-ray beam to different extents depending on the density of the specific tissue. Bi@US-tubes-labeled MSCs have a greater attenuation value in comparison to fat (−130 to −70 HU), fluids (0 to 30 HU depending on their contents), and also muscle, kidneys, liver, and soft-tissue tumors (30 to 60 HU).7, 70, 71 The radiodensity values obtained from suspensions of the Bi@US-tubes in 0.17% Pluronic® F-108 NF (46.7 HU) and Bi@US-tubes-labeled MSCs (110.1 HU) are equivalent to that of about 21.6 and 50.9 mM iodine CA (2.36 M Iopromide, 300 mg I mL−1)19 (Supporting Information, Figure 3S), respectively. Our results suggest that the Bi@US-tubes attenuation values are 2120 times greater than the iodinated based CA at the same concentration. Compared to previous reports of other CT CAs, Bi@US-tubes-labeled MSCs used 40-1000 times less bismuth concentration (mg / mL) to achieve significant contrast enhancement (~110 HU) compared to polymer-coated bismuth nanoparticles,17, 19, 25, 72, 73 and clinical blood-pool iodinated-based CAs that require high payloads of iodine and large volumes for efficient contrast.10, 74, 75
4. Conclusions
Bismuth (III) ions have been successfully encapsulated within US-tubes in a form resembling BiOCl or Bi2O3. Characterization data for the Bi@US-tube material confirms the presence of Bi3+-ions clusters within US-tubes. Suspensions of Bi@US-tubes in 0.17% Pluronic® F-108 NF showed excellent stability in water, PBS buffer, and cell culture medium. Bi@US-tubes can be successfully internalized by MSCs without affecting cell viability, and Bi@US-tubes-labeled MSCs produced brighter CT images with a two-fold increase in contrast enhancement compared to unlabeled MSCs. In summary, we have been discovered a nanoplatform to deliver bismuth as a new class of CT CA. To our best knowledge, this is the first evidence of the use of bismuth and carbon nanotubes for this type of application. The combination of bismuth and US-tubes into a single system “Bi@US-tubes” offers a number of advantages: (i) good stability in relevant biological media; (ii) excellent intracellular accumulation in stem cells; (iii) CT cellular imaging for the first time; (iv) high contrast and sensitivity at low bismuth loading levels; (v) facile surface modification to improve their solubility, biocompatibility, and molecular targeting capabilities (e.g folic acid, RGD peptides, antibodies); (vi) multimodal imaging nanoplatform (e.g combined CT, MRI, PET, and EPRI CAs) by modifying its cargo inside or outside the nanocapsule. These unique characteristics make the Bi@US-tubes CA ideally suited for X-ray imaging applications in many fields, such as filler for bone cements, radiation-shield lightweight nanomaterials, and spectral (multicolored) CT. Current efforts are focused on exploring and extending its potential for in vivo labeling and tracking stem cells.
Supplementary Material
Acknowledgements
We gratefully acknowledge the Robert A. Welch Foundation (C-0627) and the National Institutes of Health (NIH) Challenge Grant (1RC1EB010791-01) for support of this work. Lesa A. Tran also thanks the National Science Foundation (NSF) for a Graduate Research Fellowship (DGE-0940902). The authors thank Allan Prejusa (Texas Heart Institute at St. Luke’s Episcopal Hospital, Houston, TX, USA) for flow cytometry analysis; and Adem Guven, Samuel Boyle, and Avishek Saha at Rice University for their helpful discussions about TEM techniques for carbon nanotubes.
Footnotes
Electronic Supplementary Information (ESI) available: Synthesis, stability profiles, and radiodensities of the Bi@US-tubes. See DOI: 10.1039/b000000x/
References
- 1.Tongers J, Losordo DW, Landmesser U. Eur. Heart J. 2011;32:1197–1206. doi: 10.1093/eurheartj/ehr018. [DOI] [PMC free article] [PubMed] [Google Scholar]
- 2.Villa C, Erratico S, Razini P, Fiori F, Rustichelli F, Torrente Y, Belicchi M. Int. J. Mol. Sci. 2010;11:1070–1081. doi: 10.3390/ijms11031070. [DOI] [PMC free article] [PubMed] [Google Scholar]
- 3.Rutten A, Prokop M. Anticancer Agents Med. Chem. 2007;7:307–316. doi: 10.2174/187152007780618162. [DOI] [PubMed] [Google Scholar]
- 4.Studwell AJ, Kotton DN. Mol. Ther. 2011;19:1933–1941. doi: 10.1038/mt.2011.194. [DOI] [PMC free article] [PubMed] [Google Scholar]
- 5.Zagorchev L, Oses P, Zhuang Z, Moodie K, Mulligan-Kehoe MJ, Simons M, Couffinhal T. J. Angiogenes. Res. 2010;2:1–11. doi: 10.1186/2040-2384-2-7. [DOI] [PMC free article] [PubMed] [Google Scholar]
- 6.Yu S-B, Watson AD. Chem. Rev. 1999;99:2353–2377. doi: 10.1021/cr980441p. [DOI] [PubMed] [Google Scholar]
- 7.Krause W. Adv. Drug Deliv. Rev. 1999;37:159–173. doi: 10.1016/s0169-409x(98)00105-7. [DOI] [PubMed] [Google Scholar]
- 8.Speck U. Molecular Imaging I: Handbook of Experimental Pharmacology. 2008;185:167–175. doi: 10.1007/978-3-540-72718-7_8. [DOI] [PubMed] [Google Scholar]
- 9.Mattrey RF, Aguirre DA. Acad. Radiol. 2003;10:1450–1460. doi: 10.1016/s1076-6332(03)00642-1. [DOI] [PubMed] [Google Scholar]
- 10.Hallouard F, Anton N, Choquet P, Constantinesco A, Vandamme T. Biomaterials. 2010;31:6249–6268. doi: 10.1016/j.biomaterials.2010.04.066. [DOI] [PubMed] [Google Scholar]
- 11.Kweon S, Lee H-J, Hyung WJ, Suh J, Lim JS, Lim S-J. Pharm. Res. 2010;27:1408–1415. doi: 10.1007/s11095-010-0135-5. [DOI] [PubMed] [Google Scholar]
- 12.Petersein J, Franke B, Fouillet X, Hamm B. Invest. Radiol. 1999;34:401–409. doi: 10.1097/00004424-199906000-00003. [DOI] [PubMed] [Google Scholar]
- 13.Krause W, Leike J, Sachse A, Schuhmann-Giampieri G. Invest. Radiol. 1993;28:1028–1032. doi: 10.1097/00004424-199311000-00011. [DOI] [PubMed] [Google Scholar]
- 14.Hainfield JF, Slatkin DN, Focella TM, Smilowitz HM. Br. J. Radiol. 2006;79:248–253. doi: 10.1259/bjr/13169882. [DOI] [PubMed] [Google Scholar]
- 15.Hainfield JF, Slatkin DN, Smilowitz HM. Phys. Med. Biol. 2004;49:N309–N315. doi: 10.1088/0031-9155/49/18/n03. [DOI] [PubMed] [Google Scholar]
- 16.Brown A, Goforth A. Chem. Mater. 2012;24:1599–1605. [Google Scholar]
- 17.Perera V, Hao J, Gao M, Gough M, Zavalij P, Flask C, Basilion J, Huang S. Inorg. Chem. 2011;50:7910–7912. doi: 10.1021/ic200587s. [DOI] [PubMed] [Google Scholar]
- 18.Miersch L, Ruffer T, Mehring M. Chem. Commun. 2011;47:6353–6355. doi: 10.1039/c1cc11299f. [DOI] [PubMed] [Google Scholar]
- 19.Rabin O, Pérez JM, Grimm J, Wojtkiewicz G, Weissleder R. Nat. Mater. 2006;5:118–122. doi: 10.1038/nmat1571. [DOI] [PubMed] [Google Scholar]
- 20.Ashcroft JM, Gu W, Zhang T, Hughes SM, Hartman KB, Hofmann C, Kanaras AG, Kilcoyne DA, Le Gros M, Yin Y, Alivisatos AP, Larabell CA. Chem. Commun. 2008:2471–2473. doi: 10.1039/b801392f. [DOI] [PMC free article] [PubMed] [Google Scholar]
- 21.Alric C, Taleb J, Duc G, Mandon C, Billotey C, Meur-Herland A, Brochard T, Vocanson F, Janier M, Perriat P, Roux S, Tillement O. J. Am. Chem. Soc. 2008;130:5908–5915. doi: 10.1021/ja078176p. [DOI] [PubMed] [Google Scholar]
- 22.Kim D, Park S, Lee JH, Jeong Y, Jon S. J. Am. Chem. Soc. 2007;129:7661–7665. doi: 10.1021/ja071471p. [DOI] [PubMed] [Google Scholar]
- 23.Cai Q-Y, Kim S-H, Choi K, Kim S-Y, Byum S-J, Kim K-W. Invest. Radiol. 2007;42:797–806. doi: 10.1097/RLI.0b013e31811ecdcd. [DOI] [PubMed] [Google Scholar]
- 24.Kinsella JM, Jimenez RE, Karmali PP, Rush AM, Kotamraju V, Gianneschi N, Ruoslahti E, Stupack D, Sailor MJ. Angew. Chem. Int. Ed. 2011;50:12308–12311. doi: 10.1002/anie.201104507. [DOI] [PMC free article] [PubMed] [Google Scholar]
- 25.Pan D, Roessl E, Schlomka J-P, Caruthers S, Senpan A, Scott MJ, Allen JS, Zhang H, Hu G, Gaffney PJ, Choi E, Rasche V, Wickline S, Proksa R, Lanza GM. Angew. Chem. Int. Ed. 2010;49:9635–9639. doi: 10.1002/anie.201005657. [DOI] [PMC free article] [PubMed] [Google Scholar]
- 26.Choi HS, Liu W, Nasr K, Misra P, Bawendi MG, Frangioni JV. Nat. Nanotechnol. 2010;5:42–47. doi: 10.1038/nnano.2009.314. [DOI] [PMC free article] [PubMed] [Google Scholar]
- 27.Briand G, Burford N. Chem. Rev. 1999;99:2601–2657. doi: 10.1021/cr980425s. [DOI] [PubMed] [Google Scholar]
- 28.Sadler P, Li H, Sun H. Coord. Chem. Rev. 1999;185-186:689–709. [Google Scholar]
- 29.Sitharaman B, Kisell K, Hartman KB, Tran L, Baikalov A, Rusakova I, Sun Y, Khant HA, Ludtke SJ, Chiu W, Laus S, Tóth E, Helm L, Merbach AE, Wilson LJ. Chem. Commun. 2005:3915–3917. doi: 10.1039/b504435a. [DOI] [PubMed] [Google Scholar]
- 30.Sethi R, Mackeyev Y, Wilson LJ. Inorg. Chim. Acta. 2012;393:165–172. [Google Scholar]
- 31.Gizzatov A, Dimiev A, Mackeyev Y, Tour JM, Wilson LJ. Chem. Commun. 2012;48:5602–5604. doi: 10.1039/c2cc31407j. [DOI] [PubMed] [Google Scholar]
- 32.Schnorr JM, Swager TM. Chem. Mater. 2011;23:646–657. [Google Scholar]
- 33.Wu H-C, Chang X, Liu L, Zhao F, Zhao Y. J. Mater. Chem. 2010;20:1036–1052. [Google Scholar]
- 34.Raffa V, Ciofani G, Vittorio O, Riggio C, Cuschier A. Nanomedicine. 2010;5:89–97. doi: 10.2217/nnm.09.95. [DOI] [PubMed] [Google Scholar]
- 35.Kolosnjaj-Tabi J, Hartman KB, Boudjemaa S, Ananta JS, Morgant G, Szwarc H, Wilson LJ, Moussa F. ACS Nano. 2010;4:1481–1492. doi: 10.1021/nn901573w. [DOI] [PubMed] [Google Scholar]
- 36.Mackeyev Y, Hartman KB, Ananta JS, Lee A, Wilson LJ. J. Am. Chem. Soc. 2009;131:8342–8343. doi: 10.1021/ja900918x. [DOI] [PMC free article] [PubMed] [Google Scholar]
- 37.Hassan AA, Chan BT-Y, Tran L, Hartman KB, Ananta JS, Mackeyev Y, Hu L, Pautler RG, Wilson LJ, Lee AV. Contrast Media Mol. Imaging. 2010;5:34–38. doi: 10.1002/cmmi.293. [DOI] [PubMed] [Google Scholar]
- 38.Ashcroft JM, Hartman KB, Mackeyev Y, Hofmann C, Pheasant S, Alemany LB, Wilson LJ. Nanotechnology. 2006;17:5033–5037. [Google Scholar]
- 39.Guven A, Rusakova I, Lewis MT, Wilson LJ. Biomaterials. 2012;33:1455–1461. doi: 10.1016/j.biomaterials.2011.10.060. [DOI] [PMC free article] [PubMed] [Google Scholar]
- 40.Ashcroft JM, Hartman KB, Kisell K, Mackeyev Y, Pheasant S, Young S, Van der Heide P, Mikos A, Wilson LJ. Adv. Mater. 2007;19:573–576. [Google Scholar]
- 41.Hartman KB, Hamlin DK, Wilbur DS, Wilson LJ. Small. 2007;3:1496–1499. doi: 10.1002/smll.200700153. [DOI] [PubMed] [Google Scholar]
- 42.Rivera EJ, Sethi R, Qu F, Krishnamurthy R, Muthupillai R, Alford M, Swanson M, Eaton SS, Eaton GR, Wilson LJ. Adv. Funct. Mater. 2012;22:3691–3698. [Google Scholar]
- 43.Tran L, Krishnamurthy R, Muthupillai R, Cabreira-Hansen M, Willerson JT, Perin EC, Wilson LJ. Biomaterials. 2010;31:9482–9491. doi: 10.1016/j.biomaterials.2010.08.034. [DOI] [PMC free article] [PubMed] [Google Scholar]
- 44.Gu Z, Peng H, Hauge RH, Smalley RE, Margrave JL. Nano Lett. 2002;2:1009–1013. [Google Scholar]
- 45.Bosch P, Pratt S, Stice S. Biol. Reprod. 2006;74:46–57. doi: 10.1095/biolreprod.105.045138. [DOI] [PubMed] [Google Scholar]
- 46.Xiong J, Cheng G, Li G, Qui F, Chen R. RSC Adv. 2011;1:1542–1553. [Google Scholar]
- 47.Wu S, Wang C, Cui Y, Wang T, Huang B, Zhang X, Qin X, Brault P. Mater. Lett. 2010;64:115–118. [Google Scholar]
- 48.Deng Z, Tang F, Muscat AJ. Nanotechnology. 2008;19:295705–295710. doi: 10.1088/0957-4484/19/29/295705. [DOI] [PubMed] [Google Scholar]
- 49.Deng H, Wang J, Peng Q, Wang X, Li Y. Chem. Eur. J. 2005;11:6519–6524. doi: 10.1002/chem.200500540. [DOI] [PubMed] [Google Scholar]
- 50.Chen Q, Herberg JL, Mogilevsky G, Wang H-J, Stadermann M, Holt JK, Wu Y. Nano Lett. 2008;8:1902–1905. doi: 10.1021/nl080569e. [DOI] [PubMed] [Google Scholar]
- 51.Novokreshchenova MN, Yukhin Y, Bokhonov BB. Chemistry for Sustainable Development. 2005;13:563–568. [Google Scholar]
- 52.Song J-M, Mao C-J, Niu H-L, Shen Y-H, Zhang S-Y. CrystEngComm. 2010;12:3875–3881. [Google Scholar]
- 53.Wosylus A, Hoffman S, Schmidt M, Ruck M. Eur. J. Inorg. Chem. 2010:1469–1471. [Google Scholar]
- 54.Armelao L, Bottaro G, Tondello E. Dalton Trans. 2012;41:5480–5485. doi: 10.1039/c2dt12098d. [DOI] [PubMed] [Google Scholar]
- 55.Cornei N, Tancret N, Abraham F, Mentré O. Inorg. Chem. 2006;45:4886–4888. doi: 10.1021/ic0605221. [DOI] [PubMed] [Google Scholar]
- 56.Yang X, Wang X, Zhang Z. J. Cryst. Growth. 2005;276:566–570. [Google Scholar]
- 57.Zhou S-X, Ke Y, Li J, Lu S. Mater. Lett. 2003;57:2053–2055. [Google Scholar]
- 58.Journet C, Maser WK, Bernier P, Loiseau A, Lamy de la Chapelle M, Lefrant S, Deniard P, Lee R, Fisher JE. Nature. 1997;388:756–758. [Google Scholar]
- 59.Yanagi K, Iakoubovskii K, Matsui H, Matsuzaki H, Okamoto H, Miyata Y, Kazaoui S, Minami N, Kataura H. J. Am. Chem. Soc. 2007;129:4992–4997. doi: 10.1021/ja067351j. [DOI] [PubMed] [Google Scholar]
- 60.Takenobu T, Takano T, Shiraishi M, Murakami Y, Ata M, Kataura H, Achiba Y, Iwasa Y. Nat. Mater. 2003;2:683–688. doi: 10.1038/nmat976. [DOI] [PubMed] [Google Scholar]
- 61.Cheng D, Hong G, Wang W, Yuan R, Ai H, Shen J, Liang B, Gao J, Shuai X. J. Mate. Chem. 2011;21:4796–4804. [Google Scholar]
- 62.Derrouiche S, Loebick CZ, Pfefferle L. J. Phys. Chem. C. 2010;114:3431–3440. [Google Scholar]
- 63.Derrouiche S, Loebick CZ, Wang C, Pfefferle L. J. Phys. Chem. C. 2010;114:4336–4339. [Google Scholar]
- 64.Cao S, Guo C, Lv Y, Guo Y, Liu Q. Nanotechnology. 2009;20:275702–275708. doi: 10.1088/0957-4484/20/27/275702. [DOI] [PubMed] [Google Scholar]
- 65.Ward AJ, Rich AM, Masters A, Maschmeyer T. New J. Chem. 2013;37:593–600. [Google Scholar]
- 66.Barnett BP, Kraitchman DL, Lauzon C, Magee CA, Walczak P, Gilson WD, Arepally A, Bulte JWM. Mol. Pharma. 2006;3:531–538. doi: 10.1021/mp060056l. [DOI] [PubMed] [Google Scholar]
- 67.Sitharaman B, Tran L, Pham QP, Bolskar RD, Muthupillai R, Flamm SD. Contrast Media Mol. Imaging. 2007;2:139–146. doi: 10.1002/cmmi.140. [DOI] [PubMed] [Google Scholar]
- 68.Sano Y, Satoh H, Chiba M, Okamoto M, Serizawa K, Nakashima H, Omae K. J. Occup. Health. 2005;47:293–298. doi: 10.1539/joh.47.293. [DOI] [PubMed] [Google Scholar]
- 69.Hossain M, Su M. J. Phys. Chem. C. 2012;116:23047–23052. doi: 10.1021/jp306543q. [DOI] [PMC free article] [PubMed] [Google Scholar]
- 70.Numburi UD, Schoenhagen P, Flamm SD, Greenberg R, Primak AN, Saba O, Lieber M, Halliburton S. Am. J. Roentgenol. 2010;195:486–493. doi: 10.2214/AJR.09.3872. [DOI] [PubMed] [Google Scholar]
- 71.Hartley C, Ng KL, Jackson A. Am. J. Neuroradiol. 1995;16:1697–1702. [PMC free article] [PubMed] [Google Scholar]
- 72.Aviv H, Bartling S, Grinberg I, Margel S. J. Biomed. Mater. Res. B. 2012;101B:131–138. doi: 10.1002/jbm.b.32826. [DOI] [PubMed] [Google Scholar]
- 73.Pan D, Williams TA, Senpan A, Allen JS, Scott MJ, Gaffney P, Wickline S, Lanza GM. J. Am. Chem. Soc. 2009;131:15522–15527. doi: 10.1021/ja906797z. [DOI] [PMC free article] [PubMed] [Google Scholar]
- 74.DeKrafft KE, Xie Z, Cao G, Tran S, Ma L, Zhou OZ, Lin W. Angew. Chem. Int. Ed. 2009;48:9901–9904. doi: 10.1002/anie.200904958. [DOI] [PubMed] [Google Scholar]
- 75.Hyafil F, Cornily J-C, Feig JE, Gordon R, Vucic E, Amirbekian V, Fisher EA, Fuster V, Feldman LJ, Fayad Z. Nat. Med. 2007;13:636–641. doi: 10.1038/nm1571. [DOI] [PubMed] [Google Scholar]
Associated Data
This section collects any data citations, data availability statements, or supplementary materials included in this article.