Abstract
Background & Aims
Liver disease has been associated with cardiovascular disorders, but little is known about the relationship between serum levels alanine aminotransferase (ALT) and markers of atherogenesis. We investigated the relationship between low–normal and high–normal levels of ALT and an extended panel of cardiovascular risk factors among individuals with no known diseases in a primary care setting.
Methods
We performed a retrospective analysis of data collected from 6442 asymptomatic patients at wellness visits to a primary care setting in central Virginia from 2010 through 2011. Serum levels of ALT were compared with levels of lipids and lipoproteins, as well as metabolic, inflammatory, and coagulation-related factors associated with risk for cardiovascular disease.
Results
Serum levels of ALT were >40 IU/l in 12% of subjects, and in the high–normal range (19–40 IU/L in women and 31–40 IU/L in men) in 25% of subjects. Level of ALT was associated with level of ApoB, concentration and particle size of very low-density lipoproteins (VLDL), concentration of LDL particles (LDL-P), and percentages of small dense LDL (sdLDL) and sdLDL-cholesterol (SdLDL-C) (P<.0001 for all). High–normal level of ALT was associated with higher levels of LDL-cholesterol, LDL-P, sdLDL-C, and sdLDL particles (P<.001 for all). These effects were independent of age, body mass index, or hyperinsulinemia. Increasing levels of ALT and fasting hyperinsulinemia (> 12 mIU/ml) synergized with increasing levels of triglyceride, VLDL particles, LDL-P, sdLDL-C, and percentage of sdLDL-C. Levels of APOA1, HDL-cholesterol, and HDL-class 2 were inversely associated with serum level of ALT (P<.0001 for all).
Conclusion
In an analysis of asymptomatic individuals, increased serum levels of ALT (even high–normal levels) are associated with markers of cardiovascular disease.
Keywords: atherosclerosis, NAFLD, NASH, heart disease
INTRODUCTION
Chronic liver disease is widely prevalent the general population (1). Nonalcoholic fatty liver disease (NAFLD), viral hepatitis and alcohol-induced liver disease are the most common causes of chronic liver disease. NAFLD affects about a third of the general population (2, 3). Chronic liver diseases often remain clinically silent until they become advanced and thus remain undetected for long periods of time. An elevated alanine aminotransferase (ALT) level is a common laboratory marker for underlying chronic liver disease. The ALT level is associated with gender and body mass index (BMI), a risk factor for NAFLD, in the general population (4). Also, a high normal ALT has been shown to be associated with increased liver-related mortality (5). These have led to a proposal to redefine the upper limit of normal ALT as 19 IU/l for women and 31 IU/l for men (5).
The liver plays a central but often underappreciated role in lipoprotein biology. Lipoproteins are critically involved in atherogenesis and cardiovascular disease, the leading cause of death in the general population (6). Triglycerides and cholesterol are packaged with apolipoprotein B (ApoB) in very low-density lipoproteins (VLDL) and exported from the liver. Triglycerides in VLDL are hydrolyzed by lipoprotein lipase in peripheral tissues leaving behind cholesterol-enriched intermediate density lipoproteins (IDL). These undergo additional modification, including action by hepatic lipases, to form low density lipoproteins (LDL) of varying size containing mainly cholesterol. Small dense LDL (sdLDL) particles are highly atherogenic (7, 8). High density lipoproteins (HDL) include apolipoprotein A (ApoA) and mediate reverse cholesterol transport by moving cholesterol from blood vessels back to the liver for clearance.
Historically, cardiovascular risk has been assessed by total-, LDL- and high density lipoprotein (HDL)-cholesterol and triglyceride levels. It is now appreciated that these do not fully capture cardiovascular risk and that lipoprotein particle size and characteristics along with inflammatory and metabolic markers more fully define the cardiovascular risk profile (7, 9–14). Specifically sdLDL cholesterol has been shown to be particularly atherogenic while medium-to-large HDL particles are protective.
Elevated ALT has recently been associated with cardiovascular disease, apolipoprotein B (apoB) and apoB:apoA-1 ratio, LDL and VLDL particle size (15). However, the relationship between ALT and small dense LDL-cholesterol (sdLDL-C), percent-small dense LDL-C (% sdLDL-C), HDL subclass II cholesterol (HDL2-C), and lipoprotein (a) mass (Lp(a)) were not studied. The levels and impact of other known cardiovascular risk factors that are often present concomitantly such as vitamin D, thyroxine stimulating hormone (TSH), homocysteine, and phospholipase A2 (PLA2), were also not evaluated. Furthermore, the potential interactions between ALT and these factors in driving the risk profile are unknown. Importantly, the relationship of high-normal ALT to cardiovascular risk factor profile remains unclear.
We hypothesized that, in a general population of apparently healthy individuals, both a high-normal and high ALT level would have a poorer cardiovascular risk factor laboratory profile than those with a low normal ALT independent of BMI and insulin resistance. We therefore performed a study with the following aims: (1) to define the relationship of ALT with lipoprotein size and characteristics, inflammatory and metabolic risk factors in an asymptomatic ambulatory population in a community-based primary care setting, (2) to determine if this relationship was independent of associated BMI and insulin resistance, and (3) to determine whether the impact of ALT was additive or synergistic with hyperinsulinemia, a marker of insulin resistance.
MATERIALS AND METHODS
A retrospective analysis of a cohort of asymptomatic subjects without any known acute or chronic medical illness undergoing an annual wellness visit in a community-based primary care setting across central Virginia was performed. The advanced cardiovascular profile ordered by primary care physicians as part of this assessment was analyzed by Health Diagnostics Laboratories (HDLINC), a commercial diagnostic laboratory. All tests were performed using well-established methods. HDLINC. maintains de-identified data on all the samples collected including laboratory results, ICD-9 codes and basic demographics information. Patient level data were extracted from the de-identified database. The data was provided to the investigators by HDLINC, under a materials transfer agreement with the investigators’ institution and analyzed entirely by the lead and senior investigators who are fully responsible for the data and conclusions. The manuscript was written in its entirety by the investigators. Given the anonymous nature of the dataset, this study met criteria for exemption from a full Institutional Review Body (IRB) review.
1. The Study Population
The inclusion criteria included asymptomatic subjects undergoing a wellness visit with their primary healthcare provider in a community-based, ambulatory clinical setting. Only data from adults were obtained for this analysis because the number of children receiving such tests was too low for meaningful analysis. Those with known heart disease, type 2 diabetes, hypertension, dyslipidemia and chronic liver disease were excluded. These exclusions were selected to avoid their potential confounding effects, especially the use of lipid-lowering agents e.g. statins, on the endpoints of interest and to allow easier assessment of the linkage between ALT and cardiovascular risk parameters. Also, those with an ALT level > 100 IU/L were excluded because some of these subjects could have had acute liver injury, which was not the focus of this study.
Serum ALT levels were classified into the following three groups:
Low-normal ALT: Less than 19 IU/L in women and less than 31 IU/L in men
High normal ALT: Between 19–40 IU/L in women and 31–40 IU/L in men
Elevated ALT: Greater than 40 IU/L in either men or women
2. Laboratory-based Cardiovascular Risk Factors measured
The specific tests performed and the literature supporting their linkage to cardiovascular risks is listed below:
Lipids, Lipoprotein characteristics and subparticles: A description of lipoprotein measurements is described further in supplemental material and methods section.
Low-density lipoproteins (LDL): LDL-cholesterol (LDL-C), LDL particle concentration (LDL-P) and size, small dense LDL-cholesterol (sdLDL-C), sdLDL particle concentration, % sdLDL-C, apolipoprotein B (apoB) (7, 8, 10, 14).
High density lipoproteins (HDL): HDL-cholesterol (HDL-C), HDL particle and concentration (HDL-P), subclass 2 HDL-C (HDL2-C), apolipoprotein A-1 (apoA-1) (12, 16). HDL2 refers to medium sized HDL particles.
Very low density lipoproteins (VLDL): serum triglycerides, VLDL particle size, VLDL particle concentration (VLDL-P) (17).
Miscellaneous: total cholesterol, lipoprotein (a) (Lp(a)) mass and cholesterol concentration, apoB:apoA-1 ratio (calculated value) and desmosterol: total cholesterol ratio(17, 18).
Insulin resistance-related markers: Insulin resistance was quantitated by measuring serum concentrations of fasting insulin, glucose, free fatty acids (FFA), and hemoglobin A1c (HbA1C). A fasting insulin level > 12 mIU/ml was taken as the principal parameter for analysis of the linkage between insulin resistance and ALT (19). Insulin levels contribute principally to variability in models of insulin resistance such as the homeostatic model and are a validated marker of insulin resistance in non-diabetic individuals (20).
Inflammatory markers: These included serum fibrinogen, high sensitivity C-reactive protein (hsCRP), myeloperoxidase, and lipoprotein associated phospholipase A2 (Lp-PLA2) (11, 21, 22).
Metabolic: These included serum folate, red cell folate, homocysteine, vitamin B12, vitamin D, and thyroxine stimulating hormone (TSH) (22, 23).
3. Liver fat assessment
The presence of hepatic steatosis was assessed by a previously validated formula, as follows (24):
A value of > −0.64 has been previously shown to correlate with hepatic steatosis (> 5% triglycerides), as assessed by magnetic resonance-spectroscopy, with a sensitivity of 86% and specificity of 71%.
4. Plan of analysis
The objective of the analysis was to evaluate the relationship of ALT with conventional lipid markers, lipoprotein particle characteristics, subparticles, markers of inflammation, and metabolic parameters. Means and standard deviations (SD) were used to show differences across the ALT quartiles and various subgroups. The levels of these parameters across various quartiles of ALT were compared by one-way analysis of variance (ANOVA) with Tukey’s HSD adjustment for multiple comparisons. Linear regression was used to determine the strength of the relationship between ALT and other parameters. To ascertain if serum ALT concentrations were independently associated with serum lipoprotein abnormalities, a step-wise multiple regression analysis was performed using the following known risk factors for cardiovascular disease as covariates: age, BMI, hemoglobin A1c, insulin levels, homocysteine, thyroid stimulating hormone and vitamin D. A separate comparison was performed where ALT was categorized as low-normal ALT, high-normal ALT or elevated ALT.
In order to determine if ALT levels and insulin resistance had additive or synergistic effects on the cardiovascular risk factors, the levels of the risk factors were compared across four groups: (1) insulin-sensitive subjects (fasting [insulin] ≤ 12 mIU/ml) with low-normal ALT, (2) insulin-sensitive subjects with high normal or elevated ALT, (3) insulin-resistant subjects with low-normal ALT, and (4) insulin-resistant subjects with high normal or elevated ALT. A P value < .05 was considered significant.
RESULTS
A total of 6551 consecutive subjects having a wellness visit in an outpatient ambulatory care setting had data entered into the database from 2010–2011. Of these, 53 subjects were excluded because they had serum ALT levels > 100 (U/L). Most subjects were between 40–65 years of age (mean age 58 years) and 52% of the cohort was male (Table 1). The majority of subjects were either obese (42%) or overweight (38%), while lean individuals comprised a minority (20%) within the cohort. Obese subjects were slightly younger than their lean and overweight counterparts.
Table 1.
Atherogenic variables in 6,498 subjects with no known chronic medical problems stratified based on serum ALT concentrations. Low normal ALT is ALT < 19 IU/L in women and <31 IU/L in men; high normal ALT is ALT values of 19–40 IU/L in women and 31–40 IU/L in men; and elevated ALT is ALT > 40 IU/L. All data presented as mean ± S.D.
| Entire Cohort | Low Normal ALT | High Normal ALT | Elevated ALT | P-value | |
|---|---|---|---|---|---|
| DEMOGRAPHICS | |||||
| N | 6498 | 4035 | 1703 | 760 | |
| Age (years) | 58±14 | 59±14 | 58±12 | 53±12 | <.0001 |
| Gender (%male) | 52 | 29.1±5.7 | 30.1±5.9 | 31.3±5.5 | <.0001 |
| BMI (kg/m2) | 29.7±5.8 | 58 | 29 | 72 | <.0001 |
| ALT (IU/L) | 26±18 | 19±6 | 29±6 | 55±14 | <.0001 |
| AST (IU/L) | 26±14 | 21±5 | 27±7 | 41±16 | <.0001 |
|
| |||||
| TRADITIONAL FACTORS | |||||
| HDL-C (mg/dL) | 52±14 | 52±14 | 53±14 | 48±13 | <.0001 |
| LDL-C (mg/dL) | 96±33 | 95±31 | 98±34 | 100±34 | <.0001 |
| Triglycerides (mg/dL) | 137±123 | 126±93 | 144±148 | 174±167 | <.0001 |
| Total cholesterol (mg/dL) | 181±44 | 178±42 | 185±46 | 184±46 | <.0001 |
|
| |||||
| INSULIN RESISTANCE | |||||
| Hemoglobin A1c (%) | 5.9±1.1 | 5.9±1.1 | 5.9±1.0 | 6.0±1.2 | .024 |
| Free Fatty Acids (mmol/L) | 0.66±0.27 | 0.63±0.26 | 0.69±0.26 | 0.70±0.29 | <.0001 |
| Glucose (mg/dL) | 107±36 | 105±35 | 108±33 | 112±42 | <.0001 |
| Insulin (uU/mL) | 14.8±17.8 | 13±14.1 | 16±16.5 | 21.2±25 | <.0001 |
|
| |||||
| VLDL | |||||
| Apolipoprotein-B (mg/dL) | 88±26 | 86±24 | 90±27 | 94±27 | <.0001 |
| VLDL-P (nmol/L) | 3.6±6.9 | 2.9±5.4 | 3.9±6.3 | 6.1±11.7 | <.0001 |
| VLDL size (nm) | 47.2±6.2 | 46.3±5.8 | 48.0±6.3 | 50±6.8 | <.0001 |
|
| |||||
| LDL | |||||
| LDL-P (mg/dL) | 1515±551 | 1472±524 | 1550±568 | 1650±603 | <.0001 |
| %sdLDL-C | 27.5±9.7 | 26.4±8.1 | 28.3±12 | 31.2±10.6 | <.0001 |
| sdLDL-C (mg/dL) | 26.4±12.8 | 25.0±11.5 | 27.6±13.7 | 31.1±15.5 | <.0001 |
| sdLDL-P (nmol/L) | 793±474 | 753±443 | 809±486 | 956±538 | <.0001 |
|
| |||||
| HDL | |||||
| Apolipoprotein-A1 (mg/dL) | 149±30 | 148±30 | 154±31 | 143±28 | <.0001 |
| HDL2-C (mg/dL) | 12.3±6 | 12.3±5.9 | 12.6±6.2 | 11.1±6.1 | <.0001 |
|
| |||||
| MISCELLANEOUS | |||||
| Lp(a) (mg/dL) | 38.7±45.2 | 0.60±0.23 | 0.61±0.23 | 0.68±0.25 | <.0001 |
| ApoB:ApoA1 ratio | 0.61±0.24 | 40.3±45.4 | 38.4±46.2 | 32.0±41.9 | <.0001 |
| NAFLD liver fat score | −0.73±2.64 | −1.240±2.222 | −0.38±2.487 | 1.204±3.781 | <.0001 |
| % of cohort with elevated fat score | 33% | 22% | 40% | 75% | -- |
|
| |||||
| INFLAMMATORY | |||||
| Fibrinogen (mg/dL) | 424±98 | 426±101 | 428±92 | 407±93 | <.0001 |
| hs-C-reactive protein (mg/L) | 3.6±6.8 | 3.6±6.9 | 3.5±5.6 | 3.3±5.8 | .66 |
| Lp-PLA2 (ng/mL) | 135±44 | 134±44 | 134±43 | 135±45 | .606 |
| Myeloperoxidase (pmol/L) | 466±166 | 461±165 | 472±168 | 474±165 | .064 |
|
| |||||
| METABOLIC | |||||
| Homocysteine (umol/L) | 12.4±5.1 | 12.7±5.6 | 11.6±4.1 | 12.1±4.4 | <.0001 |
| Folate | 12.5±4.8 | 12.3±4.7 | 13.3±5.3 | 12.8±4.7 | .032 |
| TSH (uIU/mL) | 2.4±4.2 | 2.4±5.2 | 2.1±1.8 | 2.3±1.6 | .16 |
| Vitamin D (ng/mL) | 33.9±14.4 | 33.8±14.4 | 34.9±14.6 | 31.8±13.8 | <.0001 |
Relationship of ALT with lipid, inflammatory, and metabolic risk factors
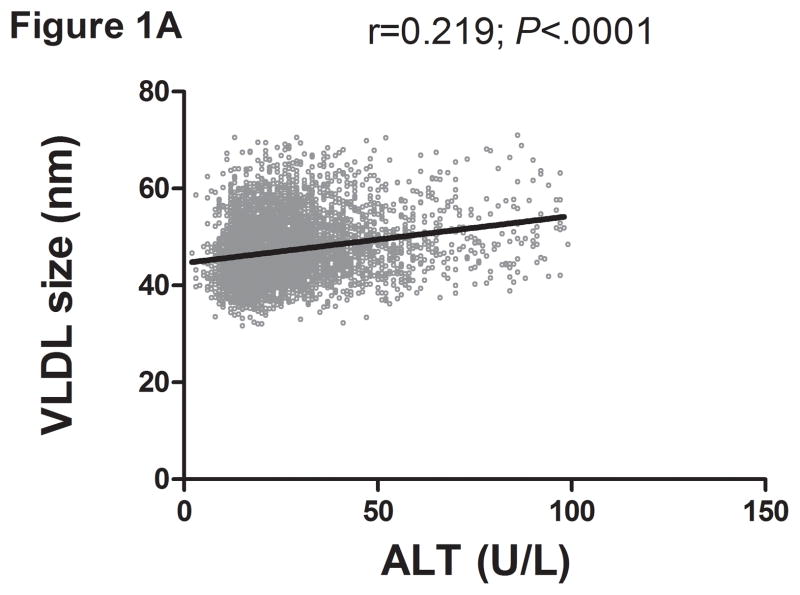
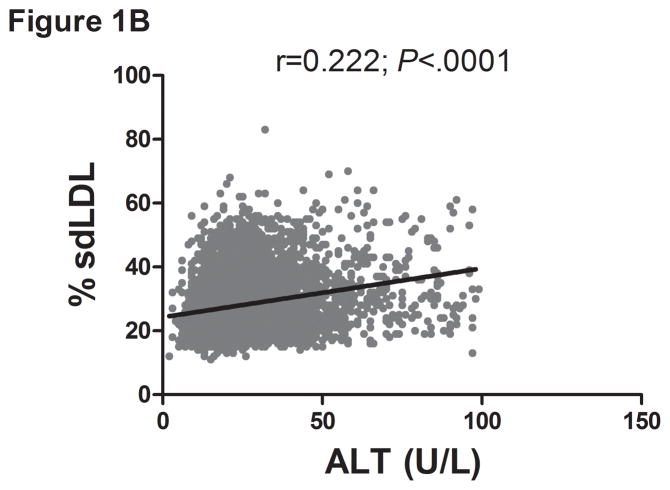
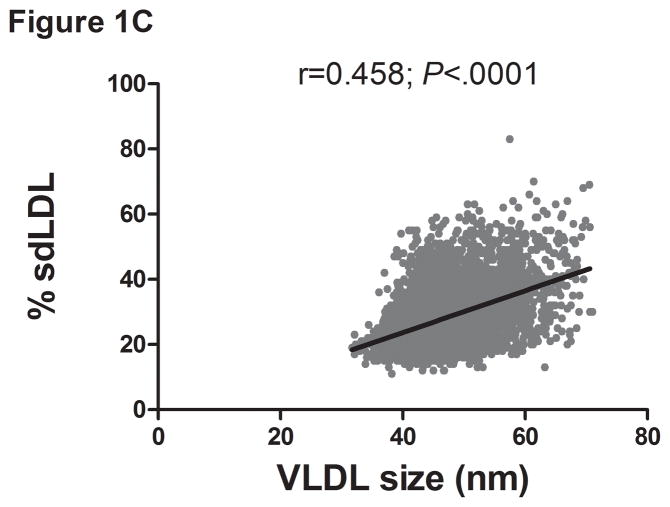
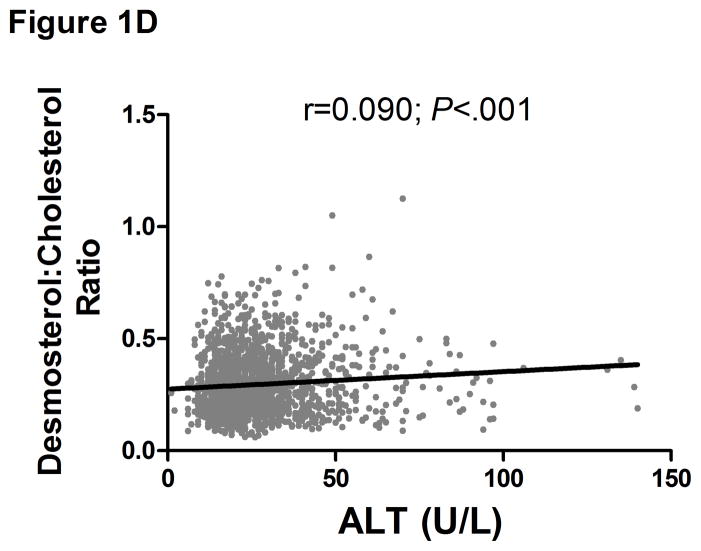
There was a direct linear relationship between ALT and VLDL size and % sdLDL (Fig. 1a–b). VLDL size was directly related to % sdLDL (Fig. 1c). The desmosterol:cholesterol ratio, a marker of hepatic cholesterol synthetic activity (18), was also directly related to ALT levels (Fig. 1d). For each BMI category (lean, overweight, and obese), LDL-P and % sdLDL-C was higher in those with an ALT greater than low normal values (Figure 1d–e).
Figure 1.
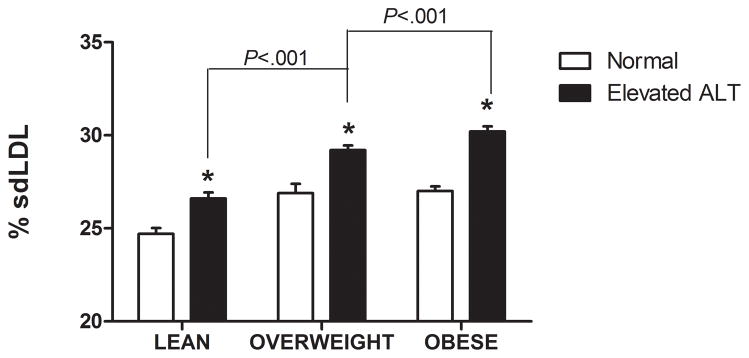
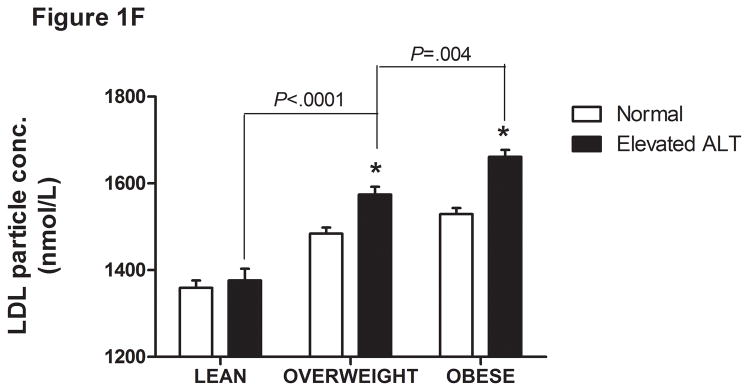
Serum ALT levels are directly related to very low density lipoprotein (VLDL) size (Figure 1A), % small dense LDL cholesterol (sdLDL-C) (Figure 1B), and desmosterol:cholesterol ratio (Figure 1D) in an apparently healthy population. Percent sdLDL-C is directly related to VLDL size (Figure 1C). Percent sdLDL-C and LDL-particle concentrations (LDL-P) increase from lean to overweight to obese cohorts (P <.001) (Figure 1D & 1E). Although % sdLDL-C and LDL-P were similar between overweight and obese individuals with normal ALT, they increased dramatically in those with elevated ALT (P <.01). (*P <.05 between normal and elevated ALT). All data represented as means ± S.E.M. Elevated ALT is defined as > 19 U/L in women and >31 U/L in women.
Thirty eight percent (n=2463) of the total cohort had a high-normal or elevated ALT level. Of these, 1703 (25% of total cohort) had high-normal ALT while 760 subjects (12% of the total population) had an ALT between 40–100 IU/L. Those with high-normal ALT or elevated ALT had a higher triglyceride, VLDL-P, ApoB:ApoA ratio, LDL-C, % sdLDL, sdLDL-C and sdLDL-P (P<.001 for all) compared to those with low normal ALT (Table 1). BMI, serum insulin concentrations, glucose and HbA1C were all also higher in those with high normal or elevated ALT. HDL and HDL2 were lower in those with elevated ALT compared to those with low normal or high normal ALT. Of note, fibrinogen levels were also lower in those with elevated ALT compared to the other groups.
1. Independent contribution of ALT to variability in lipids and lipoproteins
To further determine the impact of age, BMI, HBA1C, TSH, Vitamin D, homocysteine, and fasting insulin as potential confounding variables that could be responsible for the observed relationship between ALT and various lipids/lipoproteins, univariate analysis was first performed to assess their relationship with the endpoints of interest (Table 2). Hyperinsulinemia was particularly associated with triglycerides, VLDL size, VLDL-P, and % sdLDL-C. The HbAIC and homocysteine levels were directly related, while vitamin D levels were inversely related, to % sdLDL-C. Stepwise multivariable regression analyses demonstrated that ALT affected LDL-P, sdLDL-C, % sdLDL-C, VLDL size, VLDL-P, and triglycerides independent of BMI and insulin resistance (Table 3). Age, fasting insulin, and ALT levels also independently contributed to the levels of LDL-P, sdLDL-C, VLDL size, VLDL-P, and triglyceride levels (Table 3). In order to further evaluate the impact of age on the atherogenic profile the entire cohort was divided into 3 age groups; age group 1 (ages 18–39), age group 2 (ages 40–59), and age group 3 (ages 60+). The atherogenic risk profile was more favorable in age group 3 compared to both age groups 1 and 2 (Supplemental Table 1) further confirming that age alone did not drive the differences in cardiovascular risk parameters in those with low normal versus higher levels of ALT.
Table 2.
Correlation coefficient between known risk factors for cardiovascular disease and serum atherogenic profile in a healthy population.
| T-Chol | HDL-C | LDL-C | TG | HDL2-C | LDL-P | %sdLDL-C | sdLDL- C | Lp-PLA2 | VLDL-P | VLDL size | |
|---|---|---|---|---|---|---|---|---|---|---|---|
| Age | −0.14* | 0.04** | −0.19* | −0.07* | 0.08* | −0.12* | −0.01 | −0.14* | 0.01 | −0.11* | −0.07* |
| ALT | 0.03*** | −0.11* | 0.04*** | 0.14* | −0.09* | 0.11* | 0.19* | 0.17* | 0.02 | 0.17* | 0.21* |
| BMI | −0.05* | −0.28* | 0.01 | 0.13* | −0.19* | 0.13* | 0.08* | 0.06* | −0.11* | 0.14* | 0.26* |
| Hb A1c | 0 | −0.20* | −0.03 | 0.22* | −0.08* | 0.12* | 0.21* | 0.12* | −0.17* | 0.17* | 0.17* |
| HCY | −0.07* | −0.08* | −0.08* | 0.03*** | −0.04** | −0.05** | 0.22 | −0.03*** | 0.06* | 0.02 | 0.05** |
| Insulin | −0.04** | −0.21* | −0.03*** | 0.20* | −0.12* | 0.08* | 0.16* | 0.10* | −0.07* | 0.21* | 0.29* |
| TSH | 0.06* | −0.02 | 0.05*** | 0.06* | 0.03 | 0.07* | 0.05*** | 0.07* | −0.03 | 0.08* | 0 |
| Vit D | −0.18* | 0.11* | −0.17* | −0.19* | 0.06* | −0.23* | −0.12* | −0.20* | 0.05* | −0.17* | −0.12* |
P<.0001,
P <.001,
P <.01.
All data presented as mean ± S.D.
HCY (homocysteine), ALT (alanine aminotransferase), Hb A1c (hemoglobin A1c), TSH (thyroid stimulating hormone), T-Chol (total cholesterol), HDL-C (high-density lipoprotein cholesterol), LDL-C (low density lipoprotein cholesterol), TG (triglyceride), HDL2-C (HDL subclass 2 cholesterol), LDL-P (LDL-particle concentration), % sdLDL-C (percent small dense LDL cholesterol), sdLDL-C (sdLDL-cholesterol), Lp-PLA2 (lipoprotein associated phospholipase A2), VLDL-P (very low density lipoprotein particle concentration).
Table 3.
Multiple linear regression analysis of known risk factor of cardiovascular disease with serum markers of atherogenic risk.
| Independent Variable | HDL2-C β ± SE |
LDL-P β ± SE |
%sdLDL-C β ± SE |
sdLDL-C β ± SE |
VLDL-P β ± SE |
VLDL size β ± SE |
|---|---|---|---|---|---|---|
| INTERCEPT | 16.853±1.005* | 1427.8±89.1* | 14.48±1.72* | 26.86±2.09* | −3.58±1.16** | 36.39±1.03* |
| ALT | 0.0012±0.0061 | 1.56±0.54** | 0.042±0.01* | 0.052±0.012* | 0.0185±0.007** | 0.029±0.006* |
| INSULIN | −0.023±0.008** | 1.63±0.57* | 0.069±0.011* | 0.062±0.014* | 0.0752±0.007* | 0.08±0.006* |
| MALE | −1.647±0.118* | 14.9±10.3 | 1.45±0.20* | 0.54±0.25** | 0.626±0.135* | 0.2±0.12 |
| Age | 0.024±0.009** | −4.17±0.74* | −0.011±0.01 | −0.128±0.02* | −0.07±0.009* | −0.029±0.006* |
| BMI | −0.152±0.021* | 4.40±1.87** | −0.041±0.04 | −0.085±0.044 | 0.0057±0.0243 | 0.165±0.022* |
| FFA | −0.098±0.429 | 287.4±36.6* | 9.09±0.71* | 10.0±0.86* | 8.10±0.48* | 3.44±0.44* |
| HB A1C | −0.233±0.11** | 35.55±9.69* | 1.53±0.19* | 0.98±0.23* | 0.928±0.126* | 0.549±0.11* |
| HCY | 0.028±0.027 | −7.59±2.12* | −0.074±0.046 | −0.10±0.056 | −0.011±0.028* | 0.045±0.024 |
| HS-CRP | −0.0014±0.018 | 4.81±1.58** | −0.036±0.03 | 0.013±0.037 | −0.007±0.021 | −0.035±0.018 |
| TSH | 0.0434±0.024 | 9.27±2.11* | 0.12±0.041** | 0.204±0.05* | 0.135±0.028* | −0.008±0.024 |
| VITAMIN D | 0.0029±0.008 | −6.39±0.69* | −0.05±0.01** | −0.13±0.016* | −0.04±0.009* | −0.01±0.008 |
All data presented as mean ± S.D.
P <.001,
P <.01
2. Interactions between ALT, insulin resistance, and liver fat as drivers of lipoprotein profile
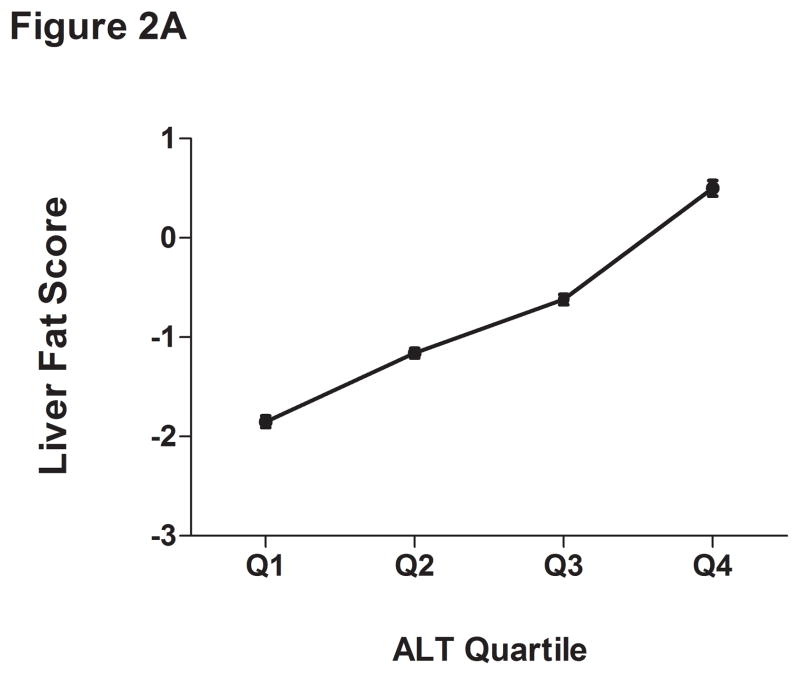
The liver fat scores increased progressively from the lowest to the highest ALT quartile (Supplemental Table 2 and Figure 2A). Also, the proportion of subjects with values over −0.64 increased progressively from the lowest (15%) to highest quartile (58%). As expected, the mean liver fat score was lowest in those with low normal ALT (P <.001). Thirty-one percent of subjects with normal insulin concentrations had an elevated ALT compared to 47% of the hyperinsulinemic population (P <.0001) (Table 4). Also, 86% of those with elevated ALT and hyperinsulinemia had liver fat scores above the cutoffs for hepatic steatosis.
Figure 2.
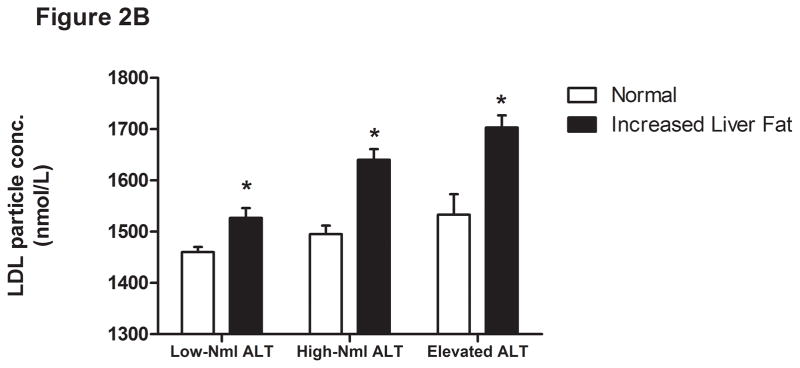
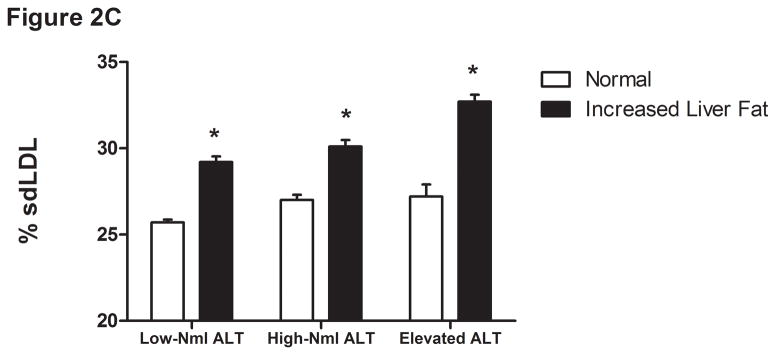
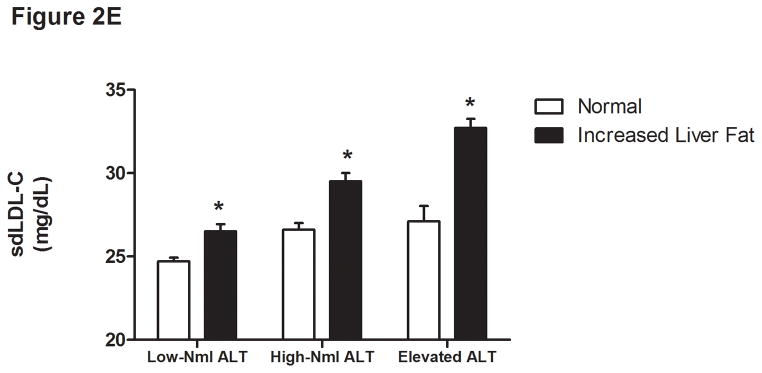
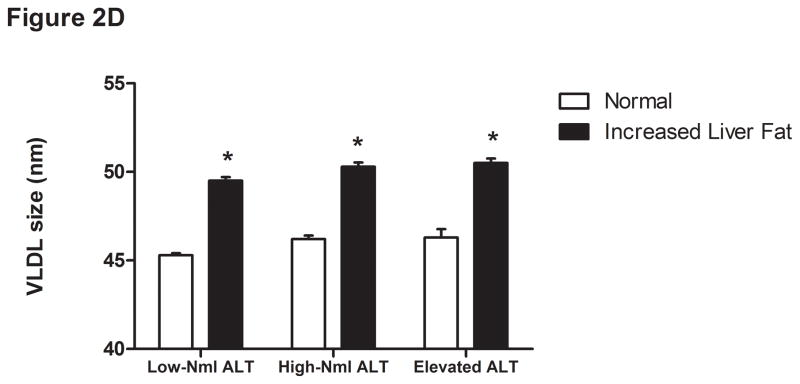
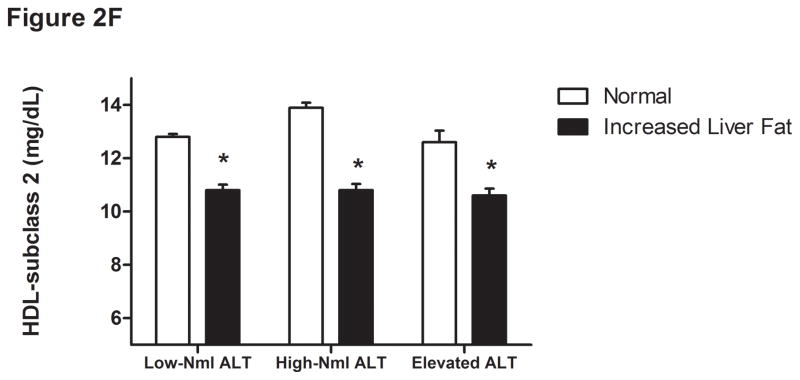
Liver fat score progressively increase from lowest ALT quartile (Q1) to the highest ALT quartile (Q4) (Figure 1A). LDL particle concentration (Figure 2B), % small dense LDL cholesterol (Figure 2C), VLDL size (Figure 2D), and small density LDL-cholesterol (Figure 2E) are increased in individuals with elevated liver fat across the three ALT groups. HDL-subclass 2 cholesterol (Figure 2F) is lower in individuals with increased liver fat scores. Low-normal (Low-Nml) ALT defined as ALT < 19 U/L in women and < 31 U/L in men, elevated ALT is defined as ALT > 40 U/L and high-normal (High-Nml) is any ALT values between these two groups. All data represented as means ± S.E.M. (*P <.001 between normal and increased liver fat)
Table 4.
Impact of the elevated ALT and hyperinsulinemia on expanded cardiovascular risk profile. Elevated ALT (>19 U/L in women and >31 U/L in men) is associated with a worse serum cardiovascular risk profile in both normal and individuals with hyperinsulinemia (*P <.05 between normal vs elevated ALT; ** P <.05 between elevated insulin and elevated insulin and elevated ALT levels; ‡P <.05 between elevated ALT and elevated insulin with normal ALT levels.) All data presented as mean ± S.D.
| NORMAL INSULIN LEVELS | ELEVATED INSULIN LEVLES | |||
|---|---|---|---|---|
|
| ||||
| Normal ALT Mean ± S.D. |
Elevated ALT Mean ± S.D. |
Normal ALT Mean ± S.D. |
Elevated ALT Mean ± S.D. |
|
|
| ||||
| DEMOGRAPHICS | ||||
| Age (years) | 59±14 | 57±13* | 60±14‡ | 55±12** |
| BMI (kg/m2) | 28±5 | 28±5 | 32±6‡ | 33±6** |
| Gender (%male) | 55 | 39* | 63‡ | 45** |
| ALT (U/L) | 18±6 | 35±14* | 19±6‡ | 39±16** |
|
| ||||
| INSULIN RESISTANCE | ||||
| Free Fatty Acids (mmol/L) | 0.65±0.25 | 0.68±0.26* | 0.61±0.28‡ | 0.70±0.28** |
| Insulin (uU/mL) | 6.9±2.4 | 7.3±2.4 | 23±18.6‡ | 26.1±26.8** |
|
| ||||
| TRADITIONAL FACTORS | ||||
| HDL-C (mg/dL) | 54±14 | 57±15* | 47±11‡ | 47±11 |
| LDL-C (mg/dL) | 97±32 | 97±33 | 91±31‡ | 99±35** |
| Triglycerides (mg/dL) | 111±63 | 127±173* | 151±124‡ | 177±144** |
| Total Cholesterol (mg/dL) | 182±42 | 187±45* | 171±41‡ | 184±48** |
|
| ||||
| VLDL | ||||
| Apolipoprotein-B (mg/dL) | 86±24 | 88±26 | 85±24‡ | 94±28** |
| VLDL-P (nmol/L) | 2±2.9 | 3±6.2* | 4.3±7.6‡ | 6.1±10.1** |
| VLDL size (nm) | 44.8±5.2 | 46.3±6* | 48.5±5.9‡ | 50.1±6.4** |
|
| ||||
| LDL | ||||
| LDL-P (nmol/L) | 1447±522 | 1477±560 | 1518±525 | 1676±590** |
| Small-dense LDL-C (mg/dL) | 24.6±11.3 | 26.5±13.6* | 25.7±11.8 | 30.8±14.9** |
| % Small-dense LDL-C | 25.3±7.3 | 27.2±13.4* | 28.2±8.9‡ | 31±10** |
| Small dense LDL-P (nmol/L) | 695±431 | 711±482 | 852±442‡ | 972±508** |
|
| ||||
| HDL | ||||
| Apolipoprotein-A1 (mg/dL) | 152±30 | 159±32* | 140±26‡ | 142±27** |
| HDL-2 (mg/dL) | 13±6.1 | 13.7±6.8* | 10.9±5.1‡ | 10.9±5.2 |
|
| ||||
| MISCELLANEOUS | ||||
| ApoB:Apo-A1 ratio | 0.59±0.24 | 0.58±0.21 | 0.63±0.21‡ | 0.68±0.26** |
| Liver Fat Score | −2.187±0.65 | −1.449±0.608* | 0.328±2.838‡ | 1.4±3.57** |
|
| ||||
| INFLAMMATORY | ||||
| Fibrinogen (mg/dL) | 414±97 | 410±91 | 446±102‡ | 430±94** |
| hs-C-Reactive Protein (mg/L) | 2.9±6.5 | 2.8±5.8 | 4.6±7.2‡ | 4.2±7.4 |
| Myeloperoxidase (pmol/L) | 448±160 | 460±162 | 481±170 | 484±167 |
|
| ||||
| METABOLIC | ||||
| Homocysteine (umol/L) | 12.5±5.1 | 11.6±4.1* | 13.1±6.2‡ | 11.9±4.3** |
For the group as a whole, those with a liver fat score greater than −0.64 had higher insulin levels, VLDL size, LDL-P, sdLDL-C, and % sdLDL-C, and lower levels of HDL2-C (P <.0001 for all) (Figure 2B-F). In the “higher risk” groups i.e. high normal or elevated ALT and hyperinsulinemia, elevated liver fat score was however associated with higher levels of serum triglycerides, VLDL-size and VLDL-P only. The liver fat score was also directly related to the desmosterol: total cholesterol ratio, a marker of cholesterol synthetic activity which is increased in NAFLD (18).
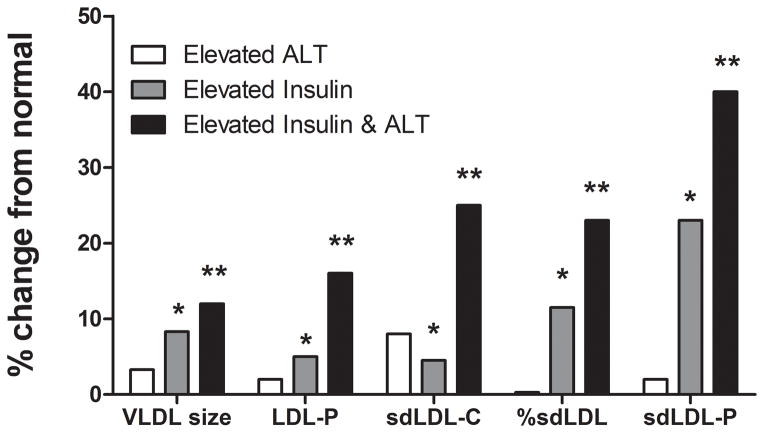
Compared to individuals with normal insulin and low-normal ALT levels, both higher ALT (high normal and elevated ALT) and hyperinsulinemia were separately associated with increased LDL-P, sdLDL-C, % sdLDL-C, triglycerides, and VLDL size (Table 4 and Fig. 3). However, when both hyperinsulinemia and ALT above low-normal values were present, there was a synergistic worsening of these laboratory parameters. In hyperinsulinemic subjects, ALT levels did not significantly affect HDL-related parameters. These relationships held true when lean, overweight, and obese subjects were analyzed separately.
Figure 3.
Presence of elevated ALT was associated with worsening expanded cardiovascular profile in both individuals with normal or elevated serum insulin concentrations. There was a synergistic increase seen in serum LDL particle concentrations (LDL-P), small dense LDL cholesterol (sdLDL-C), % small dense LDL-C, and small dense LDL-particle concentrations (sdLDL-P) in individuals with both elevated insulin and elevated ALT concentrations. The increase in VLDL size was additive in individuals with elevated ALT and insulin concentrations. (*P <.001 elevated ALT vs elevated insulin; ** P <.001 elevated insulin vs. elevated insulin and elevated ALT). Elevated ALT is defined as > 19 U/L in women and >31 U/L in women.
DISCUSSION
There is a growing appreciation that chronic liver disease affects cardiovascular outcomes. Based on conventional thresholds (> 40–50 IU/L), prior studies have demonstrated an association between elevated ALT (15, 25–27) and several lipids associated with cardiovascular risk, but did not account for many concomitant factors that could also affect these endpoints. Also, these studies did not specifically evaluate the impact of high-normal ALT (> 19 IU/l for women and 31 IU/l for men but < 40 IU/l for both) on cardiovascular risk factors. Furthermore, they did not clarify the interactions between ALT levels and such factors in predicting levels of lipids and lipoproteins known to affect cardiovascular risk. The current study fills these gaps and demonstrates that ALT levels are independently associated with numerous lipoprotein abnormalities and synergize with hyperinsulinemia to adversely impact laboratory biomarkers of cardiovascular risk.
Two key findings of this study are (1) the high prevalence of ALT levels above 19 IU/L for women and 31 IU/L for men but within the upper limits of normal (~ 40 IU/L) and (2) their association with worsening of multiple laboratory parameters reflective of cardiovascular risk. sdLDL-C was higher in those with ALT above low normal values. Specifically sdLDL-C > 30%, a threshold value for increased cardiovascular risk (28), was present in 26% of those with low normal ALT versus 36% in high normal ALT versus 45% in the elevated ALT group. Together with the existing literature on the impact of such ALT levels on liver-related mortality (5), these data indicate that current cutoffs for the upper limit of normal for ALT are suboptimal and support their revision downwards.
The metabolic syndrome is classically associated with decreased HDL-C and increased triglycerides (29). The current study demonstrates that when combined with elevated ALT, the dyslipidemic profile is extended to include increased LDL-P, sdLDL-C, % sdLDL-C, and sdLDL-P, further worsening the cardiovascular risk profile. The principal clinical implication of this study therefore is that mild ALT elevations and even high-normal ALT in asymptomatic subjects may be a marker for higher cardiovascular risk, a concept now requiring prospective validation in longitudinal studies. Also, this increase cannot be gauged by the LDL-C alone (Table 1). It is already established that increasing sdLDL and LDL-P are associated with poorer cardiovascular outcomes (28, 30).
Much of the literature on the utility of expanded analysis of cardiovascular risk factors has focused on those with known heart disease, type 2 diabetes, or other high-risk clinical profiles (7, 8, 14). Many cardiovascular deaths, however, continue to occur in otherwise asymptomatic subjects (6, 31). The specific subpopulations most likely to be at high risk and who could potentially benefit from intervention remain to be defined. The current study, focusing on asymptomatic subjects in the general population, showed that even a high-normal ALT and mild ALT elevations are associated with worsening of this profile, and may serve to identify those more likely to have a high-risk expanded profile, and potentially benefit from such testing. The value of such a strategy now awaits prospective validation.
An important question is: what is the mechanism by which ALT elevation translates into increased sdLDL-C, % sdLDL-C, and sdLDL-P, and what is the basis for the synergistic worsening of these parameters when hyperinsulinemia and ALT elevation are present? It is known that incomplete peripheral lipolysis of large VLDL particles over-enriched with triglycerides leads to more sdLDL particles, which carry a disproportionately larger amount of LDL-C (32–34). In this study, ALT levels were directly related to VLDL-P and size, which were in turn related to sdLDL-C, % sdLDL-C and, sdLDL-P. ALT levels were also directly related to the desmosterol: total cholesterol ratio, a marker of cholesterol synthetic activity (18). This suggests that ALT elevations are associated with increased hepatic triglyceride and cholesterol output in VLDL particles, which drive the changes in sdLDL.
The principal limitation of this study is that the specific etiology of elevated ALT was not available. However, the data do clearly demonstrate that even in the absence of such information, there is a clear and robust relationship between ALT and laboratory markers of cardiovascular risk. Hepatic fat content is also directly related to ALT values (24). The direct relationship between liver fat scores and ALT in this study is compatible with the possibility that many subjects with high normal or elevated ALT had underlying NAFLD. NAFLD is known to be associated with increased de novo lipogenesis, triglyceride output, and cholesterol synthesis (18, 35). HMG-CoA reductase expression is also linked to LDL-C in subjects with NAFLD (18, 36). Insulin resistance is commonly associated with NAFLD and hyperinsulinemia which drives de novo lipogenesis (37, 38). The observed relationships between ALT and liver fat scores on the one hand, and high VLDL-P on the other, support the possibility that the synergistic effects of ALT and hyperinsulinemia on sdLDL reflect underlying NAFLD.
Most of the subjects were also middle aged and most were obese or overweight potentially limiting the generalizability of the data. It is however unlikely that this BMI distribution substantially biased the conclusions of this study because the data were consistent across lean, overweight, and obese subjects.
It is also interesting to note the consistent inverse relationship between ALT and several markers of systemic inflammation. These findings are somewhat counter-intuitive given that age, BMI, and insulin resistance all increased with increasing ALT. If hepatic fat accumulation and lipid metabolic changes precede activation of innate immune pathways and vascular inflammation, it could potentially explain these findings in this asymptomatic population without diabetes, hypertension, or other major co-morbidities who are likely to be in an earlier stage of the insulin resistance syndrome. This however requires prospective validation.
In summary, we demonstrate a high prevalence of modestly elevated ALT and hyperinsulinemia (> 12 mIU/ml) in an asymptomatic population drawn from an ambulatory community health care setting. These tests have a synergistic adverse effect on several advanced laboratory biomarkers reflective of cardiovascular risk. The mechanisms of such synergy and their long-term consequences await direct evaluation. However, these data further support the lowering of the ULN of ALT to < 19 IU/L for women and < 31 IU/L for men.
Supplementary Material
Acknowledgments
Funding Support: The work is supported in part by a grant from the National Institutes of Health to Dr. Sanyal DK RO1DK081410
Footnotes
AUTHOR CONTRIBUTIONS:
Raw Data Provided by: G. Russell Warnick and Shahrzad Grami
Project Conceptualization: M. Shadab Siddiqui, Richard K. Sterling, Velimir A Luketic, Puneet Puri, Richard T. Stravitz, Illiana Bouneva, Sherry Boyett, Michael Fuchs, Carol Sargeant, and Arun Sanyal
Data Analysis: M. Shadab Siddiqui and Arun Sanyal
Manuscript Preparation: M. Shadab Siddiqui and Arun Sanyal
Manuscript Review: Richard K. Sterling, Velimir Luketic, Puneet Puri, Richard T. Stravitz, Illiana Bouneva, Sherry Boyett, Michael Fuchs, Carol Sargeant.
Financial Disclosure: None of the authors have any conflict of interest to report except: Puneet Puri (Board Membership Health Diagnostic Laboratories, Inc); G. Russell Warnick and Shahrzad Grami (Employed by Health Diagnostics Laboratories, Inc)
Publisher's Disclaimer: This is a PDF file of an unedited manuscript that has been accepted for publication. As a service to our customers we are providing this early version of the manuscript. The manuscript will undergo copyediting, typesetting, and review of the resulting proof before it is published in its final citable form. Please note that during the production process errors may be discovered which could affect the content, and all legal disclaimers that apply to the journal pertain.
References
- 1.Clark JM, Brancati FL, Diehl AM. The prevalence and etiology of elevated aminotransferase levels in the United States. Am J Gastroenterol. 2003;98(5):960–967. doi: 10.1111/j.1572-0241.2003.07486.x. [DOI] [PubMed] [Google Scholar]
- 2.Browning JD, Szczepaniak LS, Dobbins R, Nuremberg P, Horton JD, Cohen JC, Grundy SM, et al. Prevalence of hepatic steatosis in an urban population in the united states: Impact of ethnicity. Hepatology. 2004;40(6):1387–1395. doi: 10.1002/hep.20466. [DOI] [PubMed] [Google Scholar]
- 3.Williams CD, Stengel J, Asike MI, Torres DM, Shaw J, Contreras M, Landt CL, et al. Prevalence of nonalcoholic fatty liver disease and nonalcoholic steatohepatitis among a largely middle-aged population utilizing ultrasound and liver biopsy: A prospective study. Gastroenterology. 2010;140:124–131. doi: 10.1053/j.gastro.2010.09.038. [DOI] [PubMed] [Google Scholar]
- 4.Vernon G, Baranova A, Younossi ZM. Systematic review: The epidemiology and natural history of non-alcoholic fatty liver disease and non-alcoholic steatohepatitis in adults. Aliment Pharmacol Ther. 2011;34(3):274–285. doi: 10.1111/j.1365-2036.2011.04724.x. [DOI] [PubMed] [Google Scholar]
- 5.Prati D, Taioli E, Zanella A, Della Torre E, Butelli S, Del Vecchio E, Vianello L, et al. Updated definitions of healthy ranges for serum alanine aminotransferase levels. Ann Intern Med. 2002;137(1):1–10. doi: 10.7326/0003-4819-137-1-200207020-00006. [DOI] [PubMed] [Google Scholar]
- 6.Roger VL, Go AS, Lloyd-Jones DM, Adams RJ, Berry JD, Brown TM, Carnethon MR, et al. Heart disease and stroke statistics--2011 update: A report from the american heart association. Circulation. 2010;123:e18–e209. doi: 10.1161/CIR.0b013e3182009701. [DOI] [PMC free article] [PubMed] [Google Scholar]
- 7.Rosenson RS, Otvos JD, Freedman DS. Relations of lipoprotein subclass levels and low-density lipoprotein size to progression of coronary artery disease in the pravastatin limitation of atherosclerosis in the coronary arteries (PLAC-I) trial. Am J Cardiol. 2002;90(2):89–94. doi: 10.1016/s0002-9149(02)02427-x. [DOI] [PubMed] [Google Scholar]
- 8.Lamarche B, Tchernof A, Moorjani S, Cantin B, Dagenais GR, Lupien PJ, Despres JP. Small, dense low-density lipoprotein particles as a predictor of the risk of ischemic heart disease in men prospective results from the quebec cardiovascular study. Circulation. 1997;95(1):69–75. doi: 10.1161/01.cir.95.1.69. [DOI] [PubMed] [Google Scholar]
- 9.Herder C, Karakas M, Koenig W. Biomarkers for the prediction of type 2 diabetes and cardiovascular disease. Clinical Pharmacology & Therapeutics. 2011;90(1):52–66. doi: 10.1038/clpt.2011.93. [DOI] [PubMed] [Google Scholar]
- 10.Cromwell WC, Otvos JD, Keyes MJ, Pencina MJ, Sullivan L, Vasan RS, Wilson PWF, et al. LDL particle number and risk of future cardiovascular disease in the framingham offspring Study—Implications for LDL management. Journal of Clinical Lipidology. 2007;1(6):583–592. doi: 10.1016/j.jacl.2007.10.001. [DOI] [PMC free article] [PubMed] [Google Scholar]
- 11.Ridker PM, Hennekens CH, Buring JE, Rifai N. C-reactive protein and other markers of inflammation in the prediction of cardiovascular disease in women. N Engl J Med. 2000;342(12):836–843. doi: 10.1056/NEJM200003233421202. [DOI] [PubMed] [Google Scholar]
- 12.Williams PT, Feldman DE. Prospective study of coronary heart disease vs. HDL2, HDL3, and other lipoproteins in gofman’s livermore cohort. Atherosclerosis. 2010;214:196–202. doi: 10.1016/j.atherosclerosis.2010.10.024. [DOI] [PMC free article] [PubMed] [Google Scholar]
- 13.Mora S, Szklo M, Otvos JD, Greenland P, Psaty BM, Goff DC, Jr, O’Leary DH, et al. LDL particle subclasses, LDL particle size, and carotid atherosclerosis in the multi-ethnic study of atherosclerosis (MESA) Atherosclerosis. 2007;192(1):211–217. doi: 10.1016/j.atherosclerosis.2006.05.007. [DOI] [PubMed] [Google Scholar]
- 14.Otvos JD, Collins D, Freedman DS, Shalaurova I, Schaefer EJ, McNamara JR, Bloomfield HE, et al. Low-density lipoprotein and high-density lipoprotein particle subclasses predict coronary events and are favorably changed by gemfibrozil therapy in the veterans affairs high-density lipoprotein intervention trial. Circulation. 2006;113(12):1556–1563. doi: 10.1161/CIRCULATIONAHA.105.565135. [DOI] [PubMed] [Google Scholar]
- 15.Lorenzo C, Hanley AJ, Rewers MJ, Haffner SM. The association of alanine aminotransferase within the normal and mildly elevated range with lipoproteins and apolipoproteins: The insulin resistance atherosclerosis study. Diabetologia. 2013;56(4):746–57. doi: 10.1007/s00125-012-2826-4. [DOI] [PMC free article] [PubMed] [Google Scholar]
- 16.Assmann G, Schulte H, von Eckardstein A, Huang Y. High-density lipoprotein cholesterol as a predictor of coronary heart disease risk the PROCAM experience and pathophysiological implications for reverse cholesterol transport. Atherosclerosis. 1996;124 (Suppl):S11–20. doi: 10.1016/0021-9150(96)05852-2. [DOI] [PubMed] [Google Scholar]
- 17.Sharrett AR, Ballantyne CM, Coady SA, Heiss G, Sorlie PD, Catellier D, Patsch W, et al. Coronary heart disease prediction from lipoprotein cholesterol levels, triglycerides, lipoprotein(a), apolipoproteins A-I and B, and HDL density subfractions: The atherosclerosis risk in communities (ARIC) study. Circulation. 2001;104(10):1108–1113. doi: 10.1161/hc3501.095214. [DOI] [PubMed] [Google Scholar]
- 18.Simonen P, Kotronen A, Hallikainen M, Sevastianova K, Makkonen J, Hakkarainen A, Lundbom N, et al. Cholesterol synthesis is increased and absorption decreased in non-alcoholic fatty liver disease independent of obesity. J Hepatol. 2010;54(1):153–9. doi: 10.1016/j.jhep.2010.05.037. [DOI] [PubMed] [Google Scholar]
- 19.Despres JP, Lamarche B, Mauriege P, Cantin B, Dagenais GR, Moorjani S, Lupien PJ. Hyperinsulinemia as an independent risk factor for ischemic heart disease. N Engl J Med. 1996;334(15):952–957. doi: 10.1056/NEJM199604113341504. [DOI] [PubMed] [Google Scholar]
- 20.Matthews DR, Hosker JP, Rudenski AS, Naylor BA, Treacher DF, Turner RC. Homeostasis model assessment: Insulin resistance and beta-cell function from fasting plasma glucose and insulin concentrations in man. Diabetologia. 1985;28(7):412–419. doi: 10.1007/BF00280883. [DOI] [PubMed] [Google Scholar]
- 21.Ryu SK, Mallat Z, Benessiano J, Tedgui A, Olsson AG, Bao W, Schwartz GG, et al. Phospholipase A2 enzymes, high-dose atorvastatin, and prediction of ischemic events after acute coronary syndromes [coronary heart disease] Circulation. 2012;125(6):757–766. doi: 10.1161/CIRCULATIONAHA.111.063487. [DOI] [PubMed] [Google Scholar]
- 22.Wang TJ, Gona P, Larson MG, Tofler GH, Levy D, Newton-Cheh C, Jacques PF, et al. Multiple biomarkers for the prediction of first major cardiovascular events and death. N Engl J Med. 2006;355(25):2631–2639. doi: 10.1056/NEJMoa055373. [DOI] [PubMed] [Google Scholar]
- 23.Hsieh M, Chen C, Lee T, Lee C, Wen M, Lin F, Hsieh I, et al. Metabolic syndrome and homocysteine level as predictors of the severity of coronary artery disease in patients with carotid stenosis. Am J Med Sci. 2009;338(6):447–452. doi: 10.1097/MAJ.0b013e3181ab1c96. [DOI] [PubMed] [Google Scholar]
- 24.Kotronen A, Peltonen M, Hakkarainen A, Sevastianova K, Bergholm R, Johansson LM, Lundbom N, et al. Prediction of non-alcoholic fatty liver disease and liver fat using metabolic and genetic factors. Gastroenterology. 2009;137(3):865–872. doi: 10.1053/j.gastro.2009.06.005. [DOI] [PubMed] [Google Scholar]
- 25.Dunn W, Xu R, Wingard DL, Rogers C, Angulo P, Younossi ZM, Schwimmer JB. Suspected nonalcoholic fatty liver disease and mortality risk in a population-based cohort study. Am J Gastroenterol. 2008;103(9):2263–2271. doi: 10.1111/j.1572-0241.2008.02034.x. [DOI] [PMC free article] [PubMed] [Google Scholar]
- 26.Yun KE, Shin CY, Yoon YS, Park HS. Elevated alanine aminotransferase levels predict mortality from cardiovascular disease and diabetes in koreans. Atherosclerosis. 2009;205(2):533–537. doi: 10.1016/j.atherosclerosis.2008.12.012. [DOI] [PubMed] [Google Scholar]
- 27.Goessling W, Massaro JM, Vasan RS, D’Agostino RB, Ellison RC, Fox CS. Aminotransferase levels and 20-year risk of metabolic syndrome, diabetes, and cardiovascular disease. Gastroenterology. 2008;135(6):1935–1944. e1. doi: 10.1053/j.gastro.2008.09.018. [DOI] [PMC free article] [PubMed] [Google Scholar]
- 28.Koba S, Hirano T, Ito Y, Tsunoda F, Yokota Y, Ban Y, Iso Y, et al. Significance of small dense low-density lipoprotein-cholesterol concentrations in relation to the severity of coronary heart diseases. Atherosclerosis. 2006;189(1):206–214. doi: 10.1016/j.atherosclerosis.2005.12.002. [DOI] [PubMed] [Google Scholar]
- 29.Grundy SM, Cleeman JI, Daniels SR, Donato KA, Eckel RH, Franklin BA, Gordon DJ, et al. Diagnosis and management of the metabolic syndrome: An american heart association/national heart, lung, and blood institute scientific statement: Executive summary. Crit Pathw Cardiol. 2005;4(4):198–203. doi: 10.1097/00132577-200512000-00018. [DOI] [PubMed] [Google Scholar]
- 30.Ai M, Otokozawa S, Asztalos BF, Ito Y, Nakajima K, White CC, Cupples LA, et al. Small dense LDL cholesterol and coronary heart disease: Results from the framingham offspring study [lipids, lipoproteins, and cardiovascular risk factors] Clin Chem. 2010;56(6):967–76. doi: 10.1373/clinchem.2009.137489. [DOI] [PMC free article] [PubMed] [Google Scholar]
- 31.Akosah KO, Schaper A, Cogbill C, Schoenfeld P. Preventing myocardial infarction in the young adult in the first place: How do the national cholesterol education panel III guidelines perform? J Am Coll Cardiol. 2003;41(9):1475–1479. doi: 10.1016/s0735-1097(03)00187-6. [DOI] [PubMed] [Google Scholar]
- 32.Tobey TA, Greenfield M, Kraemer F, Reaven GM. Relationship between insulin resistance, insulin secretion, very low density lipoprotein kinetics, and plasma triglyceride levels in normotriglyceridemic man. Metabolism. 1981;30(2):165–171. doi: 10.1016/0026-0495(81)90167-0. [DOI] [PubMed] [Google Scholar]
- 33.Packard CJ. Triacylglycerol-rich lipoproteins and the generation of small, dense low-density lipoprotein. Biochem Soc Trans. 2003;31(Pt 5):1066–1069. doi: 10.1042/bst0311066. [DOI] [PubMed] [Google Scholar]
- 34.Packard CJ, Demant T, Stewart JP, Bedford D, Caslake MJ, Schwertfeger G, Bedynek A, et al. Apolipoprotein B metabolism and the distribution of VLDL and LDL subfractions. J Lipid Res. 2000;41(2):305–318. [PubMed] [Google Scholar]
- 35.Donnelly KL, Smith CI, Schwarzenberg SJ, Jessurun J, Boldt MD, Parks EJ. Sources of fatty acids stored in liver and secreted via lipoproteins in patients with nonalcoholic fatty liver disease. J Clin Invest. 2005;115(5):1343–1351. doi: 10.1172/JCI23621. [DOI] [PMC free article] [PubMed] [Google Scholar]
- 36.Min H, Kapoor A, Fuchs M, Mirshahi F, Zhou H, Maher J, Kellum J, et al. Increased hepatic synthesis and dysregulation of cholesterol metabolism is associated with the severity of nonalcoholic fatty liver disease. Cell Metabolism. 2012;15(5):665–674. doi: 10.1016/j.cmet.2012.04.004. [DOI] [PMC free article] [PubMed] [Google Scholar]
- 37.Pagano G, Pacini G, Musso G, Gambino R, Mecca F, Depetris N, Cassader M, et al. Nonalcoholic steatohepatitis, insulin resistance, and metabolic syndrome: Further evidence for an etiologic association. Hepatology. 2002;35(2):367–372. doi: 10.1053/jhep.2002.30690. [DOI] [PubMed] [Google Scholar]
- 38.Shimomura I, Bashmakov Y, Ikemoto S, Horton JD, Brown MS, Goldstein JL. Insulin selectively increases SREBP-1c mRNA in the livers of rats with streptozotocin-induced diabetes. Proc Natl Acad Sci U S A. 1999;96(24):13656–13661. doi: 10.1073/pnas.96.24.13656. [DOI] [PMC free article] [PubMed] [Google Scholar]
Associated Data
This section collects any data citations, data availability statements, or supplementary materials included in this article.


