Abstract
Gingerols are a series of major constituents in fresh ginger with the most abundant being [6]-, [8]-, and [10]-gingerols (6G, 8G, and 10G). We previously found that ginger extract and its purified components, especially 10G, potentially stimulate both the primitive and definitive waves of hematopoiesis (blood cell formation) in zebrafish embryos. However, it is still unclear if the metabolites of 10G retain the efficacy of the parent compound towards pathological anemia treatment. In the present study, we first investigated the metabolism of 10G in zebrafish embryos, and then explored the biotransformation of 10G in humans. Our results show that 10G was extensively metabolized in both zebrafish embryos and in humans, in which two major metabolites, (3S,5S)-[10]-gingerdiol and (3R,5S)-[10]-gingerdiol, were identified by analysis of the MSn spectra and comparison to authentic standards that we synthesized. After 24 hours of treatment of zebrafish embryos, 10G was mostly converted to its metabolites. Our results clearly indicate the reductive pathway is a major metabolic route for 10G in both zebrafish embryos and in humans. Furthermore, we investigated the hematopoietic effect of 10G and its two metabolites, which show similar hematopoietic effects as 10G in zebrafish embryos.
Keywords: [10]-Gingerol, Metabolism, Hematopoiesis, Zebrafish embryos, Human urine
INTRODUCTION
Ginger, the rhizome of Zingiber officinale, has been used worldwide not only as a spice but also as a useful crude drug in traditional Chinese medicine. Recently, there has been a surfeit of scientific research to validate the use of ginger for symptoms such as inflammation, cancer, nausea and vomiting during pregnancy, sprains, muscular aches, cramps, constipation, hypertension, fever, and infectious diseases, as well as rheumatic and gastrointestinal effects.1, 2 The fresh rhizome of ginger contains a rich source of biologically active constituents including volatile oils (1% to 3%) and non-volatile pungent components oleoresin.3 A variety of active components were identified in the oleoresin of ginger including gingerols, a series of homologues with varied unbranched alkyl chain lengths with the most abundant being [6]-, [8]- and [10]-gingerol (6G, 8G, and 10G, respectively).4–6
Gingerols have been found to possess many distinct pharmacological and physiological activities. For example, [6]-gingerol has been reported to significantly and dose-dependently restore renal functions, reduce lipid peroxidation, and enhance the levels of reduced glutathione and activities of superoxide dismutase and catalase against cisplatin-induced oxidative stress and renal dysfunction in rats.7 With our collaborators, we have found that [6]-gingerol was more effective than curcumin, a known cancer preventive agent from Curcuma longa L., in inhibiting 12-O-tetradecanoylphorbol 13-acetate (TPA)-induced tumor promotion in mice.8 Although many reports demonstrate similar bioactivities amongst different gingerols, varying side chain lengths of gingerols may influence their biological efficacies. For example, [10]-gingerol displayed stronger quenching ability of DPPH radicals than [6]-gingerol, [6]-shogaol, and curcumin in a study comparing activities of twenty-nine phenolic compounds isolated from root bark of fresh ginger.9 In the same study, [10]-gingerol exhibited higher inhibition of lipid peroxidation of rat brain homogenates than quercetin.9 Earlier research on isolated components of dried rhizomes of ginger showed that [10]-gingerol exhibited higher toxicity than [4]-, [6]-, and [8]-gingerols against human A549, SK-OV-2, SK-MEL-2, and HCT15 tumor cells.10 In particular, we studied the hematopoiesis promoting effects of ginger extract and its components [6]-, [8]-, and [10]-gingerol, and [6]-, [8]-, and [10]-shogaol in zebrafish embryos, in which 10G showed higher activities among these gingerols and shogaols. We also demonstrated that treatment with 10G promoted hematopoietic recovery from phenylhydrazine-induced anemia in zebrafish embryos,11 while the efficacy of its metabolites is still unknown.
The pharmacokinetics of [10]-gingerol have been examined in humans and in rats.3, 12–14 For example, Zick et al. reported that 1 h after oral administration of 2.0 g of ginger extracts (containing 24.4 mg of 10G), free 10G and its glucuronidated and sulfated metabolites were detected in human plasma with peak concentrations of 9.5 ± 2.2 ng/mL, 370 ± 190 ng/mL, and 18.0 ± 6.0 ng/mL, respectively, and very low concentrations (2–3 ng/mL) of 10G glucuronide and sulfate were found in human colon tissues.12 This study concluded that only non-conjugated ginger components detected in the plasma were 10G and [6]-shogaol, thereby warranting further validation of the pharmacological efficacy of these compounds.12 Additionally, Wang et al. reported that only free 10G was detected in plasma of rats up to four hours after oral administration of 300 mg/kg ginger oleoresin, with no detectable glucoronide or sulfate conjugates between zero and seven hour harvests.13
Given the short apparent half-life of [10]-gingerol, studies of its biotransformation are necessary. However, limited data have been reported on the metabolism of 10G, which may influence its bioactivity in vivo. Furthermore, significant differences in metabolic pathways among different species may exist. The various metabolites and their concentrations can potentially affect in vivo bioactivities and toxicities. For example, coumarin is metabolized to 7-hydroxy coumarin in human and in mouse. However, in the surrogate rat model, coumarin is transformed to a carcinogenic epoxide, a drastic consequence of differential metabolism in seemingly similar mammals.15 This proven rationale of interspecies variation in terms of metabolic behavior was part of the impetus to investigate the biotransformation of 10G in both zebrafish embryos and in humans. As our previous study showed, 10G positively promotes hematopoiesis (blood cell formation) in zebrafish embryos.11 The current study therefore investigates the metabolism of 10G in zebrafish embryos and in humans to compare its biotransformation in these two models, and examines the hematopoietic effects of the metabolites of [10]-gingerol.
MATERIALS AND METHODS
Materials
10G was purified from ginger extract in our laboratory.16 Analytical TLC plates, dimethyl sulfoxide (DMSO), and CDCl3 were purchased from Sigma (St. Louis, MO). HPLC-grade solvents and other reagents were obtained from VWR Scientific (South Plainfield, NJ). HPLC-grade water was prepared using a Barnstead Nanopure water purification system (Waltham, MA). Liquid chromatography/mass spectrometry (LC/MS)-grade water and MeOH were obtained from Thermo Fisher Scientific (Waltham, MA). Ginger tea bags for human experiment were bought from the local supermarket and the levels of [10]-gingerol was 4.66 mg/100g according to our previous reports 17.
Biotransformation of 10G in zebrafish embryos
Zebrafish embryos were staged and maintained according to NCCU IACUC guidelines. In general, fifty zebrafish embryos at the 10–11 hour-post-fertilization (hpf) stage were incubated at 28.5° C in 0.3X Danieau’s solution (19.3 mM NaCl, 0.23 mM KCl, 0.13 mM MgSO4, 0.2 mM Ca(NO3)2, 1.7 mM HEPES, pH 7.0) with or without 5 μg/mL 10G. At 24 hpf, embryos were dechorionated manually and the chorions were carefully removed one by one from the culture medium, so that we did not significantly change the volumes of the solutions. At 28–30 hpf, zebrafish embryos were harvested for analysis.
Zebrafish embryos samples preparation
Acetonitrile (300 μL) with 0.2% acetic acid was added to 50 zebrafish embryos. Samples were homogenized 90 s by an Omni Bead Ruptor Homogenizer (Kennesaw, GA) and then centrifuged at 17,000 g for 10 minutes. The supernatant (250 μL) was collected and diluted 5 times for HPLC and LC-MS analysis.
Synthesis of the two major metabolites of 10G
NaBH4 (57 mg, 1.5 mmol) was added to a solution of 10G (210 mg, 0.6 mmol) in methanol at 0 °C. After stirring at 0 °C for 2 h, the reaction media was neutralized with a diluted acetic acid solution (0.1 M) and extracted with ethyl acetate (10 mL × 3). Combined organic layers were concentrated under reduced pressure. The residue was purified by preparative HPLC to produce the required compounds M1 (44 mg), and M2 (84 mg).
Separation of the isomers (M1 and M2) using preparative HPLC
Waters preparative HPLC systems with 2545 binary gradient module, Waters 2767 sample manager, Waters 2487 autopurification flow cell, Waters fraction collector III, dual injector module, and 2489 UV/Visible detector, were used to separate M1 and M2. A Phenomenex Gemini-NX C18 column (250 mm × 30.0 mm i.d., 5 μm) was used with a flow rate of 20.0 mL/min. The wavelength of UV detector was set at 230 nm. The injection volume was 0.5 mL for each run. The mobile phase consisted of solvent A (H2O) and solvent B (MeOH). The mixtures of M1 and M2 were injected to the preparative column and eluted with an isocratic elution (80% B) for 20 min. M1 and M2 were eluted at 16.5 min and 16.8 min, respectively.
Human urine samples
The Institutional Review Board approved the protocol for human experimentation through the Protection of Human Subjects in Research (11-0092) at North Carolina Agricultural & Technical State University. Three healthy male volunteers (30–40 years old, weighing 60–80 kg, nonsmokers) participated in the study. The subjects did not consume ginger or ginger products for at least 3 days before the experiment. They had the same breakfast, lunch, and dinner during the experiment. The first urine sample was collected just before breakfast, which included 200 mL of two reconstituted ginger tea bags (18 g/bag), and the rest were at 0–2, 2–4, 4–6, 6–9, 9–12, and 12–24 h thereafter. The urine samples were stored at −80 °C before analysis.
Human urine sample preparation
Enzymatic deconjugation was performed as described previously with slight modification.18 In brief, duplicate human urine samples were prepared in the presence of β-glucuronidase (250 U) and sulfatase (3 U) for 24 h at 37 °C and then extracted twice with ethyl acetate. The ethyl acetate fraction was dried under vacuum, and the solid was resuspended in 200 μL of 80% aqueous methanol with 0.1% acetic acid for further LC/MS analysis.
HPLC analysis
An HPLC-ECD (ESA, Chelmsford, MA) consisting of an ESA model 584 HPLC pump, an ESA model 542 autosampler, an ESA organizer, and an ESA Coularray detector coupled with two ESA model 6210 four sensor cells was used in our study. A Gemini C18 column (150 mm × 4.6 mm, 5 μm; Phenomenex, Torrance, CA) was used for chromatographic analysis at a flow rate of 1.0 mL/min. The mobile phases consisted of solvent A (30 mM sodium phosphate buffer containing 1.75% acetonitrile and 0.125% tetrahydrofuran, pH 3.35) and solvent B (15 mM sodium phosphate buffer containing 58.5% acetonitrile and 12.5% tetrahydrofuran, pH 3.45). The gradient elution had the following profile: 20% B from 0 to 3 min; 20–55% B from 3 to 11 min; 55–60% B from 11 to 12 min; 60–65% B from 12 to 13 min; 65–100% B from 13 to 40 min; 100% B from 40 to 45 min; and 20% B from 45.1 to 50 min. The cells were then cleaned at a potential of 1000 mV for 1 min. The injection volume of the sample was 10 μL. The eluent was monitored by the Coulochem electrode array system (CEAS) with potential settings at 200, 250, 300, 350, 400, 450, and 500 mV. Data for Figure 2 was from the channel set at 350 mV of the CEAS.
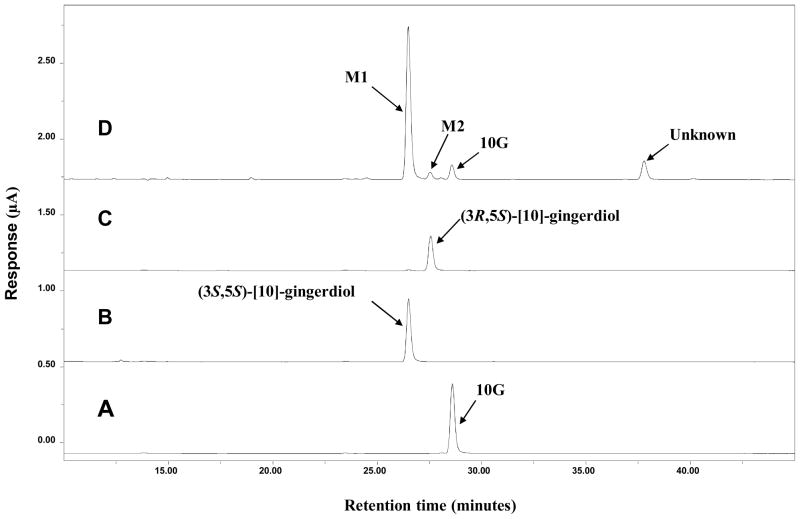
Figure 2.
HPLC-ECD chromatograms of [10]-gingerol (10G) (A), (3S,5S)-[10]-gingerdiol (B), and (3R,5S)-[10]-gingerdiol (C) standards, and lysate of 10G treated zebrafish embryos (D).
LC/APCI-MS method
LC/MS analysis was carried out with a Thermo-Finnigan Spectra System, which consisted of an Accela high-speed MS pump, an Accela refrigerated autosampler, and an LTQ Velos ion trap mass detector (Thermo Electron, San Jose, CA) incorporated with atmospheric-pressure chemical ionization (APCI) interfaces. A Gemini C18 column (150 × 4.6 mm i.d., 5 μm; Phenomenex, Torrance, CA) was used for separation at a flow rate of 0.7 mL/min. The column was eluted with 100% solvent A (5% aqueous methanol with 0.2% acetic acid) for 1 min, followed by linear increases in B (95% aqueous methanol with 0.2% acetic acid) to 50% from 1 min to 5 min, to 85% from 5 to 10 min, isocratic elution with 85% for 15 min, then to 100% from 25 to 33 min, and then with 100% B from 33 to 40 min. The column was then re-equilibrated with 100% A for 5 min. The LC eluent was introduced into the APCI interface. The positive ion polarity mode was set for the APCI source with the voltage on the APCI interface maintained at approximately 4.5 kV. Nitrogen gas was used as the sheath gas and auxiliary gas. Optimized source parameters, including APCI capillary temperature (330 °C), vaporizer temperature (400 °C), sheath gas flow rate (45 units), auxiliary gas flow rate (20 units), and tube lens (50 V), were tuned using authentic 10G. The collision-induced dissociation (CID) was conducted with an isolation width of 2 Da and normalized collision energy of 35 for MS2 and MS3. Default automated gain control target ion values were used for MS – MS3 analyses. The mass range was measured from 100 to 1000 m/z. Data acquisition was performed with Xcalibur version 2.0 (Thermo Electron, San Jose, CA, USA).
Nuclear magnetic resonance (NMR) analysis
1H, 13C, and two- dimensional (2-D) spectra were acquired on a Bucker AVANCE 600 MHz instrument (Brucker, Inc., Silberstreifen, Rheinstetten, Germany). All compounds were analyzed in CDCl3. 1H and 13C NMR data of 10G, M1, and M2 are listed in Table 1.
Table 1.
δH (600 MHz) and δC (150 MHz) NMR spectra data of 10G, M1, and M2 (CDCl3, δ in ppm and J in Hz)
| 10G | M1 | M2 | ||||
|---|---|---|---|---|---|---|
| δH multi (J) | δC | δH multi (J) | δC | δH multi (J) | δC | |
| 1 | 2.63 m 2.73 m |
31.88 | 2.51 m 2.62 m |
31.94a | 2.52 m 2.61 m |
31.38 |
| 2 | 2.63 m 2.73 m |
45.43 | 1.65 m 1.74 m |
39.37 | 1.65 m 1.74 m |
39.98 |
| 3 | 211.48 | 3.88 m | 68.96 | 3.80 m | 72.46 | |
| 4 | 2.39 dd (9.1, 17.4) 2.46 dd (2.7, 17.4) |
49.35 | 1.54 m | 42.37 | 1.48 m | 42.75 |
| 5 | 3.92 m | 67.68 | 3.86 m | 69.61 | 3.76 m | 73.43 |
| 6 | 1.30 m 1.40 m |
36.47 | 1.36 m 1.43 m |
37.51 | 1.36 m | 38.27 |
| 7 | 1.16 m 1.30 m |
25.45 | 1.19 m 1.32 m |
25.77 | 1.19 m 1.29 m |
25.32 |
| 8 | 1.16 m | 29.57a | 1.18 m | 29.62b | 1.18 m | 29.59a |
| 9 | 1.16 m | 29.54a | 1.18 m | 29.61b | 1.18 m | 29.59a |
| 10 | 1.16 m | 29.54a | 1.18 m | 29.56b | 1.18 m | 29.55a |
| 11 | 1.16 m | 29.30a | 1.18 m | 29.31b | 1.18 m | 29.31a |
| 12 | 1.16 m | 29.27a | 1.17 m | 31.89a | 1.17 m | 31.88 |
| 13 | 1.16 m | 22.67 | 1.19 m | 22.68 | 1.19 m | 22.67 |
| 14 | 0.78 t (7.0) | 14.11 | 0.78 t (7.0) | 14.11 | 0.78 t (7.0) | 14.11 |
| 1′ | 132.64 | 133.90 | 133.85 | |||
| 2′ | 6.58 s | 111.00 | 6.61 s | 111.01 | 6.62 s | 111.05 |
| 3′ | 146.46 | 146.46 | 146.45 | |||
| 4′ | 143.97 | 143.73 | 143.72 | |||
| 5′ | 6.72 d (8.0) | 114.40 | 6.73 d (8.0) | 114.31 | 6.73 d (8.0) | 114.29 |
| 6′ | 6.56 d (8.0) | 120.73 | 6.59 d (8.0) | 120.86 | 6.59 d (8.0) | 120.88 |
| OMe | 3.77 s | 55.87 | 3.77 s | 55.87 | 3.77 s | 55.87 |
Assignments interchangeable.
Hematopoietic effects of 10G and its metabolites (M1 and M2) in zebrafish embryos
Transgenic zebrafish and embryos
Zebrafish (Danio rerio) AB transgenic strains Tg(gata1:dsRed)19 were maintained in an Aquaneering fish housing system with 14hr light/10hr dark cycle. The fish embryos were maintained at 28.5 °C in 0.3X Danieau’s solution (19.3 mM NaCl, 0.23 mM KCl, 0.13 mM MgSO4, 0.2 mM Ca(NO3)2, 1.7 mM HEPES, pH 7.0) containing 30 μg/ml phenylthiourea (PTU) to inhibit pigmentation. Zebrafish embryos were washed, dechorionated and anaesthetized before observations and fluorescence video imaging for analysis.
Fluorescent microscopy
Olympus MVX10 MacroView Fluorescence Microscope (Olympus, Center Valley, PA) equipped with Hamamatsu C9300-221 high-speed digital CCD camera (Hamamatsu City, Japan) were used for fluorescence video microscopy. Tg(gata1:dsRed) fluorescent embryos were anaesthetized in tricaine (0.168 mg/mL) and imaged at 5 dpf (day-post-fertilization). MetaMorph TL for Olympus software (Olympus, Center Valley, PA) was used for image acquisition and analysis.
Comparison of erythropoiesis-stimulating activity for 10G and metabolites
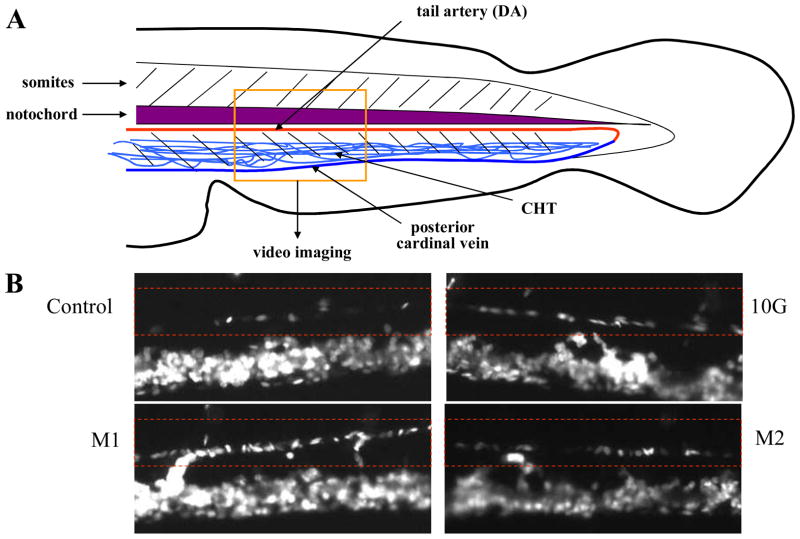
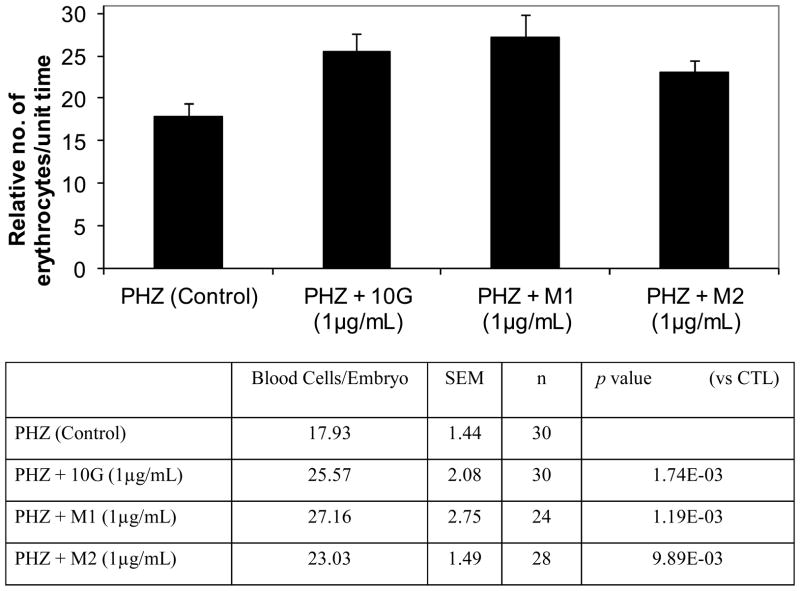
The effects of 10G and its metabolites were compared by their abilities to increase the production of erythrocytes during recovery in an acute hemolytic anemia zebrafish model 11. Phenylhydrazine (PHZ) (0.7ug/mL) was added into 0.3X Danieau’s embryo medium at 28 hpf. The PHZ was washed 3 times extensively with embryo medium at 48 hpf. Then, embryos were incubated with 10G or metabolites (1.0 μg/mL). On day 5, (5 dpf), embryos were anaesthetized and fluorescent erythrocytes from the transgenic Tg(gata1:dsRed) embryos were imaged at the dorsal aorta of the tail region (see the box of the cartoon in Fig 5a). Videos of circulating erythrocytes within the dorsal aorta were analyzed with about 24–30 embryos per group by counting the number of Tg(gata1:dsRed) fluorescent cells entering/exiting the video (100 frames in 1 second; 327 μm distance). The relative number of erythrocytes was normalized by the measured blood flow. Data are presented as mean ± SEM. p values were determined by using the Student’s t-test. p <0.01 was considered statistically significant. One-way ANOVA was used to determine the difference among groups.
Figure 5.
Chemical-induced anemia zebrafish model. A representative picture of zebrafish embryo showing the flow of erythrocytes in dorsal aorta in the tail region (A). Representative fluorescent images of Tg(gata1:dsRed) for control, [10]-gingerol (10G), M1 and M2 (B). Red dashed rectangle indicates the flow of erythrocytes in the dorsal aorta.
RESULTS
Synthesis and structure elucidation of the metabolites of 10G in zebrafish embryos
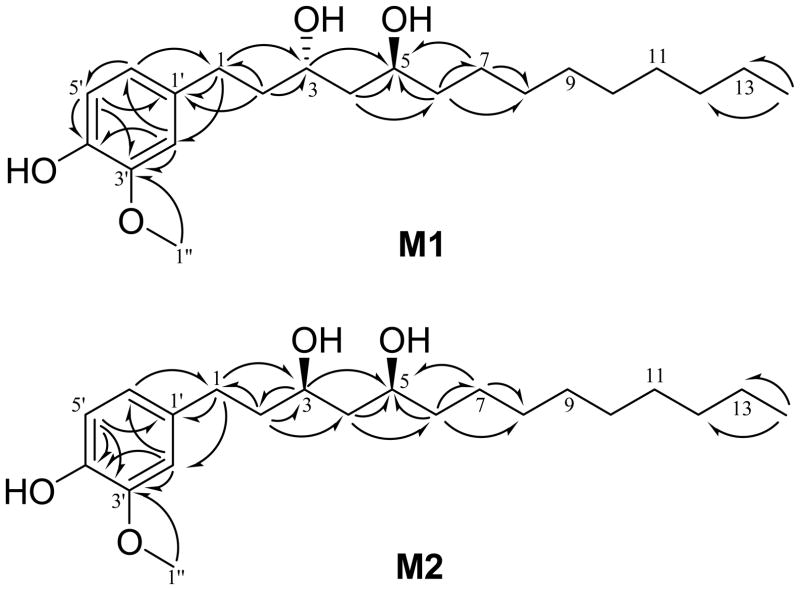
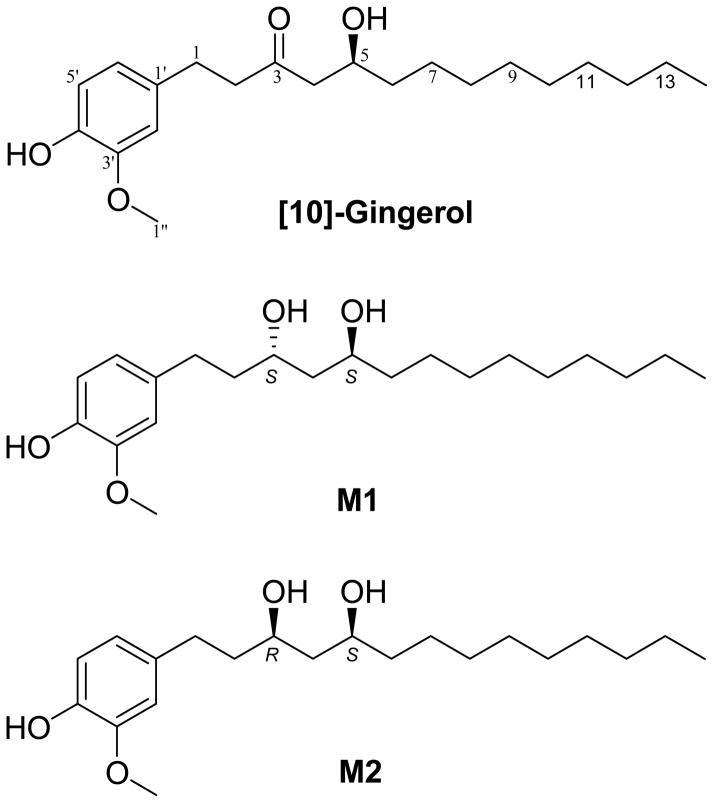
After 18–19 h incubation of 10G with zebrafish embryos, three major metabolites (M1, M2, and one unknown) were detected by HPLC chromatography (Figure 2). Previously, we reported [6]-gingerol was metabolized to two major metabolites, isomeric [6]-gingerdiols.20 Since 10G and 6G are different only in side chain length, we speculated that they shared a similar biotransformation pathway. 10G was reduced by NaBH4 and separated by preparative HPLC (as described in Materials and Methods) to give two products. Their structures were established by analyzing the 1H, 13C, and 2D NMR (HMQC and HMBC) spectra as well as by comparing with literature data.21 One product showed the molecular formula C21H36O4 based on positive APCI-MS at m/z 317 [M + H - 2H2O] + and its 1H and 13C NMR data (Table 1). Its molecular weight was 2 mass units higher than that of 10G, indicating that it might be the product from keto reduction of 10G. In addition to the distinguishable resonance for a methoxyl group (δH 3.77, 3H, s), its 1H NMR spectrum (Table 1) also indicated the presence of a 1,3,4-trisubstituted phenyl group [δH 6.73 (1 H, J = 8.0 Hz); 6.61 (1 H, s); and 6.59 (l H, d, J = 8.0 Hz)] and a methyl group (δH 0.78, 3H, t, J = 7.0 Hz). Its 13C NMR spectrum (Table 1) displayed 21 carbon resonances, which were classified by HMQC experiments as two methyls, 11 methylenes, five methine, and three quaternary carbons. The aforementioned NMR data implied the structure of this product was closely related to that of 10G. The only difference was its C-3 being assigned as an oxymethine (δH 3.88, 1H, m; δC 68.96) instead of the expected ketone carbonyl (δC 211.48) in 10G (Table 1). This was confirmed by the HMBC (Figure 3) correlations of H-1/C-3, H-2/C-3, and H-3/C-5. Therefore, we confirmed that it is the keto reduced product of 10G, [10]-gingerdiol. The other product showed molecular formula C21H36O4 based on positive APCI-MS at m/z 317 [M + H - 2H2O] + and its 1H and 13C NMR data (Table 1). 2D NMR spectra (HMQC and HMBC) indicated these two products possess the same planar structure (Figure 3). Since a new chiral center was formed, the difference between these two products arose at the configuration at C-3. After comparing the NMR data of these two products with those of the two known [6]-gingerdiols, (3R,5S)-gingerdiol and (3S,5S)-gingerdiol,20, 21 we identified these two products as (3S,5S)-[10]-gingerdiol and (3R,5S)-[10]-gingerdiol, respectively.
Figure 3.
Significant HMBC (H→C) correlations of (3S,5S)-[10]-gingerdiol (M1) and (3R,5S)-[10]-gingerdiol (M2).
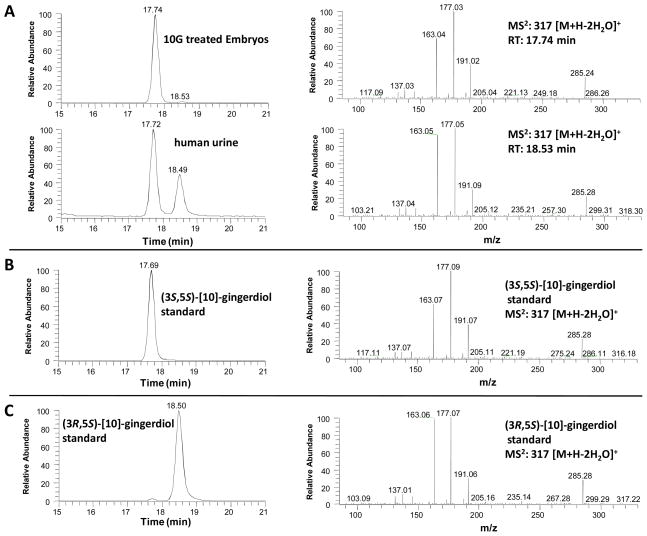
Metabolites M1 and M2 showed the same retention times as those of the synthetic (3S,5S)-[10]-gingerdiol and (3R,5S)-[10]-gingerdiol, respectively, indicating M1 and M2 were (3S,5S)-[10]-gingerdiol and (3R,5S)-[10]-gingerdiol, respectively. We further confirmed this by tandem mass, which indicated that M1 and M2 had almost the same mass fragments as those of the synthetic (3S,5S)-[10]-gingerdiol and (3R,5S)-[10]-gingerdiol, respectively (Figure 4). Therefore, M1 and M2 were identified as (3S,5S)-[10]-gingerdiol and (3R,5S)-[10]-gingerdiol, respectively. Besides these two identified metabolites, there remains one unidentified metabolite at the retention time of 38.9 min (Figure 2D), which we are unable to elucidate its structure at current stage.
Figure 4.
(A) LC-MS2 (positive ion) spectra of the lysate collected from [10]-gingerol (10G) treated zebrafish embryos and urinary sample collected from humans after drinking ginger tea (A); and LC-MS2 (positive ion) spectra of authentic (3S,5S)-[10]-gingerdiol (B), and (3R,5S)- [10]-gingerdiol (C).
Metabolism of 10G in human
While 10G was transformed into two isomeric metabolites, (3S,5S)-[10]-gingerdiol and (3R,5S)-[10]-gingerdiol, in zebrafish embryos, the metabolism of 10G in humans was still unclear. Thus, we pursued an experiment in which urine samples were collected from three healthy human subjects that were given ginger tea to drink. We then searched the urine samples for the two potential 10G metabolites, (3S,5S)-[10]-gingerdiol and (3R,5S)-[10]-gingerdiol using LC/MS, and confirmed 10G was extensively metabolized in humans in a similar manner as in zebrafish embryos, with the same major metabolites (Figure 4).
10G and its metabolites M1 and M2 can stimulate erythropoiesis
We previously developed a chemical-induced anemia zebrafish model 11 in which zebrafish embryos developed acute hemolytic anemia and the condition was reversible. This model is feasible for testing the erythrocyte-stimulating activity of compounds such as 10G and its metabolites M1 and M2 (Figure 5). Here we used PHZ to create acute anemia in zebrafish as the anemic control (17.93±1.44). The addition of 10G promoted the production of erythrocytes during the hematopoietic recovery (25.57+2.08 relative number of erythrocytes/unit time). In addition, both metabolites M1 and M2 exhibited a similar erythrocyte-stimulating activity in promoting the recovery from anemia condition, 27.16±2.75 and 23.03±1.49 relative number of erythrocytes/unit time, respectively (Figure 6). All 10G, M1, and M2 activities were higher than the control with statistical significance (p<0.01).
Figure 6.
Erythropoiesis-stimulating activity of [10]-gingerol (10G) and its metabolites M1 and M2 in zebrafish embryos. The relative number of erythrocytes was compared at 5 day-post- fertilization embryos during hematopoietic recovery after phenylhydrazine (PHZ)-induced anemia in zebrafish embryos. The relative number of erythrocytes is indicated as mean ± SEM. n is number of embryos per group. p value from the Student’s t-test.
DISCUSSION
Previously we reported that ginger extract and its purified components, especially 10G, potentially stimulated both the primitive and definitive waves of hematopoiesis in zebrafish embryos 11. In order to clarify whether 10G itself or its converted metabolites showed this potent effect on hematopoiesis in zebrafish embryos, we first investigated metabolism of 10G in zebrafish embryos and then in humans upon the consumption of ginger tea containing 10G. Our results show that 10G is extensively metabolized in zebrafish embryos through a reductive pathway, and its two isomeric metabolites, (3S,5S)-[10]-gingerdiol (M1) and (3R,5S)-[10]-gingerdiol (M2), were identified by LC/MS analysis as well as comparison with synthesized standards. In addition, our results showed 10G gives a similar metabolic profile in humans as it did in zebrafish embryos. That is, the two major reductive metabolites, (3S,5S)-[10]-gingerdiol and (3R,5S)-[10]-gingerdiol, were also found in human urine. To our knowledge, this is the first study on the metabolism of [10]-gingerol in zebrafish embryos and in humans.
Stereochemical configuration is a fundamental aspect of molecular structure. Substrate stereoselectivity may occur in enzyme-mediated catalysis by virtue of the innate asymmetry of the active site. Product stereoselectivity may also arise when new chiral centers are introduced during an enzymatic reaction, because enzymes may specifically stabilize only one of the possible transition states for a given reaction. In this study, we separated the diastereomers of [10]-gingerdiol to give the major metabolites. We observed there were two dominant peaks (M1 and M2) in human urine compared to only one major peak (M1) in zebrafish embryos. We found that M1 had slightly higher activity in induction of erythropoiesis than M2, indicating that stereochemistry had some influence on biological efficacy. Additionally, M1 and M2 are the reducing products of ketone in 10G. It is reported that ketones can be reduced by carbonyl-reducing enzymes, which are grouped into two large protein superfamilies: the aldo-keto reductases (AKRs) and the short-chain dehydrogenases/reductases (SDRs).22 It is possible that the compositions of the carbonyl-reducing enzymes in zebrafish embryos and in humans are different, giving rise to the observed mismatched products. Substrate and product stereoselectivity by specific carbonyl-reducing enzymes remains to be fully explored, yet could to help further elucidate the biotransformation of 10G.
Erythropoiesis, the process by which red blood cells (erythrocytes) are produced, is conserved in humans, mice, and zebrafish.23 Anemia is a common blood disorder and is characterized by a decreased number of erythrocytes, which we previously found that it would be abrogated by the treatment with 10G.11 Both M1 and M2 had similar erythropoiesis-stimulating activity on zebrafish embryos as that of 10G, and M1 showed slightly higher activity than 10G. Our previous study confirmed that 10G could promote the expression of gata1 in erythroid cells and increase the expression of hematopoietic progenitor markers cmyb and scl. We also demonstrated that 10G could promote hematopoietic recovery from acute hemolytic anemia in zebrafish. We displayed that 10G treatment during gastrulation resulted in an increase of bmp2b and bmp7a expression, and their downstream effectors, gata2 and eve1. At later stages 10G can induce bmp2b/7a, cmyb, scl and lmo2 expression in the caudal hematopoietic tissue. As M1 and M2 display similar activity to 10G, it is likely that they exert their efficacies via this mechanistic pathway.
In conclusion, results from this study are important for understanding the metabolism of [10]-gingerol in zebrafish embryos and in humans and provide useful information that may act as a reference for nutraceutical developments towards treating anemia with ginger. Knowledge of the metabolism of 10G may help in understanding the mechanism of action and therapeutic effects of ginger extract in hematopoiesis. Even studies have shown that zebrafish and mammals have common genetic pathways and regulators during hematopoiesis, whether ginger has the hematopoietic effect in human is a topic for future study.
Figure 1.
Chemical structures of [10]-gingerol and its major metabolites M1 and M2.
Acknowledgments
This work was partially supported by grants CA138277 (S. Sang) from the National Cancer Institute and CA138277S1 (S. Sang) from National Cancer Institute and Office of Dietary Supplement of National Institutes of Health.
Abbreviations
- 10G
[10]-gingerol
- APCI
atmospheric-pressure chemical ionization
- hpf
hour-post-fertilization
- HPLC
high-performance liquid chromatography
- LC/MS
liquid chromatography/mass spectrometry
References
- 1.Ali BH, Blunden G, Tanira MO, Nemmar A. Some phytochemical, pharmacological and toxicological properties of ginger (Zingiber officinale Roscoe): a review of recent research. Food Chem Toxicol. 2008;46:409–20. doi: 10.1016/j.fct.2007.09.085. [DOI] [PubMed] [Google Scholar]
- 2.Kubra IR, Rao LJ. An impression on current developments in the technology, chemistry, and biological activities of ginger (Zingiber officinale Roscoe) Critical reviews in food science and nutrition. 2012;52:651–88. doi: 10.1080/10408398.2010.505689. [DOI] [PubMed] [Google Scholar]
- 3.Zick SM, Djuric Z, Ruffin MT, Litzinger AJ, Normolle DP, Alrawi S, Feng MR, Brenner DE. Pharmacokinetics of 6-gingerol, 8-gingerol, 10-gingerol, and 6-shogaol and conjugate metabolites in healthy human subjects. Cancer Epidemiol Biomarkers Prev. 2008;17:1930–6. doi: 10.1158/1055-9965.EPI-07-2934. [DOI] [PMC free article] [PubMed] [Google Scholar]
- 4.Masada Y, Inoue T, Hashimoto K, Fujioka M, Uchino C. Studies on the constituents of ginger (Zingiber officinale Roscoe) by GC-MS (author’s transl) Yakugaku Zasshi. 1974;94:735–8. doi: 10.1248/yakushi1947.94.6_735. [DOI] [PubMed] [Google Scholar]
- 5.Yu Y, Huang T, Yang B, Liu X, Duan G. Development of gas chromatography-mass spectrometry with microwave distillation and simultaneous solid-phase microextraction for rapid determination of volatile constituents in ginger. J Pharm Biomed Anal. 2007;43:24–31. doi: 10.1016/j.jpba.2006.06.037. [DOI] [PubMed] [Google Scholar]
- 6.Jiang H, Solyom AM, Timmermann BN, Gang DR. Characterization of gingerol-related compounds in ginger rhizome (Zingiber officinale Rosc) by high-performance liquid chromatography/electrospray ionization mass spectrometry. Rapid communications in mass spectrometry: RCM. 2005;19:2957–64. doi: 10.1002/rcm.2140. [DOI] [PubMed] [Google Scholar]
- 7.Kuhad A, Tirkey N, Pilkhwal S, Chopra K. 6-Gingerol prevents cisplatin-induced acute renal failure in rats. Biofactors. 2006;26:189–200. doi: 10.1002/biof.5520260304. [DOI] [PubMed] [Google Scholar]
- 8.Wu H, Hsieh MC, Lo CY, Liu CB, Sang S, Ho CT, Pan MH. 6-Shogaol is more effective than 6-gingerol and curcumin in inhibiting 12-O-tetradecanoylphorbol 13-acetate-induced tumor promotion in mice. Mol Nutr Food Res. 2010;54:1296–306. doi: 10.1002/mnfr.200900409. [DOI] [PubMed] [Google Scholar]
- 9.Peng F, Tao Q, Wu X, Dou H, Spencer S, Mang C, Xu L, Sun L, Zhao Y, Li H, Zeng S, Liu G, Hao X. Cytotoxic, cytoprotective and antioxidant effects of isolated phenolic compounds from fresh ginger. Fitoterapia. 2012;83:568–85. doi: 10.1016/j.fitote.2011.12.028. [DOI] [PubMed] [Google Scholar]
- 10.Kim JS, Lee SI, Park HW, Yang JH, Shin TY, Kim YC, Baek NI, Kim SH, Choi SU, Kwon BM, Leem KH, Jung MY, Kim DK. Cytotoxic components from the dried rhizomes of Zingiber officinale Roscoe. Arch Pharm Res. 2008;31:415–8. doi: 10.1007/s12272-001-1172-y. [DOI] [PubMed] [Google Scholar]
- 11.Ferri-Lagneau KF, Moshal KS, Grimes M, Zahora B, Lv L, Sang S, Leung T. Ginger stimulates hematopoiesis via Bmp pathway in zebrafish. PloS one. 2012;7:e39327. doi: 10.1371/journal.pone.0039327. [DOI] [PMC free article] [PubMed] [Google Scholar]
- 12.Yu Y, Zick S, Li X, Zou P, Wright B, Sun D. Examination of the pharmacokinetics of active ingredients of ginger in humans. The AAPS journal. 2011;13:417–26. doi: 10.1208/s12248-011-9286-5. [DOI] [PMC free article] [PubMed] [Google Scholar]
- 13.Wang W, Li CY, Wen XD, Li P, Qi LW. Simultaneous determination of 6-gingerol, 8-gingerol, 10-gingerol and 6-shogaol in rat plasma by liquid chromatography-mass spectrometry: Application to pharmacokinetics. J Chromatogr B Analyt Technol Biomed Life Sci. 2009;877:671–9. doi: 10.1016/j.jchromb.2009.01.021. [DOI] [PubMed] [Google Scholar]
- 14.Zick SM, Ruffin MT, Djuric Z, Normolle D, Brenner DE. Quantitation of 6-, 8- and 10-Gingerols and 6-Shogaol in Human Plasma by High-Performance Liquid Chromatography with Electrochemical Detection. International journal of biomedical science: IJBS. 2010;6:233–240. [PMC free article] [PubMed] [Google Scholar]
- 15.Lewis DFVLB. Molecular modelling of members of hte P4502A subfamily: application to studies of enzyme specificity. Xenobiotica. 1995;25:585–598. doi: 10.3109/00498259509061877. [DOI] [PubMed] [Google Scholar]
- 16.Sang S, Hong J, Wu H, Liu J, Yang CS, Pan MH, Badmaev V, Ho CT. Increased growth inhibitory effects on human cancer cells and anti-inflammatory potency of shogaols from Zingiber officinale relative to gingerols. J Agric Food Chem. 2009;57:10645–50. doi: 10.1021/jf9027443. [DOI] [PMC free article] [PubMed] [Google Scholar]
- 17.Shao X, Lv L, Parks T, Wu H, Ho CT, Sang S. Quantitative analysis of ginger components in commercial products using liquid chromatography with electrochemical array detection. J Agric Food Chem. 2010;58:12608–14. doi: 10.1021/jf1029256. [DOI] [PMC free article] [PubMed] [Google Scholar]
- 18.Chen H, Lv L, Soroka D, Warin RF, Parks TA, Hu Y, Zhu Y, Chen X, Sang S. Metabolism of [6]-shogaol in mice and in cancer cells. Drug metabolism and disposition: the biological fate of chemicals. 2012;40:742–53. doi: 10.1124/dmd.111.043331. [DOI] [PMC free article] [PubMed] [Google Scholar]
- 19.Traver D, Paw BH, Poss KD, Penberthy WT, Lin S, Zon LI. Transplantation and in vivo imaging of multilineage engraftment in zebrafish bloodless mutants. Nature immunology. 2003;4:1238–46. doi: 10.1038/ni1007. [DOI] [PubMed] [Google Scholar]
- 20.Lv L, Chen H, Soroka D, Chen X, Leung T, Sang S. 6-gingerdiols as the major metabolites of 6-gingerol in cancer cells and in mice and their cytotoxic effects on human cancer cells. J Agric Food Chem. 2012;60:11372–7. doi: 10.1021/jf303879b. [DOI] [PMC free article] [PubMed] [Google Scholar]
- 21.Kikuzaki H, Tsai SM, Nakatani N. Gingerdiol related compounds from the rhizomes of Zingiber officinale. Phytochemistry. 1992;31:1783–1786. [Google Scholar]
- 22.Oppermann U. Carbonyl reductases: the complex relationships of mammalian carbonyl- and quinone-reducing enzymes and their role in physiology. Annu Rev Pharmacol Toxicol. 2007;47:293–322. doi: 10.1146/annurev.pharmtox.47.120505.105316. [DOI] [PubMed] [Google Scholar]
- 23.Palis J, Segel GB. Developmental biology of erythropoiesis. Blood reviews. 1998;12:106–14. doi: 10.1016/s0268-960x(98)90022-4. [DOI] [PubMed] [Google Scholar]


