

Abstract
Neurofibrillary tangles (NFTs) are one of the key histological lesions of Alzheimer’s disease (AD) and are associated with brain atrophy. We assessed regional NFT density in 30 patients with AD, 10 of which presented as the logopenic variant of primary progressive aphasia (lvPPA) and 20 that presented as dementia of the Alzheimer’s type (DAT). Regional grey matter volumes were measured using antemortem MRI. NFT density was significantly higher in left temporoparietal cortices in lvPPA compared to DAT, with no differences observed in hippocampus. There was a trend for the ratio of temporoparietal-to-hippocampal NFT density to be higher in lvPPA. The imaging findings mirrored the pathological findings, with smaller left temporoparietal volumes observed in lvPPA compared to DAT, and no differences observed in hippocampal volume. This study demonstrates that lvPPA is associated with a phenomenon of enhanced temporoparietal neurodegeneration, a finding that improves our understanding of the biological basis of lvPPA.
Keywords: Primary progressive aphasia, Logopenic variant of primary progressive aphasia, Alzheimer’s disease, Neurofibrillary tangles, Hippocampus, MRI, Apolipoprotein E, TDP-43, Voxel-based morphometry, Alzheimer’s dementia
1. Introduction
Alzheimer’s disease (AD) is a pathological entity characterized by the presence of two interrelated histological lesions: the neuritic plaque and the neurofibrillary tangle (NFT) (Braak & Braak, 1991; Dickson, 2001; Hyman & Trojanowski, 1997). Patients with AD typically present with a loss of episodic memory, as well as impairment in other cognitive domains, such as executive, language, praxis and visuospatial function (Cummings, 2000; McKhann et al., 1984). The overall effect is functional disability with the patient being unable to perform their routine activities of daily living. Patients with this presentation, dominated by loss of episodic memory, are typically given a clinical diagnosis of dementia of the Alzheimer’s type (DAT).
For many decades however, we and others have recognized patients with pathologically confirmed AD who instead present with aphasia, or a disease course dominated by aphasia (Galton, Patterson, Xuereb, & Hodges, 2000; Greene, Patterson, Xuereb, & Hodges, 1996; Josephs et al., 2008; Kertesz, McMonagle, Blair, Davidson, & Munoz, 2005; Knibb, Xuereb, Patterson, & Hodges, 2006; Mesulam et al., 2008). Similar to patients with DAT, other cognitive domains can be affected including episodic memory, although the other domains tend to be affected later on in the disease course and always remain less prominent than the aphasia (Galton et al., 2000; Josephs et al., 2008). Typically, anomia is present without loss of word meaning, the speech output is fluent without agrammatism or apraxia of speech, and sentence repetition is poor, particularly for longer sentences (Josephs et al., 2008). Patients with this clinical presentation are typically given a clinical diagnosis of aphasic dementia (Caselli et al., 1993), primary progressive aphasia (Mesulam, 1987), logopenic progressive aphasia (Gorno-Tempini et al., 2004) or logopenic variant of primary progressive aphasia (lvPPA) (Gorno-Tempini et al., 2011).
In DAT, anatomical and histological studies have identified severe hippocampal atrophy (Fox et al., 1996; Jack, Petersen, O’Brien, & Tangalos, 1992), corresponding to the prominent loss of episodic memory (Cahn et al., 1998; Petersen et al., 2000), and have shown that hippocampal atrophy is related to NFT density in the hippocampus (Jack et al., 2002; Silbert et al., 2003; Whitwell et al., 2008). However, in previous imaging studies of patients with suspected or confirmed AD presenting with aphasia, we and others have identified the left lateral temporal and parietal lobes as the regions most heavily affected (Gorno-Tempini et al., 2004; Hu et al., 2010; Josephs et al., 2008; Rogalski & Cobia, et al., 2011; Rogalski & Rademaker, et al., 2011; Rohrer et al., 2010; Whitwell et al., 2009), with relative sparing of the hippocampi (Josephs et al., 2008). In fact, in an imaging study of pathologically confirmed AD patients presenting with aphasia, left temporal lobe atrophy was found to be more severe than left temporal lobe atrophy in matched DAT patients (Josephs et al., 2008). The NFT distribution and the relationship between hippocampal, temporal and parietal atrophy, and NFT density, are understudied in AD patients presenting with aphasia. We therefore designed a study utilizing histology and MRI analysis to get a glimpse of the NFT density underpinnings of the progressive aphasia syndrome associated with AD pathology.
Our aims were: (1) to determine the NFT distribution and density in the left hemisphere of AD patients presenting with aphasia and DAT patients; (2) to determine whether there are differences in NFT density, in the left hemisphere, between AD patients presenting with aphasia and DAT patients; and (3) to use MRI to determine whether there are differences in volume of both the left and right hemispheres between AD patients presenting with aphasia and DAT patients.
In order to accomplish our first aim we compared the NFT density in the left middle frontal, superior temporal and inferior parietal association cortices to the NFT density of left hippocampus in AD patients presenting with aphasia and DAT. We hypothesized that NFT density would be higher in the left superior temporal and inferior parietal lobes than in the left hippocampus of patients with AD presenting with aphasia, but higher in the hippocampus than in these cortices in DAT. To address our second aim, we compared NFT density in hippocampus and association cortices across AD patients presenting with aphasia and DAT patients. We hypothesized that NFT density would be higher in the left superior temporal and inferior parietal lobes, but lower in the left hippocampus, of AD patients presenting with aphasia compared to DAT. Finally, in order to understand what might be happening across the left and right hemispheres, and to address our third aim, we measured regional antemortem MRI volumes of the left and right middle frontal, superior temporal, inferior parietal lobes and hippocampus. We hypothesized that differences in regional volumes observed across AD patients presenting with aphasia and DAT in the left hemisphere would match the regional differences identified in the NFT density analysis, but that there would be no observed differences in regional volumes between AD patients presenting with aphasia and DAT in the right hemisphere.
2. Materials and methods
2.1. Sample identification
We reviewed the medical records of 150 patients who had been evaluated at Mayo Clinic in Rochester MN, had completed a volumetric head MRI scan, and had died and underwent standardized neuropathological assessment with a final diagnosis of AD (Hyman & Trojanowski, 1997). Only cases meeting NIA-Reagan Criteria for high probability AD (Hyman & Trojanowski, 1997) were included in this study. Patients were considered to have progressive aphasia if: (1) aphasia was the chief presenting symptom, or (2) if within 2 years of onset, aphasia had become the most prominent feature of the disease, and (3) the patient had been given a clinical diagnosis of aphasic dementia, primary progressive aphasia, logopenic progressive aphasia, or lvPPA by a senior behavioral neurologist within 3 years of disease onset. Of the 150 patient records reviewed, we identified 10 such patients. All 10 patients had a fluent aphasia that progressively got worse over time, characterized by severe anomia without any evidence of agrammatism or apraxia of speech (Table 1). Retrospective review of the medical records revealed that eight of the 10 patients would meet current criteria for clinically defined lvPPA (Gorno-Tempini et al., 2011). In the remaining two patients, no information was found regarding sentence or phase repetition, although there were other features in keeping with a diagnosis of lvPPA. The presence of phonological errors were not always recorded, however all 10 had additional characteristic features of lvPPA including impaired sentence comprehension. Although no information was given on single word comprehension, none of the 10 patients had features of, or were considered to have, semantic aphasia. We will therefore refer to these 10 patients as having lvPPA. These 10 lvPPA patients were matched by age at onset, age at scan, gender, and disease duration to 20 patients from the same pathological cohort that had been given a diagnosis of DAT (McKhann et al., 1984). All DAT patients presented with a chief complaint of loss of episodic memory and none had aphasia as a co-presenting feature, nor was aphasia ever recorded as being the most prominent symptom during the course of the disease.
Table 1.
Clinical features of all 10 lvPPA patients at first evaluation and at time of MRI.
| Difficulty naming | Poor repetition | Poor sentence comprehension | Phonological errors | Agrammatic errors | Apraxia of speech | Memory loss | ||||||||
|---|---|---|---|---|---|---|---|---|---|---|---|---|---|---|
|
|
|
|
|
|
|
|
||||||||
| 1st | MRI | 1st | MRI | 1st | MRI | 1st | MRI | 1st | MRI | 1st | MRI | 1st | MRI | |
| 1 | + | + | + | + | − | + | NR | + | − | − | − | − | + | + |
| 2 | + | + | + | + | + | + | − | NR | − | − | − | − | − | + |
| 3 | + | + | NR | NR | + | + | NR | NR | − | − | − | − | − | + |
| 4 | + | + | + | + | − | + | − | NR | − | − | − | − | − | − |
| 5 | + | + | − | + | + | + | NR | NR | − | − | − | − | + | + |
| 6 | + | + | + | + | + | + | NR | NR | − | − | − | − | + | + |
| 7 | + | + | + | + | + | + | + | + | − | − | − | − | − | + |
| 8 | + | + | NR | + | + | + | NR | NR | − | − | − | − | + | + |
| 9 | + | + | + | + | + | + | + | + | − | − | − | − | − | − |
| 10 | + | + | + | + | + | + | + | + | − | − | − | − | − | + |
+ = Present; − = absent; NR = not recorded.
All patients had been prospectively recruited and followed longitudinally in the Mayo Clinic Alzheimer’s Disease Research Center (ADRC) and had undergone cognitive and functional testing, including the Mini-Mental State Examination (MMSE) (Folstein, Folstein, & McHugh, 1975) and Clinical Dementia Rating Scale sum of boxes (CDR-SB) (Hughes, Berg, Danziger, Coben, & Martin, 1982). Apolipoprotein E (APOE) genotyping was performed as previously described (Josephs, Tsuboi, Cookson, Watt, & Dickson, 2004). Informed consent was obtained from all patients or proxies for participation in the study which was approved by the Mayo Clinic Institutional Review Board.
2.2. Neuropathological procedure
All patients underwent standardized neuropathological examination using the recommended diagnostic protocol for AD (Mirra et al., 1991). Pathological diagnoses were conducted by one of our experienced neuropathologists (JEP or DWD). After removal, the brain was divided into right and left hemibrains. The left hemibrain was fixed in 10% buffered formaldehyde for 7–10 days, and then sectioned. Samples were processed in paraffin and stained with Hematoxylin and Eosin and modified Bielschowsky silver impregnation, and immunostained with antibodies to β-amyloid (clone 6F/3D, 1:10 dilution; Novocastra Vector Labs, Burlingame, CA), tau (clone AT8, 1:1,000 dilution; Endogen, Woburn, MA), alpha-synuclein (clone LB509, 1:200 dilution; Zymed, San Francisco, CA), neurofilament (DAKO clone 2F11, 1:75 dilution; DAKO, Carpinteria, CA), ubiquitin (DAKO polyclonal, 1:100 dilution), and the TAR DNA-binding protein of 43 kDa (TDP-43) (1:8000; Protein-Tech group, Chicago, IL). In each case, Braak staging was performed using Bielschowsky silver stain (Braak & Braak, 1991) and AD was diagnosed based on high probability of AD according to the NIA Reagan criteria (Hyman & Trojanowski, 1997). All cases had a Braak stage of V or VI and a Consortium to Establish a Registry for Alzheimer’s Disease (CERAD) (Mirra et al., 1991) score of definite. Amygdala sections were reviewed for the presence of TDP-43 immunoreactivity since the amygdala is the earliest region affected by TDP-43 in AD (Hu et al., 2008). Presence of Lewy bodies was noted.
For this study, thioflavin-S fluorescence microscopy was utilized to quantitatively measure NFT density using an Olympus BH2 fluorescence microscope (Center Valley, PA, USA). NFT counts were performed on intracellular and extracellular tangles from the hippocampus proper (CA1 and subiculum) and from three association cortical areas: middle frontal; inferior parietal and superior temporal. First, for the cortex, each slide, i.e. middle frontal, inferior parietal and superior temporal, was visually scanned in its entirety at 10× magnification. The region on the slide with the highest NFT density was then selected and NFT counts were performed in this region at 40× magnification (area = 0.125 mm2). NFT density was defined as the number of NFT tangles per area. If we were unable to determine which region had the highest NFT density at 10× magnification, we would select multiple regions (up to three) that appeared to have equivalent high NFT density and perform NFT counts at 40× magnification for each of these regions. Of these regions, the one with the highest NFT count was selected and used for the study. Similar to cortex, the slide that contained hippocampal CA1 and subiculum was visually scanned at 10× magnification to select the region with the highest NFT density. The NFT count in this region was then determined at 40× magnification. Visual rating of neuritic plaques was performed with thioflavin-S fluorescence microscopy on neocortical regions and graded on a four point scale (none, sparse, moderate, and frequent).
2.3. MRI analyses
All patients underwent a standardized protocol head MRI scan at 1.5 T that included a T1-weighted 3-dimensional spoiled gradient echo sequence (22 × 16.5 cm or 24 × 18.5 cm FOV, 25° flip angle, 124 contiguous 1.6 mm thick coronal slices). Standard preprocessing corrections were applied, including corrections for intensity inhomogeneity (Sled, Zijdenbos, & Evans, 1998) and gradient warping (Jovicich et al., 2006). The scan closest to death was chosen for analysis in all patients in order to strengthen imaging pathological correlations.
Atlas-based parcellation was employed using SPM5 and the automated anatomic labeling (AAL) atlas (Tzourio-Mazoyer et al., 2002) to generate grey matter volumes for specific regions-of-interest. In order to analyze similar regions that were assessed pathologically, we measured the volume of the hippocampus, middle frontal gyrus, superior temporal gyrus and inferior parietal lobe (Fig. 1). Left and right hemispheres were assessed separately. The single-subject brain image (Tzourio-Mazoyer et al., 2002) with atlas labels was normalized to a customized template (Vemuri et al., 2008) and edited. Each patient MRI scan was also then spatially normalized to the custom template, and then for each patient, the inverse transformation was applied to the atlas in order to warp the atlas to the patient’s native anatomical space. Each patient scan was segmented into grey matter, white matter and cerebrospinal fluid in native space (Ashburner & Friston, 2005). The segmented grey matter probability map was thresholded at a value of 0 to create a binary grey matter mask and multiplied by the patient-specific warped atlas, to generate a custom grey matter atlas for each patient, and parceled into the aforementioned regions-of-interest. Grey matter volumes were calculated for each region for each patient by multiplying the mean grey matter probability by the total number of voxels within a region-of-interest and by the voxel volume. In addition, total intracranial volume (TIV) was calculated by propagating a template-drawn TIV mask to the patient space as above, and then performing an erosion step to remove border voxels. All regional volumes were divided by TIV to correct for differences in head size.
Fig. 1.
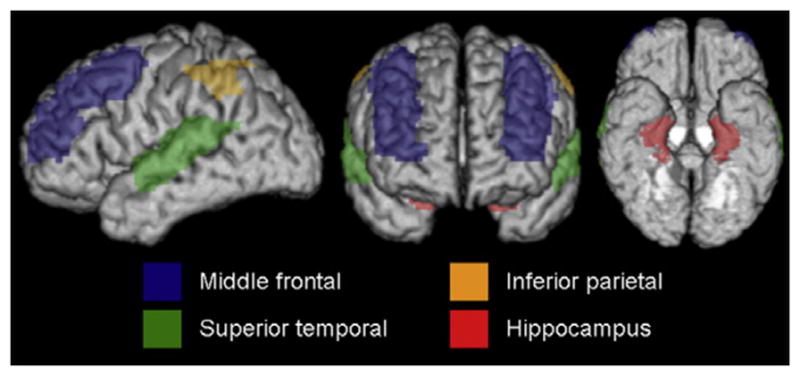
3D brain renderings illustrating the AAL regions assessed.
Patterns of grey matter atrophy were also assessed at the voxel-level using the automated and unbiased technique of voxel-based morphometry (VBM) (Ashburner & Friston, 2000) and SPM5. All images were normalized to a customized template (Vemuri et al., 2008) and segmented using unified segmentation (Ashburner & Friston, 2005), followed by the hidden Markov random field clean-up step (Zhang, Brady, & Smith, 2001). All grey matter segmentations were modulated and smoothed at 8 mm full width at half maximum. A full factorial model was used to assess grey matter volume loss in lvPPA and DAT compared to a group of 150 age and gender-matched neurologically normal controls, after correction for multiple comparisons using the false discovery rate correction at p < 0.001.
2.4. Statistical analyses
Statistical analyses were performed utilizing the JMP computer software (JMP Software, version 8.0.0; SAS Institute Inc., Cary, NC) with α set at ≤0.05. Differences in categorical variables between lvPPA and DAT were assessed with chi-squared tests; Fishers Exact Tests if cells consisted of small numbers. Differences in continuous variables between the two groups were assessed using Mann Whitney-U test as the data was not normally distributed. Linear regression analysis was utilized to assess for associations between left hemisphere volumes and NFT density, adjusting for age at scan.
3. Results
Demographic features for the 10 lvPPA patients and the 20 matched DAT patients are shown in Table 2. There were no significant differences in demographic features between both groups. A high APOE e4 allele frequency was found in both the lvPPA (60%) and DAT (65%) groups. No differences were observed between lvPPA and DAT in Braak stage, neuritic plaque deposition, the presence/absence of Lewy bodies and amygdala TDP-43 immunoreactivity.
Table 2.
Patient demographics.
| lvPPA (n = 10) | DAT (n = 20) | P value | |
|---|---|---|---|
| Gender | 5 (50%) | 10 (50%) | 1.00 |
| Handedness (R:L:A:unknown) | 9:1:0:0 | 15:1:0:4 | 0.73 |
| Education | 14.6 ± 2.4 | 12.7 ± 3.3 | 0.18 |
| APOE e4 positive | 6 (60%) | 13 (65%) | 0.79 |
| Age at onset (yrs) | 69.9 ± 7.8 | 71.1 ± 4.3 | 0.61 |
| Age at death (yrs) | 79.4 ± 8.8 | 81.6 ± 4.4 | 0.69 |
| Age at scan (yrs) | 75.0 ± 8.8 | 77.5 ± 4.0 | 0.72 |
| Disease duration (yrs) | 9.5 ± 2.1 | 9.5 ± 1.9 | 0.86 |
| Time from onset to scan (yrs) | 5.1 ± 2.7 | 5.4 ± 1.8 | 0.60 |
| Time from scan to death (yrs) | 4.4 ± 2.1 | 4.1 ± 2.1 | 0.86 |
| MMSE at scan | 14.3 ± 7.7 | 16.1 4.9 | 0.43 |
| CDR-SB at scan | 7.7 ± 4.4 | 8.7 ± 4.5 | 0.83 |
| Braak stage V | 2 (20%) | 3 (15%) | 0.99 |
| Braak stage VI | 8 (80%) | 17 (85%) | 0.99 |
| Lewy bodies | 3 (30%) | 7 (35%) | 0.99 |
| TDP-43+ in amygdala | 6 (60%) | 12 (60%) | 0.99 |
| Neuritic plaques (frequent:moderate:sparse) | 9:1:0 | 20:0:0 | 0.33 |
Data shown as mean (standard deviation).
APOE = apolipoprotein E; CDR-SB = Clinical Dementia Rating Scale sum of boxes; DAT = dementia of the Alzheimer’s type; MMSE = Mini-Mental State Examination; lvPPA = logopenic variant of primary progressive aphasia; R = right; L = left; A = ambidextrous.
Table 3 shows the NFT density for both lvPPA and DAT patients. Within the lvPPA group, a significant difference was observed between the middle frontal NFT density and the hippocampal NFT density (p = 0.02), with a higher density observed in the hippocampus. No differences were observed between the hippocampal NFT density and NFT density in the superior temporal (p = 0.85) or inferior parietal (p = 0.17) regions. However, within the DAT group, the NFT density in the hippocampus was significantly greater than all three cortical regions (middle frontal p = 0.0003; superior temporal p = 0.02; inferior parietal p = 0.002).
Table 3.
Neurofibrillary tangle density.
| lvPPA (n = 10) | DAT (n = 20) | P value | |
|---|---|---|---|
| Left middle frontal cortex | 11.3 ± 5.3 | 8.0 ± 7.1 | 0.10 |
| Left superior temporal cortex | 19.0 ± 8.1 | 11.0 ± 7.1 | 0.02 |
| Left inferior parietal cortex | 14.4 ± 5.2 | 8.8 ± 6.1 | 0.03 |
| Left hippocampus | 21.2 ± 12.8 | 22.8 ± 17.3 | 0.71 |
| Left cortical: hippocampal ratioa | 1.1 ± 0.83 | 0.6 ± 0.5 | 0.09 |
Data shown as mean ± standard deviation.
DAT = dementia of the Alzheimer’s type; lvPPA = logopenic variant of primary progressive aphasia.
Calculated as (average of temporal and parietal NFT density)/(hippocampal NFT density).
There were significant differences in the NFT density for the left superior temporal and inferior parietal cortices between the lvPPA and DAT patients, with the lvPPA patients having a higher NFT density in both cortices compared to the DAT patients (Fig. 2 and Table 3). This difference is illustrated in example histological sections in Fig. 3. No differences were identified for left frontal lobe NFT density or for left hippocampal NFT density between lvPPA and DAT patients. A trend was observed for a difference in the ratio of left temporoparietal association cortex NFT density: hippocampal NFT density, between lvPPA and DAT patients, with the lvPPA patients having a higher ratio (1.1 versus 0.6).
Fig. 2.

Box-plot showing NFT density in middle frontal, superior temporal, inferior parietal and hippocampus in lvPPA and DAT. P values highlighting differences across lvPPA and DAT are shown for each region.
Fig. 3.
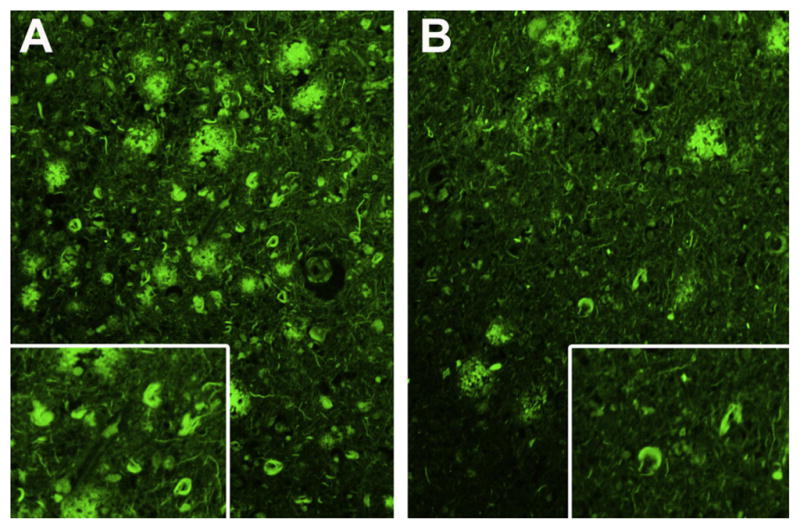
Thioflavin-S fluorescence photomicrograph of neurofibrillary tangles from left parietal lobe in a patient with lvPPA (A) and a patient with DAT and (B) showing higher density of neurofibrillary tangles in lvPPA. Magnification ×200 and inset magnification ×300.
There were significant differences in grey matter volume of the left superior temporal gyrus and left inferior parietal lobe between the lvPPA and DAT patients, with the lvPPA patients having smaller volumes compared to DAT (Fig. 4 and Table 4). There was also a trend for a difference across lvPPA and DAT in the middle frontal gyrus, again with smaller volumes observed in lvPPA. No differences were observed across lvPPA and DAT in the left hippocampus or any of the regions in the right hemisphere.
Fig. 4.

Box-plots showing left and right grey matter volume in middle frontal, superior temporal, inferior parietal and hippocampus in lvPPA and DAT. P values highlighting differences across lvPPA and DAT are shown for each region, for each hemisphere.
Table 4.
MRI regional grey matter volumes.
| lvPPA (n = 10) | DAT (n = 20) | P value | |
|---|---|---|---|
| Middle frontal gyri | |||
| Left | 0.80 ± 0.11 | 0.87 ± 0.09 | 0.08 |
| Right | 0.76 ± 0.12 | 0.77 ± 0.09 | 0.76 |
| Superior temporal gyri | |||
| Left | 0.44 ± 0.10 | 0.52 ± 0.08 | 0.04 |
| Right | 0.49 ± 0.05 | 0.53 ± 0.07 | 0.10 |
| Inferior parietal lobe | |||
| Left | 0.77 ± 0.12 | 0.86 ± 0.12 | 0.04 |
| Right | 0.81 ± 0.08 | 0.86 ± 0.11 | 0.25 |
| Hippocampus | |||
| Left | 0.21 ± 0.04 | 0.21 ± 0.03 | 0.72 |
| Right | 0.21 ± 0.02 | 0.20 ± 0.02 | 0.25 |
Data shown as mean ± standard deviation.
All regional volumes were divided by TIV to correct for differences in head size and multiplied by 100.
DAT = dementia of the Alzheimer’s type; lvPPA = logopenic variant of primary progressive aphasia.
There was a significant association between NFT density and MRI volumes after adjusting for age at MRI scan, across all 30 subjects, for left middle frontal (p = 0.01), superior temporal (p = 0.005), inferior parietal (p = 0.03) and hippocampus (p = 0.05).
The VBM analysis demonstrated typical patterns of atrophy for both the lvPPA and DAT groups (Fig. 5). The lvPPA group showed striking lateral temporal and parietal volume loss with less involvement of the hippocampus, predominantly on the left, compared to controls. The DAT group showed strikingly symmetric temporal, parietal and hippocampal volume loss, compared to controls.
Fig. 5.

Voxel-based morphometry patterns of grey matter loss in lvPPA and DAT compared to controls. Scans closest to death were used in all lvPPA and DAT cases. Results are shown on three dimensional renderings of the brain after correction for multiple comparisons using the false discovery rate correction at p < 0.001.
4. Discussion
This study demonstrates focal histological differences between lvPPA and DAT patients. Higher NFT density was observed in the left lateral temporal and parietal regions in lvPPA compared to DAT, in the absence of any difference in the hippocampus. Volumes measured on MRI mirrored these findings. This demonstrates that the lvPPA syndrome is associated with a phenomenon of enhanced temporoparietal neurodegeneration, a finding that improves our understanding of the biological basis of progressive aphasia associated with AD pathology.
The finding that lvPPA was associated with asymmetric left temporoparietal volume loss is to be expected and concurs with previous imaging studies (Gorno-Tempini et al., 2004; Josephs et al., 2008). However, we demonstrate that the NFT density in the left temporoparietal cortex is actually greater in lvPPA than DAT. Surprisingly, there was no difference in NFT density of the hippocampus. There was a trend for the ratio of temporoparietal to hippocampal involvement to be greater in lvPPA than in DAT as a result of the increased cortical NFT density in the temporoparietal cortex in lvPPA, rather than a sparing of NFT pathology in the hippocampus. Although we do not know whether this pattern of greater temporoparietal to hippocampal involvement was present antemortem, i.e. earlier in the disease course, it does seems likely that the lvPPA syndrome is manifesting as a result of the severe left temporoparietal pathology, rather than from lesser involvement of the hippocampus, or solely from the presence of left more than right temporoparietal asymmetry. Further supporting this statement is the fact that we also identified differences between regions, within syndromes. The hippocampus had a significantly greater NFT density than the temporoparietal cortex in DAT, but not lvPPA; most likely reflecting the elevated temporoparietal density in lvPPA. While the histological focus in lvPPA is clearly the left temporoparietal cortex, there was also some evidence for increased NFT density in the left frontal cortex compared to DAT. This suggests that AD presenting as lvPPA targets the entire cortex in the left hemisphere as previously suggested (Mesulam et al., 2008), but with a striking focus in the temporoparietal area. Since the submission of this study, another study using stereology, although with a smaller number of subjects, noted greater NFT density in the left compared to right hemisphere of lvPPA patients further supporting a left hemisphere NFT predominance in lvPPA (Gefen et al., 2012). In addition, they noted a greater neocortical to entorhinal cortex ratio in lvPPA compared to DAT, similar to our findings with the temporoparietal cortex and hippocampus.
The regional MRI volumes evaluated at the last possible MRI for each patient mirrored the pathological findings, with greater temporoparietal atrophy observed in lvPPA compared to DAT, yet similar hippocampal volumes. This supports the previous suggestion that grey matter volume is a good marker of NFT density (Whitwell et al., 2008, 2012). The absence of a difference in hippocampal volumes between lvPPA and DAT is however worth further discussion. Hippocampal atrophy has often been implicated in progressive aphasia syndromes believed to be associated with AD pathology (Gorno-Tempini et al., 2004; Migliaccio et al., 2009). However, previous studies including our own, have found evidence for greater hippocampal atrophy in DAT patients compared to patients with either confirmed or presumed AD presenting with aphasia (Josephs et al., 2008; Migliaccio et al., 2009). Many of the previous studies have, however, assessed imaging earlier in the disease course which implies that hippocampal atrophy may occur later in the disease course in lvPPA and “catch-up” with the degree of hippocampal atrophy observed in DAT. In fact, memory loss was more commonly observed at the time of MRI than at the time of presentation in our lvPPA cohort. Nevertheless, it is clear from our findings that while the hippocampus is a focus of atrophy in DAT, this is not the case in lvPPA, and more likely that the hippocampus atrophies over time as a result of the widespread neurodegenerative process. Longitudinal studies would be useful to compare rates of hippocampal atrophy across lvPPA and DAT to determine whether rates in lvPPA may in fact be higher than those observed in DAT during the later stages of the disease.
Although one could argue that greater NFT density and atrophy in the temporoparietal and frontal cortices in lvPPA may reflect longer disease duration, this argument is fallible since our lvPPA and DAT cohorts were well matched for disease duration and time from onset to scan. There was no evidence for the lvPPA patients to be more cognitively or functionally impaired as there was no difference in MMSE or CDR-SB at the time of scan. Differences identified across groups are also unlikely to be confounded by APOE genotype, as the proportion of patients with the APOE e4 allele was similar in both lvPPA and DAT. The frequency of APOE e4 carriers in our DAT patients was in line with previous studies of DAT (Itabashi, Arai, Higuchi, Sasaki, & Trojanowska, 1996; Saunders et al., 1993). One previous study in lvPPA patients observed a similar high proportion of APOE e4 carriers in lvPPA (Gorno-Tempini et al., 2004), although another study assessing this same syndrome observed a much lower proportion (Rogalski & Cobia, et al., 2011; Rogalski & Rademaker, et al., 2011). Finally, there was also no evidence that the findings from this study were affected by the presence of other pathologies, such as Lewy bodies, amyloid deposition as measure by the presence of senile neuritic plaques and TDP-43 immunoreactivity, at least as measured by TDP-43 deposition in the amygdala which has been shown to be the most sensitive region for TDP-43 deposition in AD (Hu et al., 2008).
The NFT density correlated with MRI grey matter volume in all regions. These correlations further support the relationship between NFT density and MRI volume that has been previously observed in DAT (Csernansky et al., 2004; Gosche, Mortimer, Smith, Markesbery, & Snowdon, 2002; Jack et al., 2002; Whitwell et al., 2008) and supports the notion that MRI grey matter volume is a good marker of tau deposition.
5. Conclusion
We have demonstrated important differences between lvPPA and DAT at the histological level that help to further elucidate the biological basis of progressive aphasia associated with AD pathology.
Acknowledgments
Role of the funding source
This study was funded by R21-AG038736 (PI Whitwell), R01-AG037491 (PI Josephs), R01-AG11378 (PI Jack), and P50-AG16574 (PI Petersen).
The study sponsor played no role in the study design; in the collection, analysis, and interpretation of the data; in the writing of the report; and in the decision to submit the paper for publication.
We would like to acknowledge Kris Johnson and Monica Castanedes-Casey for assistance in data management and pathological analyses. We also acknowledge Drs. Emory Kokmen, Bradley Boeve, David Knopman, Yonas Geda, Brian Woodruff, David Tang-Wai, Andrew Frank and Gregory Jicka, who were involved with the clinical care of some of the patients reported.
References
- Ashburner J, Friston KJ. Voxel-based morphometry – the methods. Neuroimage. 2000;11(6 Pt 1):805–821. doi: 10.1006/nimg.2000.0582. [DOI] [PubMed] [Google Scholar]
- Ashburner J, Friston KJ. Unified segmentation. Neuroimage. 2005;26(3):839–851. doi: 10.1016/j.neuroimage.2005.02.018. [DOI] [PubMed] [Google Scholar]
- Braak H, Braak E. Neuropathological stageing of Alzheimer-related changes. Acta Neuropathologica. 1991;82(4):239–259. doi: 10.1007/BF00308809. [DOI] [PubMed] [Google Scholar]
- Cahn DA, Sullivan EV, Shear PK, Marsh L, Fama R, Lim KO, et al. Structural MRI correlates of recognition memory in Alzheimer’s disease. Journal of the International Neuropsychology Society. 1998;4(2):106–114. doi: 10.1017/s1355617798001064. [DOI] [PubMed] [Google Scholar]
- Caselli RJ, Windebank AJ, Petersen RC, Komori T, Parisi JE, Okazaki H, et al. Rapidly progressive aphasic dementia and motor neuron disease. Annals of Neurology. 1993;33(2):200–207. doi: 10.1002/ana.410330210. [DOI] [PubMed] [Google Scholar]
- Csernansky JG, Hamstra J, Wang L, McKeel D, Price JL, Gado M, et al. Correlations between antemortem hippocampal volume and postmortem neuropathology in AD subjects. Alzheimer Disease and Associated Disorders. 2004;18(4):190–195. [PubMed] [Google Scholar]
- Cummings JL. Cognitive and behavioral heterogeneity in Alzheimer’s disease: Seeking the neurobiological basis. Neurobiology of Aging. 2000;21(6):845–861. doi: 10.1016/s0197-4580(00)00183-4. [DOI] [PubMed] [Google Scholar]
- Dickson DW. Neuropathology of Alzheimer’s disease and other dementias. Clinics in Geriatric Medicine. 2001;17(2):209–228. doi: 10.1016/s0749-0690(05)70066-5. [DOI] [PubMed] [Google Scholar]
- Folstein MF, Folstein SE, McHugh PR. Mini-mental state”. A practical method for grading the cognitive state of patients for the clinician. Journal of Psychiatric Research. 1975;12(3):189–198. doi: 10.1016/0022-3956(75)90026-6. [DOI] [PubMed] [Google Scholar]
- Fox NC, Warrington EK, Freeborough PA, Hartikainen P, Kennedy AM, Stevens JM, et al. Presymptomatic hippocampal atrophy in Alzheimer’s disease. A longitudinal MRI study. Brain. 1996;119(Pt 6):2001–2007. doi: 10.1093/brain/119.6.2001. [DOI] [PubMed] [Google Scholar]
- Galton CJ, Patterson K, Xuereb JH, Hodges JR. Atypical and typical presentations of Alzheimer’s disease: A clinical, neuropsychological, neuroimaging and pathological study of 13 cases. Brain. 2000;123(Pt 3):484–498. doi: 10.1093/brain/123.3.484. [DOI] [PubMed] [Google Scholar]
- Gefen T, Gasho K, Rademaker A, Lalehzari M, Weintraub S, Rogalski E, et al. Clinically concordant variations of Alzheimer pathology in aphasic versus amnestic dementia. Brain. 2012;135(Pt. 5):1554–1565. doi: 10.1093/brain/aws076. [DOI] [PMC free article] [PubMed] [Google Scholar]
- Gorno-Tempini ML, Dronkers NF, Rankin KP, Ogar JM, Phengrasamy L, Rosen HJ, et al. Cognition and anatomy in three variants of primary progressive aphasia. Annals of Neurology. 2004;55(3):335–346. doi: 10.1002/ana.10825. [DOI] [PMC free article] [PubMed] [Google Scholar]
- Gorno-Tempini ML, Hillis AE, Weintraub S, Kertesz A, Mendez M, Cappa SF, et al. Classification of primary progressive aphasia and its variants. Neurology. 2011;76(11):1006–1014. doi: 10.1212/WNL.0b013e31821103e6. [DOI] [PMC free article] [PubMed] [Google Scholar]
- Gosche KM, Mortimer JA, Smith CD, Markesbery WR, Snowdon DA. Hippocampal volume as an index of Alzheimer neuropathology: Findings from the Nun Study. Neurology. 2002;58(10):1476–1482. doi: 10.1212/wnl.58.10.1476. [DOI] [PubMed] [Google Scholar]
- Greene JD, Patterson K, Xuereb J, Hodges JR. Alzheimer disease and nonfluent progressive aphasia. Archives of Neurology. 1996;53(10):1072–1078. doi: 10.1001/archneur.1996.00550100158027. [DOI] [PubMed] [Google Scholar]
- Hu WT, Josephs KA, Knopman DS, Boeve BF, Dickson DW, Petersen RC, et al. Temporal lobar predominance of TDP-43 neuronal cytoplasmic inclusions in Alzheimer disease. Acta Neuropathologica. 2008;116(2):215–220. doi: 10.1007/s00401-008-0400-4. [DOI] [PMC free article] [PubMed] [Google Scholar]
- Hu WT, McMillan C, Libon D, Leight S, Forman M, Lee VM, et al. Multimodal predictors for Alzheimer disease in nonfluent primary progressive aphasia. Neurology. 2010;75(7):595–602. doi: 10.1212/WNL.0b013e3181ed9c52. [DOI] [PMC free article] [PubMed] [Google Scholar]
- Hughes CP, Berg L, Danziger WL, Coben LA, Martin RL. A new clinical scale for the staging of dementia. British Journal of Psychiatry. 1982;140:566–572. doi: 10.1192/bjp.140.6.566. [DOI] [PubMed] [Google Scholar]
- Hyman BT, Trojanowski JQ. Consensus recommendations for the postmortem diagnosis of Alzheimer disease from the National Institute on Aging and the Reagan Institute Working Group on diagnostic criteria for the neuropathological assessment of Alzheimer disease. Journal of Neuropathology and Experimental Neurology. 1997;56(10):1095–1097. doi: 10.1097/00005072-199710000-00002. [DOI] [PubMed] [Google Scholar]
- Itabashi S, Arai H, Higuchi S, Sasaki H, Trojanowska JQ. APOE epsilon 4 allele in Alzheimer’s and non-Alzheimer’s dementias. Lancet. 1996;348(9032):960–961. doi: 10.1016/s0140-6736(05)65372-x. [DOI] [PubMed] [Google Scholar]
- Jack CR, Jr, Dickson DW, Parisi JE, Xu YC, Cha RH, O’Brien PC, et al. Antemortem MRI findings correlate with hippocampal neuropathology in typical aging and dementia. Neurology. 2002;58(5):750–757. doi: 10.1212/wnl.58.5.750. [DOI] [PMC free article] [PubMed] [Google Scholar]
- Jack CR, Jr, Petersen RC, O’Brien PC, Tangalos EG. MR-based hippocampal volumetry in the diagnosis of Alzheimer’s disease. Neurology. 1992;42(1):183–188. doi: 10.1212/wnl.42.1.183. [DOI] [PubMed] [Google Scholar]
- Josephs KA, Tsuboi Y, Cookson N, Watt H, Dickson DW. Apolipoprotein E epsilon 4 is a determinant for Alzheimer-type pathologic features in tauopathies, synucleinopathies, and frontotemporal degeneration. Archives of Neurology. 2004;61(10):1579–1584. doi: 10.1001/archneur.61.10.1579. [DOI] [PubMed] [Google Scholar]
- Josephs KA, Whitwell JL, Duffy JR, Vanvoorst WA, Strand EA, Hu WT, et al. Progressive aphasia secondary to Alzheimer disease versus FTLD pathology. Neurology. 2008;70(1):25–34. doi: 10.1212/01.wnl.0000287073.12737.35. [DOI] [PMC free article] [PubMed] [Google Scholar]
- Jovicich J, Czanner S, Greve D, Haley E, van der Kouwe A, Gollub R, et al. Reliability in multi-site structural MRI studies: Effects of gradient nonlinearity correction on phantom and human data. Neuroimage. 2006;30(2):436–443. doi: 10.1016/j.neuroimage.2005.09.046. [DOI] [PubMed] [Google Scholar]
- Kertesz A, McMonagle P, Blair M, Davidson W, Munoz DG. The evolution and pathology of frontotemporal dementia. Brain. 2005;128(Pt 9):1996–2005. doi: 10.1093/brain/awh598. [DOI] [PubMed] [Google Scholar]
- Knibb JA, Xuereb JH, Patterson K, Hodges JR. Clinical and pathological characterization of progressive aphasia. Annals of Neurology. 2006;59(1):156–165. doi: 10.1002/ana.20700. [DOI] [PubMed] [Google Scholar]
- McKhann G, Drachman D, Folstein M, Katzman R, Price D, Stadlan EM. Clinical diagnosis of Alzheimer’s disease: Report of the NINCDS-ADRDA Work Group under the auspices of Department of Health and Human Services Task Force on Alzheimer’s Disease. Neurology. 1984;34(7):939–944. doi: 10.1212/wnl.34.7.939. [DOI] [PubMed] [Google Scholar]
- Mesulam MM. Primary progressive aphasia – differentiation from Alzheimer’s disease. Annals of Neurology. 1987;22(4):533–534. doi: 10.1002/ana.410220414. [DOI] [PubMed] [Google Scholar]
- Mesulam M, Wicklund A, Johnson N, Rogalski E, Leger GC, Rademaker A, et al. Alzheimer and frontotemporal pathology in subsets of primary progressive aphasia. Annals of Neurology. 2008;63(6):709–719. doi: 10.1002/ana.21388. [DOI] [PMC free article] [PubMed] [Google Scholar]
- Migliaccio R, Agosta F, Rascovsky K, Karydas A, Bonasera S, Rabinovici GD, et al. Clinical syndromes associated with posterior atrophy: Early age at onset AD spectrum. Neurology. 2009;73(19):1571–1578. doi: 10.1212/WNL.0b013e3181c0d427. [DOI] [PMC free article] [PubMed] [Google Scholar]
- Mirra SS, Heyman A, McKeel D, Sumi SM, Crain BJ, Brownlee LM, et al. The consortium to establish a registry for Alzheimer’s disease (CERAD): Part II. Standardization of the neuropathologic assessment of Alzheimer’s disease. Neurology. 1991;41(4):479–486. doi: 10.1212/wnl.41.4.479. [DOI] [PubMed] [Google Scholar]
- Petersen RC, Jack CR, Jr, Xu YC, Waring SC, O’Brien PC, et al. Memory and MRI-based hippocampal volumes in aging and AD. Neurology. 2000;54(3):581–587. doi: 10.1212/wnl.54.3.581. [DOI] [PubMed] [Google Scholar]
- Rogalski E, Cobia D, Harrison TM, Wieneke C, Weintraub S, Mesulam MM. Progression of language decline and cortical atrophy in subtypes of primary progressive aphasia. Neurology. 2011a;76(21):1804–1810. doi: 10.1212/WNL.0b013e31821ccd3c. [DOI] [PMC free article] [PubMed] [Google Scholar]
- Rogalski EJ, Rademaker A, Harrison TM, Helenowski I, Johnson N, Bigio E, et al. ApoE E4 is a susceptibility factor in amnestic but not aphasic dementias. Alzheimer Disease and Associated Disorders. 2011b;25(2):159–163. doi: 10.1097/WAD.0b013e318201f249. [DOI] [PMC free article] [PubMed] [Google Scholar]
- Rohrer JD, Ridgway GR, Crutch SJ, Hailstone J, Goll JC, Clarkson MJ, et al. Progressive logopenic/phonological aphasia: Erosion of the language network. Neuroimage. 2010;49(1):984–993. doi: 10.1016/j.neuroimage.2009.08.002. [DOI] [PMC free article] [PubMed] [Google Scholar]
- Saunders AM, Strittmatter WJ, Schmechel D, George-Hyslop PH, Pericak-Vance MA, Joo SH, et al. Association of apolipoprotein E allele epsilon 4 with late-onset familial and sporadic Alzheimer’s disease. Neurology. 1993;43(8):1467–1472. doi: 10.1212/wnl.43.8.1467. [DOI] [PubMed] [Google Scholar]
- Silbert LC, Quinn JF, Moore MM, Corbridge E, Ball MJ, Murdoch G, et al. Changes in premorbid brain volume predict Alzheimer’s disease pathology. Neurology. 2003;61(4):487–492. doi: 10.1212/01.wnl.0000079053.77227.14. [DOI] [PubMed] [Google Scholar]
- Sled JG, Zijdenbos AP, Evans AC. A nonparametric method for automatic correction of intensity nonuniformity in MRI data. IEEE Transactions on Medical Imaging. 1998;17(1):87–97. doi: 10.1109/42.668698. [DOI] [PubMed] [Google Scholar]
- Tzourio-Mazoyer N, Landeau B, Papathanassiou D, Crivello F, Etard O, Delcroix N, et al. Automated anatomical labeling of activations in SPM using a macroscopic anatomical parcellation of the MNI MRI single-subject brain. Neuroimage. 2002;15(1):273–289. doi: 10.1006/nimg.2001.0978. [DOI] [PubMed] [Google Scholar]
- Vemuri P, Gunter JL, Senjem ML, Whitwell JL, Kantarci K, Knopman DS, et al. Alzheimer’s disease diagnosis in individual subjects using structural MR images: Validation studies. Neuroimage. 2008;39(3):1186–1197. doi: 10.1016/j.neuroimage.2007.09.073. [DOI] [PMC free article] [PubMed] [Google Scholar]
- Whitwell JL, Dickson DW, Murray ME, Weigand SD, Tosakulwong N, Senjem ML, et al. Neuroimaging correlates of pathologically defined subtypes of Alzheimer’s disease: A case-control study. Lancet Neurol. 2012;11(10):868–877. doi: 10.1016/S1474-4422(12)70200-4. [DOI] [PMC free article] [PubMed] [Google Scholar]
- Whitwell JL, Jack CR, Jr, Przybelski SA, Parisi JE, Senjem ML, et al. Temporoparietal atrophy: A marker of AD pathology independent of clinical diagnosis. Neurobiology of Aging. 2009 doi: 10.1016/j.neurobiolaging.2009.10.012. [DOI] [PMC free article] [PubMed] [Google Scholar]
- Whitwell JL, Josephs KA, Murray ME, Kantarci K, Przybelski SA, Weigand SD, et al. MRI correlates of neurofibrillary tangle pathology at autopsy: A voxel-based morphometry study. Neurology. 2008;71(10):743–749. doi: 10.1212/01.wnl.0000324924.91351.7d. [DOI] [PMC free article] [PubMed] [Google Scholar]
- Zhang Y, Brady M, Smith S. Segmentation of brain MR images through a hidden Markov random field model and the expectation-maximization algorithm. IEEE Transactions on Medical Imaging. 2001;20(1):45–57. doi: 10.1109/42.906424. [DOI] [PubMed] [Google Scholar]