

Abstract
Asparaginase is an important drug in the treatment regimen for acute lymphoblastic leukemia. Asparaginase depletes circulating asparagine and glutamine, activating an amino acid stress response (AAR) involving phosphorylation of eukaryotic initiation factor 2 (eIF2) by general control nonderepressible kinase 2 (GCN2). We hypothesized that GCN2 functions to mitigate hepatic stress during asparaginase therapy by activating the AAR. To test this idea, C57BL/6J wild-type mice (Gcn2+/+) and those deleted for Gcn2 (Gcn2−/−) were injected with asparaginase or saline excipient one time daily for 1 or 6 days. In liver, increased phosphorylation of eIF2 and mRNA expression of AAR target genes activating transcription factor 4, asparagine synthetase, eIF4E-binding protein 1, and CAAT enhancer-binding protein homologous protein were significantly blunted or blocked in the liver of Gcn2−/− mice. Loss of AAR during asparaginase coincided with increases in mammalian target of rapamycin signaling, hepatic triglyceride accumulation, and DNA damage in association with genetic markers of oxidative stress (glutathione peroxidase) and inflammation (tumor necrosis factor alpha-α). Although asparaginase depleted circulating asparagine in both Gcn2+/+ and Gcn2−/− mice, all other amino acids, including plasma glutamine, were elevated in the plasma of Gcn2−/− mice. This study shows that loss of GCN2 promotes oxidative stress and inflammatory-mediated DNA damage during asparaginase therapy, suggesting that patients with reduced or dysfunctional AAR may be at risk of developing hepatic complications during asparaginase treatment.
Keywords: eukaryotic initiation factor 2, liver, steatosis, amino acid stress response, endoplasmic reticulum stress
acute lymphocytic leukemia (ALL), the most common childhood cancer, is caused by DNA alterations that lead to the overproduction of immature leukemic lymphoblasts from the bone marrow (43). Bacterial (Escherichia coli) l-asparaginase has been an essential component of the remission induction regimen to treat ALL since the 1960s (48). The efficacy of this therapy is dependent on the depletion of circulating asparagine, depriving tumor cells of an amino acid that it requires exogenously. While treatment success in ALL patients has significantly improved over the past two decades, the therapy retains a highly toxic profile (18). Among the major toxicities associated with asparaginase are hepatotoxicity (10, 20), thrombosis (1, 4, 31), immunosuppression (12, 14), and pancreatitis (30, 40). The underlying basis for these pathophysiologies and additional adverse metabolic events to asparaginase are still not well understood.
The general control nonderepressible kinase 2 (GCN2) is a member of a family of four eukaryotic initiation factor 2 (eIF2) kinases that become activated in response to diverse cellular stresses (56). Upon depletion for amino acids, GCN2 phosphorylates eIF2, lowering general protein synthesis to reduce energy expenditure. Accompanying this reduced translation, eIF2 phosphorylation facilitates the preferential expression of a collection of stress-related genes, such as activating transcription factor 4 (ATF4) (52, 62). Increased promoter binding by ATF4 and other trans-acting factors escalates the transcriptional expression of genes involved in amino acid metabolism, nutrient uptake, redox status, and cell cycle control in a pathway described as the integrated stress response (24, 25) or, alternatively, when specifically referring to amino acid depletion, the amino acid stress response (AAR) (8, 9). The translational and transcriptional gene expression directed by eIF2 phosphorylation helps the cell regain homeostasis or guide it toward death pathways if the underlying stress is unrecoverable. GCN2 functions as a sensor of amino acid levels by directly detecting the presence of deacylated or “uncharged” tRNA that accumulate during nutrient depletion (7, 23, 27, 62). Mice deleted for Gcn2 fail to phosphorylate eIF2 during dietary leucine starvation and develop fatty liver before becoming moribund (3, 21). Thus loss of GCN2 renders an organism less capable of adapting to a brief period of deprivation for dietary essential amino acids (60).
Cellular deprivation of amino acids is also sensed by the mammalian target of rapamycin complex 1 (mTORC1) signaling pathway (63). Phosphorylation of mTORC1 and its downstream effectors, ribosomal protein S6 kinase (S6K1) and eIF 4E-binding protein 1 (4E-BP1), function together to drive changes in translational efficiency and ribosomal capacity in response to amino acid availability (2, 17, 63). Notably, transcriptional expression of the translational inhibitor 4E-BP1 is enhanced by ATF4 (58), establishing a point of coordination between the eIF2 kinase and mTORC1 pathways during environmental stress. Deletion of Gcn2 disrupts the mTORC1 signaling network, altering phosphorylation of 4E-BP1 and S6K1 to conditions of amino acid deprivation (3, 13). How deletion of Gcn2 alters mTORC1 signaling and 4E-BP1 gene transcription during asparaginase is not well understood.
Previous work from our laboratory demonstrates that a single injection of asparaginase depletes asparagine and glutamine in the blood and liver of wild-type mice (44). In liver, increased phosphorylation of eIF2 and reduced phosphorylation of S6K1 and 4E-BP1 by asparaginase requires GCN2 (13). Nevertheless, long-term hepatic consequences of asparaginase treatment in the absence of GCN2 remain unclear. In the spleen, thymus, and bone marrow, the absence of GCN2 amplifies immunosuppression triggered by asparaginase therapy (12). Based on these observations, we hypothesized that mice deleted for Gcn2 would demonstrate greater hepatotoxicity following longer-term asparaginase treatment. Furthermore, based on the report by Hernandez-Espinosa and colleagues defining asparaginase as a “temporary conformational disease” (26), the potential of asparaginase to induce endoplasmic reticulum (ER) stress in the presence or absence of Gcn2 was investigated.
METHODS
Measurement of l-asparaginase activity.
The activity of asparaginase derived from E. coli (Elspar; Merck) was determined by the Nesslerization technique, as previously described (12, 44). Briefly, the production of ammonia by asparaginase over time was expressed relative to the slope of known ammonia standards. The resulting values represented the activity of the enzyme in international units (IU), in which one IU equaled the amount of enzyme that catalyzed the formation of 1 μmol of ammonia/min.
Animals.
Male and female Gcn2 knockout mice (backcrossed to C57BL/6J for 10 generations) and wild-type C57BL/6J control mice (Jackson Laboratories, Bar Harbor, ME) age 6–10 wk were housed in plastic cages with soft bedding with a 12:12-h light-dark cycle and given free access to commercial rodent chow (PMI International, Brentwood, MO) and water. All animal protocols were approved by the institutional animal care and use committees at the Indiana University School of Medicine-Evansville and at Rutgers, The State University of New Jersey.
Experimental procedure.
Mice from both genetic strains received once-daily intraperitoneal injections of either l-asparaginase (3 IU/g body wt) or an equivalent volume of phosphate-buffered saline (PBS) for 1 or 6 days. The daily dosage was based on an understanding that mice are more resistant to asparaginase because of a shorter half-life (3–7 h vs. ∼20 h in humans) (6, 11) in combination with our previous work showing 3 IU/g to increase eIF2 phosphorylation, whereas doses <2 IU/g do not (44). The experimental design resulted in four treatment groups: WP, C57BL/6J wild-type mice injected with PBS; WA, wild-type mice injected with asparaginase; GP, Gcn2 null mice injected with PBS; and GA, Gcn2 null mice injected with asparaginase. Previous experiments comparing heat-killed asparaginase with saline excipient alone established PBS as an appropriate control (12). Six hours after the final injection, mice were killed by decapitation, and trunk blood was collected to produce serum. Whole organs or tissues were rapidly dissected, rinsed in ice-cold PBS, blotted, and weighed. One portion was frozen immediately in liquid nitrogen, whereas a second portion was fixed in 4% paraformaldehyde. Circulating amino acid concentrations were measured in the sera of mice killed 12 h after the last injection of asparaginase. Serum samples were analyzed by the Indiana University School of Medicine Quantitative Amino Acid Core Facility as previously described (3).
Histology.
Tissues fixed in 4% paraformaldehyde were frozen and then sectioned (10 μm) using a cryostat. Terminal deoxynucleotidyl transferase dUTP nick end labeling (TUNEL) assays were performed using frozen sections and the Trevigen TACS 2 TdT-Blue Label In Situ Apoptosis Detection kit (R&D Systems, Minneapolis, MN). Digital images of equal-sized areas were captured and imported into Scion Image for Windows (Scion, Frederick, MD). TUNEL-positive cells were manually marked and counted using the counting tool as previously reported (50). Frozen sections were also stained with Oil Red O to visualize lipid content (50). Paraffin-embedded liver specimens were sectioned (6 μm) and stained with hematoxylin and eosin to visualize general histology and identify histopathological features under light microscopy.
Triglyceride measurements.
Triglycerides were measured from frozen liver tissue (∼40 mg) using the Biovision Colorimetric Triglyceride Quantification kit (Mountain View, CA) following to the manufacturer's instructions exactly as previously detailed (50).
Immunoblot analysis.
Weighed, frozen tissues were transferred to microfuge tubes on ice and homogenized in 7 volumes of solution consisting of 20 mM N-2-hydroxyethylpiperazine-N′-2-ethanesulfonic acid (pH 7.4), 100 mM KCl, 0.2 mM EDTA, 2 mM EGTA, 1 mM dithiothreitol, 50 mM sodium fluoride, 50 mM β-glycerophosphate, 0.1 mM phenylmethylsulfonyl fluoride, 1 mM benzamidine, and 0.5 mM sodium orthovanadate. The homogenates were immediately clarified by centrifugation at 10,000 g for 10 min at 4°C, and measurements of indicated protein levels and phosphorylation states were carried out as previously described (13). Phosphorylation of eIF2 was assessed using an antibody that recognizes the α-subunit only when it is phosphorylated at serine-51 (Cell Signaling Technology, Beverly, MA); results were normalized for total eIF2α levels with an antibody that recognizes the protein irrespective of phosphorylation state (Santa Cruz Biotechnology, Santa Cruz, CA). Phosphorylation of 4E-BP1 and S6K1 was measured using polyclonal antibodies specific to each (Bethyl, Montgomery, TX). Phosphorylation of mTOR at serine-2448 and Raptor at serine-473 was measured using polyclonal antibodies (Cell Signaling Technology); results were corrected for total protein expression with antibodies that recognize the protein irrespective of phosphorylation state (Cell Signaling Technology). Caspase-3 cleavage was evaluated by expressing the amount of the cleaved form as a ratio to the pro-version of caspase-3, using polyclonal antibodies (Cell Signaling Technology). Poly(ADP) ribose polymerase (PARP) Antibody was used to detect endogenous levels of full-length PARP1 (116 kDa), as well as the large fragment (89 kDa) of PARP1 resulting from caspase cleavage. The antibody does not cross-react with related proteins or other PARP isoforms (Cell Signaling Technology). Blots were developed with enhanced chemiluminesence (Amersham Biosciences). Protein expression was analyzed using a Carestream 4000MM multimodal imager, and band density was quantitated using Carestream Molecular Imaging Software (version 5.0).
Quantitative real-time PCR.
Total RNA was extracted from frozen tissue using TriReagent (Molecular Research Center, Cincinnati, OH) followed by DNase treatment (VersaGene DNase kit; Gentra Systems) (13). The A260/280 ratio was between 1.8 and 2.0 following RNA purification using the RNeasy mini kit (Qiagen). Levels of mRNAs were determined by quantitative PCR using TaqMan reagents. In this PCR assay, 1 μg of the purified RNA solutions was used for reverse transcription, which was carried out utilizing the High-Capacity cDNA Reverse Transcription Kit (Applied Biosystems, Foster City, CA). TaqMan Gene Expression Master Mix and TaqMan Gene Expression Assays (Applied Biosystems) were then used to conduct the quantitative PCR. Amplification and detection were performed using the StepOnePlus Real-Time PCR System (Applied Biosystems) (13). Each mRNA from a single biological sample was measured in triplicate and normalized to 18S ribosomal RNA. A subset of samples evaluated in parallel using β-actin as an additional internal control delivered similar results. Results were obtained by the comparative Ct method and are expressed as fold change with respect to the experimental control.
Statistics.
Experimental results were analyzed using SPSS Statistics software (IBM). Data were analyzed using two-way ANOVA to assess main vs. interaction effects, with drug treatment and mouse strain as independent variables. When main or interaction effects were significant, differences between individual treatment groups were assessed using the LSD post hoc test. The data presented are expressed as means ± SE. The level of significance was set at P < 0.05 for all statistical tests. No significant differences were found between sexes; therefore, data were combined for male and female mice.
RESULTS
Food intake, body and tissue weights, and circulating amino acids are impacted differently in wild-type vs. Gcn2 null mice treated with asparaginase.
We assessed the role of GCN2 in the mechanism by which asparaginase causes liver toxicity by injecting the drug into wild-type and Gcn2 null mice one time daily for 6 days and comparing outcomes with excipient-treated mice. Average body weights were similar at the start of the experiment (WP: 17.4 ± 1.3; WA: 18.2 ± 0.9; GP: 18.6 ± 0.9; and GA: 18.7 ± 0.7). Asparaginase treatment reduced body weight gain and liver mass (2-way ANOVA P < 0.05 main effect for drug) but not muscle mass (Table 1). These effects were amplified in GA mice who experienced an ∼14% loss in body weight relative to GP mice (Table 1). GA mice consumed significantly less food than other mice; differences in food intake explained a majority of the variance in body weight among mice (R2 = 0.51). Recent experiments in which WP and WA mice were pair-fed to the intake of GA mice for 8 days indicate that differences in body weights are reflected in the body fat, and the reduction in food intake does not aggravate liver toxicity by asparaginase (unpublished observations).
Table 1.
Food intake and body and tissue weights in wild-type and GCN2 null mice treated with asparaginase or PBS
| WP | WA | GP | GA | Strain | Treatment | Strain × Treatment | |
|---|---|---|---|---|---|---|---|
| Food intake, g/day | 3.06 ± 0.18A | 2.90 ± 0.10A | 3.01 ± 0.05A | 1.97 ± 0.18B | Yes | Yes | Yes |
| Body wt change, g | 0.58 ± 0.19A | −0.82 ± 0.38B | 0.28 ± 0.66A | −2.59 ± 0.45B | Yes | Yes | Yes |
| Body wt, %change | 3.22 ± 1.10A | −4.18 ± 2.13B | 1.44 ± 3.57A | −14.21 ± 2.70B | Yes | Yes | Yes |
| Liver wt, g | 0.91 ± 0.09 | 0.76 ± 0.02 | 1.18 ± 0.07 | 0.77 ± 0.05 | No | Yes | No |
| Liver wt, %body wt | 4.99 ± 0.12 | 4.42 ± 0.15 | 5.26 ± 0.23 | 4.47 ± 0.22 | No | Yes | No |
| Muscle wt, g | 0.18 ± 0.02 | 0.18 ± 0.01 | 0.16 ± 0.01 | 0.14 ± 0.01 | No | No | No |
| Muscle wt, %body wt | 0.97 ± 0.04 | 1.02 ± 0.04 | 0.92 ± 0.03 | 0.94 ± 0.02 | No | No | No |
Values are means ± SE; n = 5–8 mice/group. GCN2, general control nonderepressible kinase 2; yes, significant main effect P < 0.05; no, not significant P < 0.05; WP, wild-type mice given PBS; WA, wild-type mice given asparaginase; GP, Gcn2−/− mice given PBS; GA, Gcn2−/− mice given asparaginase. When significant effects were present, differences among treatment groups were assessed with LSD post hoc test. Labeled means without a common letter differ (P < 0.05, LSD post hoc test).
Circulating concentrations of amino acids were measured to confirm asparagine depletion by drug and to assess whole body amino acid metabolism (Table 2). As anticipated, plasma asparagine was decreased in both WA and GA following drug treatment to levels below the instrument detection threshold. However, plasma glutamine was not reduced in WA mice and was significantly elevated in drug-treated mice. In addition, circulating concentrations of most measured amino acids were highest in GA mice after 6 days of treatment.
Table 2.
| Amino acid | WP | WA | GP | GA | Strain | Treatment | Strain × Treatment |
|---|---|---|---|---|---|---|---|
| Asparagine | 30.9 ± 2.45 | BDL | 28.60 ± 4.77 | BDL | NA | NA | NA |
| Aspartic acid | 17.8 ± 1.54 | 39.50 ± 7.03 | 25.40 ± 4.77 | 30.68 ± 7.49 | No | Yes | No |
| Glutamine | 614.57 ± 28.64 | 682.20 ± 22.34 | 608.13 ± 38.31 | 904.17 ± 178.42 | No | Yes | No |
| Glutamic acid | 75.48 ± 3.96C | 118.24 ± 10.50B | 82.65 ± 5.31C | 207.18 ± 20.89A | Yes | Yes | Yes |
| Threonine | 165.88 ± 15.81B | 222.30 ± 25.49B | 170.47 ± 9.56B | 464.63 ± 51.72A | Yes | Yes | Yes |
| Serine | 115.20 ± 5.10B | 152.20 ± 12.02B | 116.52 ± 11.92B | 312.12 ± 57.26A | Yes | Yes | Yes |
| Glycine | 310.08 ± 18.59B | 403.16 ± 18.65A | 250.35 ± 17.93B | 462.28 ± 47.68A | No | Yes | Yes |
| Alanine | 353.93 ± 29.90B | 423.96 ± 43.80B | 356.87 ± 32.34B | 917.40 ± 126.85A | Yes | Yes | Yes |
| Valine | 256.57 ± 24.95B | 293.00 ± 35.70B | 277.43 ± 17.44B | 441.28 ± 36.13A | Yes | Yes | Yes |
| Methionine | 51.48 ± 3.56B | 61.44 ± 6.29B | 47.08 ± 3.01B | 108.78 ± 12.59A | Yes | Yes | Yes |
| Isoleucine | 81.62 ± 6.33B | 89.56 ± 9.00B | 84.43 ± 6.31B | 123.73 ± 10.03A | Yes | Yes | Yes |
| Leucine | 164.32 ± 13.93B | 185.54 ± 22.25B | 166.05 ± 13.82B | 265.60 ± 21.07A | Yes | Yes | Yes |
| Tryptophan | 205.37 ± 8.25 | 211.46 ± 10.93 | 227.8 ± 19.00 | 253.27 ± 17.44 | Yes | No | No |
| Lysine | 303.97 ± 34.58C | 394.60 ± 29.24B | 289.30 ± 17.31C | 528.50 ± 33.90A | Yes | Yes | Yes |
| Histidine | 87.65 ± 8.77 | 117.58 ± 7.88 | 111.42 ± 3.82 | 133.23 ± 16.90 | No | Yes | No |
| Arginine | 149.83 ± 15.40 | 187.90 ± 16.83 | 132.53 ± 12.61 | 230.68 ± 26.14 | No | Yes | No |
| Proline | 79.73 ± 8.52B | 107.86 ± 16.38B | 79.97 ± 10.32B | 195.78 ± 22.75A | Yes | Yes | Yes |
| Cystine | 3.88 ± 1.56 | 1.52 ± 0.16 | 8.78 ± 1.54 | 8.65 ± 3.90 | Yes | No | No |
Values are means ± SE, n = 5–8 mice/group.
Plasma amino acids expressed as μmol/l;
when a strain × treatment interaction was significant, differences among treatment groups were assessed with LSD post hoc test. Labeled means without a common letter differ (P < 0.05, LSD post hoc test). yes, Significant main effect P < 0.05; no, not significant P < 0.05; NA, not assessed; BDL, below detection limits.
Lipid accumulation and DNA damage are amplified in the livers of Gcn2 null mice treated with asparaginase.
To compare the histopathology resulting from asparaginase treatment in wild-type vs. Gcn2 knockout mice, fixed liver samples were sectioned and stained to examine neutral lipid content and general cellular structure using light microscopy. Hepatocytes from WA mice showed the presence of cytosolic vacuoles (Fig. 1A) and moderate Oil Red O staining (Fig. 1B, left), suggesting lipid accumulation. These histological features were also present in liver sections from GA mice, with GA liver sections showing greater numbers of vacuoles and darker Oil Red O staining accompanied by an ∼50% increase in triglyceride concentrations compared with WP mice (Fig. 1B, right). The appearance of swollen cells with fragmented or condensed nuclei in GA sections prompted us to investigate the presence of DNA damage. To address this, a TUNEL assay was performed on frozen liver sections to identify the presence of fragmented DNA. The number of TUNEL-positive nuclei (2-way ANOVA interaction P < 0.05) (Fig. 1C) was at least 2.5-fold greater in GA mice compared with wild-type mice treated with drug. Despite the presence of large numbers of TUNEL-positive nuclei in GA liver sections, activation of apoptosis via caspase-3 and PARP cleavage was not indicated (Fig. 2, H and I).
Fig. 1.

Lipid accumulation and DNA damage are amplified in the livers of general control nonderepressible kinase 2 (Gcn2) null mice treated with asparaginase for 6 days. A: paraffin-embedded liver sections (6 μm) were stained with hematoxylin and eosin, and images were taken using a ×20 objective to visualize general cellular structure. An additional digital ×2 zoom is provided in the top right corner of each image. B: neutral lipid content of liver was examined by Oil Red O stain, and images were captured using a ×20 objective (left). Liver triglyceride concentrations were also assessed biochemically (right). C: terminal deoxynucleotidyl transferase dUTP nick end labeling (TUNEL) analysis was carried out on frozen liver sections (10 μm), and digital images (left) captured using a ×20 objective were examined for DNA damage by counting TUNEL-positive nuclei in equal-sized fields of view (right). Values are means ± SE, n = 5–8 animals/group. Labeled means without a common letter differ (P < 0.05). WP, wild-type mice given PBS; WA, wild-type mice given asparaginase; GP, Gcn2 null mice given PBS; GA, Gcn2 null mice given asparaginase.
Fig. 2.
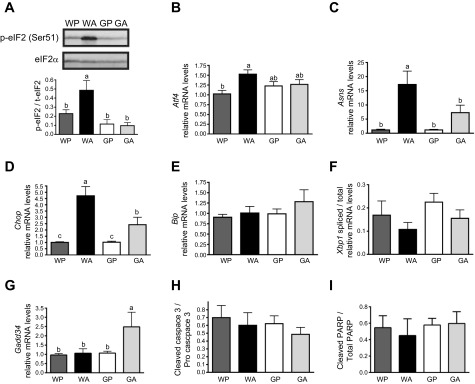
Asparaginase activates the GCN2-eukaryotic initiation factor 2 (eIF2)-amino acid stress response (AAR) pathway but not the unfolded protein response (UPR) in the liver. A: levels of phosphorylation of the α-subunit (serine-51) of eIF2 were measured by immunoblot analysis. Results shown beneath the representative immunoblot are expressed as the density of phosphorylated eIF2 relative to total levels of eIF2 α-subunit. B–F: quantitative real-time PCR was employed to measure mRNA expression of activating transcription factor 4 (Atf4, B), asparagine synthetase (Asns, C), CAAT enhancer-binding protein homologous protein (Chop, D), Bip (E), and Gadd34 (G). X box-binding protein 1 (Xbp1) mRNA splicing (F) was assessed by determining the amount of the spliced transcript relative to total Xbp1 mRNA levels as judged by qualitative PCR. H: cleavage of caspase-3 was assessed by immunoblot analysis with results representing the density of the cleaved form of caspase-3 relative to pro-caspase-3. I: cleavage of poly(ADP) ribose polymerase (PARP) was assessed by immunoblot analysis with results representing the density of the cleaved form of PARP relative to total PARP. Values are means ± SE, n = 5–8/group. Labeled means without a common letter differ (P < 0.05).
Asparaginase activates the GCN2-eIF2-AAR pathway, but not the unfolded protein response in liver.
AAR targets downstream of activated GCN2 were measured in the livers of wild-type and Gcn2 knockout mice treated with asparaginase. Phosphorylation at serine-51 on the α-subunit of eIF2 was sharply increased in WA mice compared with WP controls (Fig. 2A). While attempts to detect ATF4 protein in whole liver using commercial antibodies were not met with success, mRNA levels for Atf4 (Fig. 2B) and those for ATF4 target genes, asparagine synthetase (Asns) and CAAT enhancer-binding protein homologous protein (Chop), were collectively increased in WA compared with WP (Fig. 2, C and D). Loss of GCN2 precluded eIF2 phosphorylation (Fig. 2A) and blocked or significantly blunted mRNA expression of Atf4, Asns, and Chop to asparaginase (Fig. 2, B–D). The small but significant induction of Chop mRNA in GA is consistent with our previous work showing that a rapamycin-sensitive input contributes to Chop expression (13). Finally, another member of the AAR is GADD34, which functions in feedback dephosphorylation of eIF2 (16, 41). GADD34 has suggested proapoptotic function and was originally identified to be induced by DNA damage and can be a target gene of both the ATF4 and CHOP transcription factors in the AAR (28, 37, 39, 59). Whereas the levels of Gadd34 transcripts were not significantly affected in WA mice, there was ∼2.5-fold increase in GA livers at both 1 and 6 days (Fig. 2G and data not shown). These results support the idea that GCN2 is the primary eIF2 kinase that is activated upon chronic asparaginase therapy, and activation of GCN2 serves to reprogram gene expression to manage amino acid stress.
A disruption in ER homeostasis can lead to an accumulation of misfolded proteins in this organelle, which activates an adaptive pathway called the unfolded protein response (UPR) (38, 53). A sensor of unfolded proteins in the ER lumen is the type 1 ER transmembrane protein kinase called IRE1. Activation of IRE1 unleashes endoribonuclease activity that facilitates splicing of X box-binding protein 1 (Xbp1) mRNA. This unconventional splicing reaction produces a potent transcription factor that activates UPR genes important for recovery and adaptation to ER stress. The molecular chaperone BiP/GRP78 serves as another marker of ER stress, for its transcriptional expression is increased under conditions of accumulating misfolded proteins. Increased Xbp1 mRNA splicing and Bip mRNA expression is reported in the liver of mice treated with the ER stress agent tunicamycin (50). In contrast, no changes in Xbp1 mRNA splicing or Bip transcript levels were observed according to mouse strain or asparaginase treatment (Fig. 2, E and F). These results suggest that asparaginase treatment does not activate the UPR and that ER stress is not significantly involved in the development of hepatotoxicity in Gcn2 null mice.
GCN2 deletion alters mTORC1 signaling in the livers of asparaginase-treated mice.
Changes in signaling via the mTORC1 pathway were addressed to determine how asparaginase affected the other major amino acid-sensing pathway. In WA, there were no significant changes in phosphorylation of mTOR at serine-2448 (Fig. 3A) nor changes in the phosphorylation of the mTOR regulatory factor Raptor (data not shown), or the translational inhibitor and mTORC1 substrate 4E-BP1 (Fig. 3C). However, asparaginase treatment significantly increased phosphorylation of the mTORC1 target S6K1 independent of GCN2 status (2-way ANOVA P < 0.05 main effect for treatment) and both serine-2448 phosphorylation of mTORC1 and S6K1 phosphorylation tended to be highest in GA (Fig. 3B). On the other hand, the levels of total 4E-BP1 mRNA and protein were significantly increased by asparaginase (Fig. 3C), an effect that was GCN2-dependent.
Fig. 3.

Asparaginase activates mammalian target of rapamycin complex 1 (mTORC1) signaling in the livers of Gcn2 null mice. A: immunoblot analysis was used to assess phosphorylation of mTOR at serine-2448. A representative immunoblot is shown above data averages. B: phosphorylation of ribosomal protein S6 kinase (S6K1) was assessed by gel shift, calculating the density of the slower-migrating form(s) relative to all bands combined. A representative immunoblot is shown above data averages. C: immunoblot analysis was used to assess eIF-4E-binding protein 1 (4E-BP1) protein expression (top), and quantitative real-time PCR was employed to examine mRNA expression of 4E-BP1 (bottom). Values are means ± SE, n = 5–8/group. Labeled means without a common letter differ (P < 0.05).
Activation of mTORC1 signaling is associated with inhibition of autophagy. However, no changes were identified in mRNA expression of two important regulators of autophagy, LC3B and p62 (data not shown). Regulation of the ubiquitin-proteosome pathways was also examined. No changes in mRNA expression of Psma2, a component of the 20S catalytic subunit of the proteasome, or in mRNA expression of the E3 ubiquitin ligase called Atrogen1 were noted across experimental treatment groups (data not shown).
GCN2 deletion compromises oxidative defenses during asparaginase, promoting inflammatory stress.
The antioxidant function of eIF2 phosphorylation and a tight linkage between ATF4 and cellular oxidative defenses is reported (24, 36). As such, we measured the impact of asparagainse on oxidative defense genes superoxide dismutase (Sod2) and glutathione peroxidase (Gpx1) in the presence vs. absence of Gcn2. Expression of Sod2 was increased approximately twofold in GA but not WA livers at 1 and 6 days (Fig. 4, A and B). Likewise, the levels of Gpx1 mRNA, encoding one of the most important endogenous antioxidants, was increased in GA livers at 1 day (∼2-fold increase) and then significantly decreased relative to control at 6 days (∼3-fold decrease) (Fig. 4, C and D). Collectively, these results suggest that Gcn2 deletion compromises oxidative defenses during asparaginase treatment.
Fig. 4.

Asparaginase increases markers of oxidative damage and inflammation after one and six daily injections. Quantitative real-time PCR was employed to examine mRNA expression of superoxide dismutase (Sod2, A and B), glutathione peroxidase (Gpx1, C and D), and Tnf-α (E and F) after 1 (left) and 6 (right) days of injections with asparaginase or PBS. Values are means ± SE, n = 5–8/group. Labeled means without a common letter differ (P < 0.05).
Given that oxidative stress can promote chronic inflammation, mRNA expression of the proinflammatory cytokine Tnf-α was examined in the livers of wild-type and Gcn2 null mice treated with asparaginase (Fig. 4, E and F). In the liver of GA mice, a small increase in levels of Tnf-α mRNA following one injection (∼3-fold) preceded much larger increases (∼8 fold) in liver following 6 days of injections. These data are consistent with the idea that, during asparaginase treatment, deletion of Gcn2 predisposes the liver toward DNA damage via oxidative stress and inflammation.
DISCUSSION
This study demonstrates that GCN2 is critically important in the ability of the liver to limit toxicity by asparaginase. Livers from mice deleted for Gcn2 display inflammation, steatosis, and degeneration following drug treatment. By comparison, each of these outcomes was not present or was significantly mitigated in wild-type mice treated with asparaginase, suggesting that the GCN2-eIF2-AAR pathway serves to protect the liver during asparaginase treatment.
Gcn2 null mice treated with asparaginase demonstrate increased DNA damage in the liver, indicating activation of cell death pathways. However, the absence of caspase-3 and PARP cleavage suggests that the classical form of apoptosis is not triggered at this point in time. Perhaps additional treatment days would induce this pathway; alternatively, a caspase-independent death pathway, such as autophagy/mitophagy, oncosis, paraptosis, or necrosis (34, 35, 55), may be activated. Cell death without caspase activation is not uncommon, particularly with chemotherapy drugs. For example, TNF-α-mediated liver injury by concanavalin A reportedly follows a caspase-3-independent necrotic path (33). Considering the increase in Tnf-α occurred alongside no indication that autophagy, proteasome activity, and/or the UPR are induced, a necrotic form of programmed cell death appears reasonable. Nonetheless, extending the time period of asparaginase treatment to clarify this point is warranted.
Previously we reported that the lowered liver protein synthesis in mice subjected to amino acid deprivation is substantially alleviated upon deletion of Gcn2 (3). In this study, both the AAR and the mTORC1 pathways in the liver of Gcn2 null mice treated with asparaginase reflect a pattern of signaling and gene expression that is consistent with a restoration of liver protein synthesis. A premature restoration in protein synthesis can direct cell fate toward cell death pathways during ER stress (22, 39). Overexpression of ATF4 and CHOP in mouse liver or overexpression of GADD34 in mouse embryonic fibroblasts increases protein synthesis but reduces survival via increased production of reactive oxygen species (22). In the current study, increased expression of the eIF2 phosphatase GADD34 alongside increased mTOR-S6K1 signaling would promote protein synthesis inappropriately. Reduced transcription of the translational inhibitor 4E-BP1, critical to cell survival during ER stress (51, 58), would further allow for translation initiation to continue, generating reactive oxygen species. The ability of the cell to detoxify these damaging agents depends on appropriate expression of antioxidant genes such as Sod2 and Gpx1. Interestingly, Gcn2 knockout mice fed a leucine-imbalanced diet demonstrate a decrease in hepatic Gpx1 mRNA expression (15), similar to Gcn2 null mice treated with asparaginase in the current study. Collectively, these data support the concept that the GCN2-eIF2-AAR is an important regulator of cellular redox state and that a chronic imbalance in oxidative defenses during asparaginase treatment may facilitate inflammatory-mediated death pathways in the liver.
In our previous studies, a single injection of E. coli asparaginase significantly reduces circulating and hepatic concentrations of glutamine alongside liver protein synthesis rates (44). In the present study, depletion of circulating glutamine is not sustained, suggesting that glutamine synthesis is increased. Furthermore, circulating concentrations of glutamine are highest in Gcn2 null mice treated with asparaginase. These data lead us to speculate that individuals with a defect in the AAR pathway could be at greater risk of drug resistance along with increased drug toxicity if the defect promotes glutamine synthesis. Two lines of evidence provide support for this thought. The first is a report demonstrating that obese children treated with asparaginase have greater rates of drug resistance and relapse because of bone marrow adipocytes releasing more glutamine via glutamine synthetase induction (19). The implication is that factors that increase glutamine availability thwart asparaginase efficacy. Certainly our lab and others demonstrate that glutamine availability benefits healthy tissues (14, 42, 44). However, this concept must be considered on balance with a need for glutamine depletion to achieve optimal tumor-killing. The second line of evidence is a human study linking ALL treatment outcome to polymorphisms in the ATF5 gene that regulate its promoter activity and expression (47). ATF5 is both a target of ATF4-directed transcription and is also subject to translational control in response to eIF2 phosphorylation (7, 61). The impact of ATF5 polymorphisms on glutamine and asparagine synthesis is unknown. As shown in this study as well as others, induction of Asns following asparaginase is an AAR-driven response (32, 45, 49). Less is known concerning glutamine synthetase expression or activity in response to asparaginase in vivo. Protein but not mRNA expression of glutamine synthetase is increased in liver and muscle cells incubated in the absence of glutamine (29, 54), whereas enzyme activity is minimally impacted (57). In tumor cells, glutamine synthetase activity can be increased by asparaginase, leading to drug resistance (5, 46). How whole body glutamine metabolism is regulated by the GCN2-mediated AAR requires further study.
Aside from reducing serum asparagine, asparaginase tended to increase circulating concentrations of most amino acids and, similar to dietary leucine deprivation, Gcn2 null mice treated with asparaginase showed significantly increased circulating essential amino acids (3). The reason for these changes is unknown, although increased muscle breakdown seems unlikely, since muscle mass stayed in proportion to body weight. Higher liver protein turnover was also postulated, but investigation into markers of protein degradation reflecting the ubiquitin proteasome pathway (PSMA2 and atrogin1) and the lysosomal pathway (LC3B) revealed no differences in gene expression according to drug treatment or GCN2 status. Although we do not yet understand the basis for elevations in circulating amino acids, we speculate that these increases provide an anabolic signal via mTORC1, and this in combination with Gcn2 deletion inappropriately elevates liver protein synthesis. Previous studies suggest that premature activation of protein synthesis promotes cell death pathways through increased production of reactive oxygen species (22, 39). Our results showing altered antioxidant genes, proinflammatory cytokine induction, and DNA damage are consistent with the idea that an inability to dampen protein synthesis during amino acid stress alters cellular redox conditions unfavorably and leads to cell damage via inflammatory stress (Fig. 5).
Fig. 5.

The GCN2-initiated AAR promotes liver recovery during asparaginase treatment. The current working model shows that, in the absence of GCN2, both a premature restoration of protein synthesis alongside a failure to induce gene transcription by ATF4 alters the cellular redox environment, favoring a proinflammatory state and facilitating DNA damage and cell death.
In summary, mice deficient in Gcn2 are unable to induce the AAR and suffer a greater degree of hepatotoxicity when given asparaginase. An important topic for future studies is addressing the incidence and influence of genetic polymorphisms that affect the efficacy of the GCN2-AAR pathway during asparaginase treatment. A more complete understanding of the AAR response to asparaginase may facilitate the development of a more targeted treatment regimen for patients diagnosed with ALL.
GRANTS
This work was supported in part by National Institutes of Health Grants HD-070487 (T. G. Anthony) and GM-49164 (R. C. Wek) and by the American Institute for Cancer Research (T. G. Anthony).
DISCLOSURES
No conflicts of interest, financial or otherwise, are declared by the authors.
AUTHOR CONTRIBUTIONS
Author contributions: G.J.W., P.B., J.K.C., and T.G.A. performed experiments; G.J.W., P.B., J.K.C., and T.G.A. analyzed data; G.J.W. and T.G.A. prepared figures; G.J.W. and T.G.A. drafted manuscript; G.J.W., R.C.W., and T.G.A. edited and revised manuscript; G.J.W., P.B., J.K.C., R.C.W., and T.G.A. approved final version of manuscript; R.C.W. and T.G.A. interpreted results of experiments; T.G.A. conception and design of research.
ACKNOWLEDGMENTS
We acknowledge technical assistance by Todd Capes, Lauren Fultz, Kacie Gayheart, Rachel Reinert, Kendall Stocke, and Dr. Ed Leichty at the Amino Acid Core Facility at the Indiana University School of Medicine. We further acknowledge scientific support by Dr. Carla Aldrich and helpful histopathology evaluation by Dr. Rodney Porro.
REFERENCES
- 1.Alberts SR, Bretscher M, Wiltsie JC, O'Neill BP, Mokri B, Witzig TE. Thrombosis related to the use of L-asparaginase in adults with acute lymphoblastic leukemia: a need to consider coagulation monitoring and clotting factor replacement. Leuk Lymphoma 32: 489–496, 1999 [DOI] [PubMed] [Google Scholar]
- 2.Anthony T, Reiter A, Anthony J, Kimball S, Jefferson L. Deficiency of dietary EAA preferentially inhibits mRNA translation of ribosomal proteins in liver of meal-fed rats. Am J Physiol Endocrinol Metab 281: E430–E439, 2001 [DOI] [PubMed] [Google Scholar]
- 3.Anthony TG, McDaniel BJ, Byerley RL, McGrath BC, Cavener DR, McNurlan MA, Wek RC. Preservation of liver protein synthesis during dietary leucine deprivation occurs at the expense of skeletal muscle mass in mice deleted for eIF2 kinase GCN2. J Biol Chem 279: 36553–36561, 2004 [DOI] [PubMed] [Google Scholar]
- 4.Appel IM, Hop WC, van Kessel-Bakvis C, Stigter R, Pieters R. L-Asparaginase and the effect of age on coagulation and fibrinolysis in childhood acute lymphoblastic leukemia. Thromb Haemost 100: 330–337, 2008 [PubMed] [Google Scholar]
- 5.Aslanian AM, Kilberg MS. Multiple adaptive mechanisms affect asparagine synthetase substrate availability in asparaginase-resistant MOLT-4 human leukaemia cells. Biochem J 358: 59–67, 2001 [DOI] [PMC free article] [PubMed] [Google Scholar]
- 6.Baechtel S, Prager MD. Basis for loss of therapeutic effectiveness of L-asparaginase in sensitized mice. Cancer Res 33: 1966–1969, 1973 [PubMed] [Google Scholar]
- 7.Baird TD, Wek RC. Eukaryotic initiation factor 2 phosphorylation and translational control in metabolism. Adv Nutr 3: 307–321, 2012 [DOI] [PMC free article] [PubMed] [Google Scholar]
- 8.Balasubramanian MN, Butterworth EA, Kilberg MS. Asparagine synthetase: regulation by cell stress and involvement in tumor biology. Am J Physiol Endocrinol Metab 304: E789–E799, 2013 [DOI] [PMC free article] [PubMed] [Google Scholar]
- 9.Barbosa-Tessmann IP, Chen C, Zhong C, Siu F, Schuster SM, Nick HS, Kilberg MS. Activation of the human asparagine synthetase gene by the amino acid response and the endoplasmic reticulum stress response pathways occurs by common genomic elements. J Biol Chem 275: 26976–26985, 2000 [DOI] [PubMed] [Google Scholar]
- 10.Bodmer M, Sulz M, Stadlmann S, Droll A, Terracciano L, Krahenbuhl S. Fatal liver failure in an adult patient with acute lymphoblastic leukemia following treatment with L-asparaginase. Digestion 74: 28–32, 2006 [DOI] [PubMed] [Google Scholar]
- 11.Broome J. Studies on the mechanism of tumor inhibition by L-asparaginase. J Exp Med 127: 1055–1072, 1968 [DOI] [PMC free article] [PubMed] [Google Scholar]
- 12.Bunpo P, Cundiff JK, Reinert RB, Wek RC, Aldrich CJ, Anthony TG. The eIF2 kinase GCN2 is essential for the murine immune system to adapt to amino acid deprivation by asparaginase. J Nutr 140: 2020–2027, 2010 [DOI] [PMC free article] [PubMed] [Google Scholar]
- 13.Bunpo P, Dudley A, Cundiff JK, Cavener DR, Wek RC, Anthony TG. GCN2 protein kinase is required to activate amino acid deprivation responses in mice treated with the anti-cancer agent L-asparaginase. J Biol Chem 284: 32742–32749, 2009 [DOI] [PMC free article] [PubMed] [Google Scholar]
- 14.Bunpo P, Murray B, Cundiff J, Brizius E, Aldrich CJ, Anthony TG. Alanyl-glutamine consumption modifies the suppressive effect of L-asparaginase on lymphocyte populations in mice. J Nutr 138: 338–343, 2008 [DOI] [PubMed] [Google Scholar]
- 15.Chaveroux C, Lambert-Langlais S, Parry L, Carraro V, Jousse C, Maurin AC, Bruhat A, Marceau G, Sapin V, Averous J, Fafournoux P. Identification of GCN2 as new redox regulator for oxidative stress prevention in vivo. Biochem Biophys Res Commun 415: 120–124, 2011 [DOI] [PubMed] [Google Scholar]
- 16.Connor JH, Weiser DC, Li S, Hallenbeck JM, Shenolikar S. Growth arrest and DNA damage-inducible protein GADD34 assembles a novel signaling complex containing protein phosphatase 1 and inhibitor 1. Mol Cell Biol 21: 6841–6850, 2001 [DOI] [PMC free article] [PubMed] [Google Scholar]
- 17.Dennis MD, Baum JI, Kimball SR, Jefferson LS. Mechanisms involved in the coordinate regulation of mTORC1 by insulin and amino acids. J Biol Chem 286: 8287–8296, 2011 [DOI] [PMC free article] [PubMed] [Google Scholar]
- 18.Earl M. Incidence and management of asparaginase-associated adverse events in patients with acute lymphoblastic leukemia. Clin Adv Hematol Oncol 7: 600–606, 2009 [PubMed] [Google Scholar]
- 19.Ehsanipour EA, Sheng X, Behan JW, Wang X, Butturini A, Avramis VI, Mittelman SD. Adipocytes cause leukemia cell resistance to L-asparaginase via release of glutamine. Cancer Res 73: 2998–3006, 2013 [DOI] [PMC free article] [PubMed] [Google Scholar]
- 20.Gross MA, Speer RJ, Hill JM. Hepatic lipidosis associated with L-asparaginase treatment. Proc Soc Exp Biol Med 130: 733–736, 1969 [DOI] [PubMed] [Google Scholar]
- 21.Guo F, Cavener DR. The GCN2 eIF2alpha kinase regulates fatty-acid homeostasis in the liver during deprivation of an essential amino acid. Cell Metab 5: 1–12, 2007 [DOI] [PubMed] [Google Scholar]
- 22.Han J, Back SH, Hur J, Lin YH, Gildersleeve R, Shan J, Yuan CL, Krokowski D, Wang S, Hatzoglou M, Kilberg MS, Sartor MA, Kaufman RJ. ER-stress-induced transcriptional regulation increases protein synthesis leading to cell death. Nat Cell Biol 15: 481–490, 2013 [DOI] [PMC free article] [PubMed] [Google Scholar]
- 23.Hao S, Sharp JW, Ross-Inta CM, McDaniel BJ, Anthony TG, Wek RC, Cavener DR, McGrath BC, Rudell JB, Koehnle TJ, Gietzen DW. Uncharged tRNA and sensing of amino acid deficiency in mammalian piriform cortex. Science 307: 1776–1778, 2005 [DOI] [PubMed] [Google Scholar]
- 24.Harding HP, Novoa I, Zhang Y, Zeng H, Wek R, Schapira M, Ron D. Regulated translation initiation controls stress-induced gene expression in mammalian cells. Mol Cell 6: 1099–1108, 2000 [DOI] [PubMed] [Google Scholar]
- 25.Harding HP, Zhang Y, Zeng H, Novoa I, Lu PD, Calfon M, Sadri N, Yun C, Popko B, Paules R, Stojdl DF, Bell JC, Hettmann T, Leiden JM, Ron D. An integrated stress response regulates amino acid metabolism and resistance to oxidative stress. Mol Cell 11: 619–633, 2003 [DOI] [PubMed] [Google Scholar]
- 26.Hernandez-Espinosa D, Minano A, Martinez C, Perez-Ceballos E, Heras I, Fuster JL, Vicente V, Corral J. L-asparaginase-induced antithrombin type I deficiency: implications for conformational diseases. Am J Pathol 169: 142–153, 2006 [DOI] [PMC free article] [PubMed] [Google Scholar]
- 27.Hinnebusch AG. Translational regulation of GCN4 and the general amino acid control of yeast. Annu Rev Microbiol 59: 407–450, 2005 [DOI] [PubMed] [Google Scholar]
- 28.Hollander MC, Zhan Q, Bae I, Fornace AJ., Jr Mammalian GADD34, an apoptosis- and DNA damage-inducible gene. J Biol Chem 272: 13731–13737, 1997 [DOI] [PubMed] [Google Scholar]
- 29.Huang YF, Wang Y, Watford M. Glutamine directly downregulates glutamine synthetase protein levels in mouse C2C12 skeletal muscle myotubes. J Nutr 137: 1357–1362, 2007 [DOI] [PubMed] [Google Scholar]
- 30.Kearney SL, Dahlberg SE, Levy DE, Voss SD, Sallan SE, Silverman LB. Clinical course and outcome in children with acute lymphoblastic leukemia and asparaginase-associated pancreatitis. Pediatr Blood Cancer 53: 162–167, 2009 [DOI] [PMC free article] [PubMed] [Google Scholar]
- 31.Kieslich M, Porto L, Lanfermann H, Jacobi G, Schwabe D, Bohles H. Cerebrovascular complications of L-asparaginase in the therapy of acute lymphoblastic leukemia. J Pediatr Hematol Oncol 25: 484–487, 2003 [DOI] [PubMed] [Google Scholar]
- 32.Kilberg MS, Shan J, Su N. ATF4-dependent transcription mediates signaling of amino acid limitation. Trends Endocrinol Metab 20: 436–443, 2009 [DOI] [PMC free article] [PubMed] [Google Scholar]
- 33.Kunstle G, Hentze H, Germann PG, Tiegs G, Meergans T, Wendel A. Concanavalin A hepatotoxicity in mice: tumor necrosis factor-mediated organ failure independent of caspase-3-like protease activation. Hepatology 30: 1241–1251, 1999 [DOI] [PubMed] [Google Scholar]
- 34.Lee J, Giordano S, Zhang J. Autophagy, mitochondria and oxidative stress: cross-talk and redox signalling. Biochem J 441: 523–540, 2012 [DOI] [PMC free article] [PubMed] [Google Scholar]
- 35.Leist M, Jaattela M. Four deaths and a funeral: from caspases to alternative mechanisms. Nat Rev Mol Cell Biol 2: 589–598, 2001 [DOI] [PubMed] [Google Scholar]
- 36.Lewerenz J, Maher P. Basal levels of eIF2alpha phosphorylation determine cellular antioxidant status by regulating ATF4 and xCT expression. J Biol Chem 284: 1106–1115, 2009 [DOI] [PMC free article] [PubMed] [Google Scholar]
- 37.Ma Y, Hendershot LM. Delineation of a negative feedback regulatory loop that controls protein translation during endoplasmic reticulum stress. J Biol Chem 278: 34864–34873, 2003 [DOI] [PubMed] [Google Scholar]
- 38.Malhi H, Kaufman RJ. Endoplasmic reticulum stress in liver disease. J Hepatol 54: 795–809, 2011 [DOI] [PMC free article] [PubMed] [Google Scholar]
- 39.Marciniak SJ, Yun CY, Oyadomari S, Novoa I, Zhang Y, Jungreis R, Nagata K, Harding HP, Ron D. CHOP induces death by promoting protein synthesis and oxidation in the stressed endoplasmic reticulum. Genes Dev 18: 3066–3077, 2004 [DOI] [PMC free article] [PubMed] [Google Scholar]
- 40.Minowa K, Suzuki M, Fujimura J, Saito M, Koh K, Kikuchi A, Hanada R, Shimizu T. L-asparaginase-induced pancreatic injury is associated with an imbalance in plasma amino acid levels. Drugs in R&D 12: 49–55, 2012 [DOI] [PMC free article] [PubMed] [Google Scholar]
- 41.Novoa I, Zeng H, Harding HP, Ron D. Feedback inhibition of the unfolded protein response by GADD34-mediated dephosphorylation of eIF2alpha. J Cell Biol 153: 1011–1022, 2001 [DOI] [PMC free article] [PubMed] [Google Scholar]
- 42.Ollenschlager G, Roth E, Linkesch W, Jansen S, Simmel A, Modder B. Asparaginase-induced derangements of glutamine metabolism: the pathogenetic basis for some drug-related side-effects. Eur J Clin Invest 18: 512–516, 1988 [DOI] [PubMed] [Google Scholar]
- 43.Pui CH, Evans WE. Treatment of acute lymphoblastic leukemia. N Engl J Med 354: 166–178, 2006 [DOI] [PubMed] [Google Scholar]
- 44.Reinert RB, Oberle LM, Wek SA, Bunpo P, Wang XP, Mileva I, Goodwin LO, Aldrich CJ, Durden DL, McNurlan MA, Wek RC, Anthony TG. Role of glutamine depletion in directing tissue-specific nutrient stress responses to L-asparaginase. J Biol Chem 281: 31222–31233, 2006 [DOI] [PubMed] [Google Scholar]
- 45.Richards NG, Kilberg MS. Asparagine synthetase chemotherapy. Annu Rev Biochem 75: 629–654, 2006 [DOI] [PMC free article] [PubMed] [Google Scholar]
- 46.Rotoli BM, Uggeri J, Dall'Asta V, Visigalli R, Barilli A, Gatti R, Orlandini G, Gazzola GC, Bussolati O. Inhibition of glutamine synthetase triggers apoptosis in asparaginase-resistant cells. Cell Physiol Biochem 15: 281–292, 2005 [DOI] [PubMed] [Google Scholar]
- 47.Rousseau J, Gagne V, Labuda M, Beaubois C, Sinnett D, Laverdiere C, Moghrabi A, Sallan SE, Silverman LB, Neuberg D, Kutok JL, Krajinovic M. ATF5 polymorphisms influence ATF function and response to treatment in children with childhood acute lymphoblastic leukemia. Blood 118: 5883–5890, 2011 [DOI] [PMC free article] [PubMed] [Google Scholar]
- 48.Schwartz J, Reeves J, Broome J. Two L-asparaginases from E. coli and their action against tumors Proc Natl Acad Sci USA 56: 1516–1519, 1966 [DOI] [PMC free article] [PubMed] [Google Scholar]
- 49.Su N, Pan YX, Zhou M, Harvey RC, Hunger SP, Kilberg MS. Correlation between asparaginase sensitivity and asparagine synthetase protein content, but not mRNA, in acute lymphoblastic leukemia cell lines. Pediatr Blood Cancer 50: 274–279, 2008 [DOI] [PMC free article] [PubMed] [Google Scholar]
- 50.Teske BF, Wek SA, Bunpo P, Cundiff JK, McClintick JN, Anthony TG, Wek RC. The eIF2 kinase PERK and the integrated stress response facilitate activation of ATF6 during endoplasmic reticulum stress. Mol Biol Cell 22: 4390–4405, 2011 [DOI] [PMC free article] [PubMed] [Google Scholar]
- 51.Tominaga R, Yamaguchi S, Satake C, Usui M, Tanji Y, Kondo K, Katagiri H, Oka Y, Ishihara H. The JNK pathway modulates expression and phosphorylation of 4E-BP1 in MIN6 pancreatic beta-cells under oxidative stress conditions. Cell Biochem Funct 28: 387–393, 2010 [DOI] [PubMed] [Google Scholar]
- 52.Vattem KM, Wek RC. Reinitiation involving upstream ORFs regulates ATF4 mRNA translation in mammalian cells. Proc Natl Acad Sci USA 101: 11269–11274, 2004 [DOI] [PMC free article] [PubMed] [Google Scholar]
- 53.Walter P, Ron D. The unfolded protein response: from stress pathway to homeostatic regulation. Science 334: 1081–1086, 2011 [DOI] [PubMed] [Google Scholar]
- 54.Wang Y, Watford M. Glutamine, insulin and glucocorticoids regulate glutamine synthetase expression in C2C12 myotubes, Hep G2 hepatoma cells and 3T3 L1 adipocytes. Biochim Biophys Acta 1770: 594–600, 2007 [DOI] [PMC free article] [PubMed] [Google Scholar]
- 55.Weerasinghe P, Buja LM. Oncosis: an important non-apoptotic mode of cell death. Exp Mol Pathol 93: 302–308, 2012 [DOI] [PubMed] [Google Scholar]
- 56.Wek RC, Jiang HY, Anthony TG. Coping with stress: eIF2 kinases and translational control. Biochem Soc Trans 34: 7–11, 2006 [DOI] [PubMed] [Google Scholar]
- 57.Wu C. Glutamine synthetase I. Its formation in rat liver following partial hepatectomy and during repletion. Arch Biochem Biophys 106: 402–409, 1964 [DOI] [PubMed] [Google Scholar]
- 58.Yamaguchi S, Ishihara H, Yamada T, Tamura A, Usui M, Tominaga R, Munakata Y, Satake C, Katagiri H, Tashiro F, Aburatani H, Tsukiyama-Kohara K, Miyazaki J, Sonenberg N, Oka Y. ATF4-mediated induction of 4E-BP1 contributes to pancreatic beta cell survival under endoplasmic reticulum stress. Cell Metab 7: 269–276, 2008 [DOI] [PubMed] [Google Scholar]
- 59.Zhan Q, Lord KA, Alamo I, Jr, Hollander MC, Carrier F, Ron D, Kohn KW, Hoffman B, Liebermann DA, Fornace AJ., Jr The gadd and MyD genes define a novel set of mammalian genes encoding acidic proteins that synergistically suppress cell growth. Mol Cell Biol 14: 2361–2371, 1994 [DOI] [PMC free article] [PubMed] [Google Scholar]
- 60.Zhang P, McGrath BC, Reinert J, Olsen DS, Lei L, Gill S, Wek SA, Vattem KM, Wek RC, Kimball SR, Jefferson LS, Cavener DR. The GCN2 eIF2alpha kinase is required for adaptation to amino acid deprivation in mice. Mol Cell Biol 22: 6681–6688, 2002 [DOI] [PMC free article] [PubMed] [Google Scholar]
- 61.Zhou D, Palam LR, Jiang L, Narasimhan J, Staschke KA, Wek RC. Phosphorylation of eIF2 directs ATF5 translational control in response to diverse stress conditions. J Biol Chem 283: 7064–7073, 2008 [DOI] [PubMed] [Google Scholar]
- 62.Zhu S, Wek RC. Ribosome-binding domain of eukaryotic initiation factor-2 kinase GCN2 facilitates translation control. J Biol Chem 273: 1808–1814, 1998 [DOI] [PubMed] [Google Scholar]
- 63.Zoncu R, Efeyan A, Sabatini DM. mTOR: from growth signal integration to cancer, diabetes and ageing. Nat Rev Mol Cell Biol 12: 21–35, 2011 [DOI] [PMC free article] [PubMed] [Google Scholar]