Abstract
The liver is an essential metabolic organ. In addition to metabolizing glucose and lipids, hepatocytes also secrete various cytokines that modulate both hepatocyte metabolism and liver inflammation. Hepatocyte injury and death and liver inflammation are the major contributors to liver diseases, including nonalcoholic steatohepatitis (NASH). Anatomic locations have a profound effect on hepatocyte metabolism, and liver zonation describes the metabolic heterogeneity of hepatocytes along the portovenous axis. However, it is unclear whether hepatocyte heterogeneity is affected by intrinsic factors and whether dietary fat, a risk factor for NASH, has distinct detrimental effects on different hepatocyte subpopulations. Here, we showed that mouse livers contained both high-lipid and low-lipid subpopulations of hepatocytes. The high-lipid subpopulation was more susceptible to injury and apoptosis and produced more proinflamatrory cytokines after treatment with endotoxin and saturated fatty acids. Dietary fat consumption further increased fatty acid uptake, intracellular lipid levels, hepatocyte injury and death, and the expression of proinflammatory cytokines in the high-lipid subpopulation. In contrast, dietary fat slightly increased lipid levels, cell death, and expression of proinflammatory cytokines in the low-lipid subpopulation. The low-lipid subpopulation produced more glucose. Fat consumption further activated the gluconeogenic program in the low-lipid, but not the high-lipid, subpopulations. These data suggest that intracellular lipid content is a key intrinsic determinant for hepatocyte heterogeneity of metabolic, inflammatory, and survival states.
Keywords: gluconeogenesis, lipogenesis, hepatocytes, NAFLD, obesity
hepatocytes perform essential metabolic functions, including de novo gluconeogenesis, lipogenesis, and ketogenesis. Hepatocytes metabolize both endogenous (e.g., ammonia derived from amino acid catabolism) and exogenous harmful substances (e.g., xenobiotics), and they are required for the detoxification of these toxic materials. Additionally, hepatocytes secrete acute-phase proteins and cytokines that combat infection (16). Aberrant hepatocyte glucose and lipid metabolism is an important risk factor for diabetes (6, 17); chronic hepatocyte injury and death and liver inflammation impair liver function and promote liver fibrosis, leading to cirrhosis, liver failure, and hepatocellular carcinoma (HCC) (4, 13, 14).
Hepatocytes are functionally heterogeneous. A liver lobule, the basic structural and functional unit of the liver, is divided into three metabolic zones along its portovenous axis (e.g., the periportal, intermediate, and perivenous zones) (9). Hepatocytes located in different hepatic zones have distinct gene expression profiles and metabolic activities. The expressions of gluconeogenic enzymes and gluconeogenesis are higher in the periportal zone, whereas the levels of glycolytic enzymes and glycolysis are higher in the perivenous zone (9). Periportal hepatocytes express higher levels of lipogenic enzymes (18), whereas perivenous hepatocytes have higher levels of enzymes that catalyze fatty acid β-oxidation (2). Carbamoyl-phosphate synthase-1 (CPS1), a key urea cycle enzyme, is expressed at higher levels in the periportal zone, but it is absent in terminal perivenous hepatocytes (24); in contrast, glutamine synthetase is expressed only in perivenous hepatocytes (7, 24). Cyp7α1 and Cyp8b1, two key enzymes of the bile acid synthesis pathway, are higher in the perivenous zone (26), whereas multidrug resistance-associated protein-2 is expressed mainly in periportal hepatocytes (15). Metabolite, hormone, and/or oxygen gradients along the portovenous axis are believed to contribute to the establishment and maintenance of the liver zonation (9). Aside from these extrinsic factors, we hypothesize that hepatocyte intrinsic factors specify metabolic signatures and other functional states of hepatocytes, thereby determining the heterogeneity of hepatocytes in conjunction with external microenvironments.
Hepatocytes are able to accumulate triacylglycerol (TAG) into lipid droplets by increasing fatty acid uptake and de novo lipogenesis and to metabolize fatty acids which are released from lipid droplets through lipolysis and/or autophagy. Released fatty acids have several fates. They are oxidized to provide bioenergy for hepatocyte activities or serve as precursors for the synthesis of glycerophospholipids, sphingolipids, and ceramides. These complex lipids are key cell membrane components, and they also act as signaling molecules to regulate a variety of cellular activities (3). Additionally, fatty acids can be packaged into very-low-density lipoprotein (VLDL) particles or converted into ketone bodies. Both VLDL particles and ketone bodies are secreted into the circulation and modulate metabolism in extrahepatic tissues. Thus, hepatocyte lipid content is likely to be an intrinsic determinant for the functional heterogeneity of hepatocytes in vivo.
Fat consumption promotes hepatic steatosis, which is a driving force for nonalcoholic steatohepatitis (NASH) progression (13, 14, 19). Proinflammatory cytokines, which are secreted by hepatocytes and both resident and infiltrated immune cells, impair hepatocyte metabolism as well as viability, thus orchestrating NASH progression (1, 3, 13, 14, 19). However, it is unclear whether individual hepatocytes display heterogeneity of viability and inflammatory potentials in vivo and whether dietary fat has distinct effects on different subpopulations of hepatocytes. In this work, we show that mouse livers contain heterogeneous subpopulations of hepatocytes with different lipid contents. Hepatocytes with high lipid content have lower levels of gluconeogenesis and fatty acid β-oxidation rates and higher levels of fatty acid uptake than hepatocytes with low lipid content. The high-lipid subpopulation is more susceptible to injury and apoptosis, and it is prone to inflammation. Dietary fat has a more severe detrimental effect on the high-lipid than on the low-lipid subpopulations.
MATERIALS AND METHODS
Animals.
C57BL/6 male mice were housed on a 12:12-h light-dark cycle in the Unit for Laboratory Animal Medicine at the University of Michigan. Mice (9–10 wk) were fed either a standard rodent chow diet (9% fat; Lab Diet, St. Louis, MO) or a high-fat diet (HFD; 60% fat from Research Diets, New Brunswick, NJ) ad libitum with free access to water. Animal experiments were conducted following animal protocols approved by the University Committee on Use and Care of Animals (UCUCA) at the University of Michigan.
Hepatocyte isolation.
The L-lipid and H-lipid subpopulations were separated by Percoll density gradient centrifugation as described previously (8). A Percoll gradient was established by sequentially adding 3 ml of 1.12 g/ml, 5 ml of 1.08 g/ml, and 5 ml of 1.06 g/ml Percoll solution into a 50-ml centrifugation tube. Mouse livers were digested with collagenase as described previously (28), and hepatocyte suspension was loaded on the top of the Percoll gradient solution. Hepatocytes were fractioned into three layers by centrifugation at 750 g for 20 min. The top layer (containing dead hepatocytes and nonhepatocyte cells) was discarded. The second layer contained hepatocytes with high lipid content and was designated as the H-lipid subpopulation, whereas the third layer contained hepatocytes with low lipid content and was designated as the L-lipid subpopulation.
Hepatocyte TAG assays.
Hepatocytes were homogenized in 0.1 M HCl. Cell lysates were extracted by chloroform-methanol (2:1). The organic phase was transferred to a new tube and dried by evaporation. Lipid residues were dissolved in isopropanol and measured using a TAG assay kit (Pointe Scientific, Canton, MI).
Glucose production assays.
Primary L-lipid and H-lipid hepatocytes were grown in Williams medium E (Sigma-Aldrich, St. Louis, MO) supplemented with 2% fetal bovine serum, 100 U/ml penicillin, and 100 μg/ml streptomycin. For glucose production assays, growth medium was replaced with Krebs-Ringer bicarbonate buffer and gluconeogenic substrates (10 mM lactate and 5 mM pyruvate) in the presence or absence of 50 nM glucagon. Hepatocytes were incubated for 4 h at 37°C, and culture medium was collected and used to measure glucose levels. Glucose production was normalized to total hepatocyte protein levels.
Lipogenesis assays.
Primary L-lipid and H-lipid hepatocytes were pretreated with or without insulin (100 nM) for 12 h. Cells were then incubated for additional 4 h in Williams medium E supplemented with 0.5% BSA, 0.5 mM cold acetate, and 4 μCi/ml [3H]acetate (Moravek Biochemicals, Brea, CA). Cells were lysed in 0.1 M HCl, and lipids were extracted with chloroform-methanol (2:1). The organic phase was collected and dried via evaporation at 50°C. The pellets were dissolved in 50 μl of hexane and 200 μl H2SO4 (1.8% in methanol) and heated for 30 min at 100°C. The mixtures were cooled down to room temperatures, and mixed with 125 μl of water and 250 μl of petroleum. After centrifugation, the petroleum phase was collected and used to measure 3H radioactivity. Lipogenesis rates were normalized to total protein levels.
Fatty acid β-oxidation assays.
Primary L-lipid and H-lipid hepatocytes were pretreated with or without glucagon (50 nM) for 12 h. The treated cells were incubated for 1 h at 37°C with 0.4 μCi/ml [9,10-3H(N)]oleic acid (Moravek Biochemicals) and 100 μM cold oleic acid (conjugated with BSA) in Williams medium E. Culture medium was collected, incubated with perchloric acid (1.3 M), and centrifuged at 16,000 rcf for 10 min. 3H radioactivity in supernatant was measured and used to calculate oxidation rates as we described previously (22).
Fatty acid uptake assays.
Primary L-lipid and H-lipid hepatocytes were cultured for 12 h and then incubated at 37°C in Williams Medium E containing 0.4 μCi/ml [9,10-3H(N)]oleic acid and 100 μM cold oleic acid (prebound to BSA). After a 10-min incubation, hepatocytes were washed with ice-cold PBS six times and lysed in 0.5% SDS buffer. 3H radioactivity in cell lysates was measured. Hepatocytes were treated with methanol for 5 min and used as a blank control. Fatty acid uptake rates were normalized to total protein levels.
MTT assays.
Hepatocytes were incubated with 3-(4,5-dimethylthiazol-2-yl)-2,5-diphenyltetrazolium bromide (MTT; 75 μg/ml) in growth medium for 1 h. After extensive washes with PBS, cells were solubilized in DMSO. Cell extract absorbance (570 nm) was measured using a microplate reader.
TUNEL assays.
Hepatocytes were fixed in 4% paraformaldehyde in PBS for 60 min at room temperature, rinsed with PBS twice, permeabilized for 15 min in PBS supplemented with 0.5% Triton X-100 and 0.05% SDS, rinsed with PBS twice, and then subjected to TUNEL assays using cell death detection kits (Roche Diagnostics, Indianapolis, IN) following the manufacturer's instructions. Hepatocytes were costained with DAPI to visualize nuclei.
Immunoblotting.
Hepatocytes were homogenized in ice-cold lysis buffer (50 mM Tris·HCl, pH 7.5, 0.5% Nonidet P-40, 150 mM NaCl, 2 mM EGTA, 1 mM Na3VO4, 100 mM NaF, 10 mM Na4P2O7, 1 mM phenylmethylsulfonyl fluoride, 10 μg/ml aprotinin, 10 μg/ml leupeptin). Cell extracts were immunoblotted with anti-caspase-3 (Cell Signaling, no. 9664; dilation: 1:1,000), anti-tubulin (Santa Cruz Biotechnology, SC-5286; dilution: 1:4,000), or anti-albumin (Sigma-Aldrich, no. A1151; dilution: 1:3000) antibodies.
Preparation of hepatocyte conditioned medium.
Hepatocytes were cultured in Williams medium E supplemented with 2% FBS for 5 h and then in serum-free Williams medium E supplemented without (basal) or with 0.25 mM palmitic acid and 0.1 μg/ml lipopolysaccharides (LPS) for 2 h. After PBS washes, hepatocytes were incubated in serum-free Williams medium E supplemented with 0.5% BSA. Conditioned medium was collected 24 h later.
Bone marrow-derived macrophages.
Primary bone marrow cells were isolated from femur bones and cultured in DMEM supplemented with 20% L929 conditioned medium, 10% heat-inactivated FBS (56°C for 30 min), and 100 U/ml penicillin and 100 μg/ml streptomycin. Medium was changed every two days, and cells were fully differentiated into bone marrow-derived macrophages (BMDMs) 4–5 days later. BMDMs were treated for 5 h with hepatocyte conditioned medium, and total mRNAs were extracted to measure gene expression by qPCR.
To prepare L929 conditioned medium, L929 cells were maintained in 150-mm dishes in DMEM supplemented with 100 U/ml penicillin and 100 μg/ml streptomycin, 1% l-glutamine, and 10% heat-inactivated FBS. L929 conditioned medium was collected every 7 days and for two times.
Quantitative real-time RT-PCR.
Quantitative real-time RT-PCR (qPCR) was performed using absolute QPCR SYBR Green kits (Thermo Scientific, Waltham, MA) and Mx3000P real-time PCR system (Stratagene, La Jolla, CA) as described previously (6) (23). Primer sequences were: carnitine palmitoyltransferase-1a (CPT-1a) forward: 5′-CTGATGACGGCTATGGTGTTT-3′, reverse: 5′-GTGAGGCCAAACAAGGTGATA-3′; fatty acid synthase (FAS) forward: 5′-TTGACGGCTCACACACCTAC-3′, reverse: 5′-CGATCTTCCAGGCTCTTCAG-3′; IL-1 forward: 5′-GGAAGACACAGATTCCATGGTGAAG-3′, reverse: 5′-GCCTTGGGCCTCAAAGGAAAGAATC-3′; IL-6 forward: 5′-GGTCCTTAGCCACTCCT-3′, reverse: 5′-AGCCAGAGTCCTTCAGA-3′; monocyte chemoattractant protein-1 (MCP-1) forward: 5′-ACTGAAGCCAGCTCTCTCTTCCTC-3′, reverse: 5′-TTCCTTCTTGGGGTCAGCACAGAC-3′; phosphoenolpyruvate carboxykinase (PEPCK) forward: 5′-ATCATCTTTGGTGGCCGTAG-3′, reverse: 5′-ATCTTGCCCTTGTGTTCTGC-3′; glucose-6-phosphatase (G6Pase) forward: 5′-CCGGTGTTTGAACGTCATCT-3′, reverse: 5′-CAATGCCTGACAAGACTCCA-3′; tumor necrosis factor-α (TNFα) forward: 5′-CATCTTCTCAAAATTCGAGTGACAA-3′, reverse: 5′-TGGGAGTAGACAAGGTACAACCC-3′; and adipose triglyceride lipase (ATGL) forward: 5′-TTCACCATCCGCTTGTTGGAG-3′, reverse: 5′-AGATGGTCACCCAATTTCCTC-3′.
Statistical analysis.
Data are presented as means ± SE. Difference between two groups was determined by two-tailed Student's t-tests. P < 0.05 was considered statistically significant.
RESULTS
Mouse hepatocytes are heterogeneous in their intracellular lipid content.
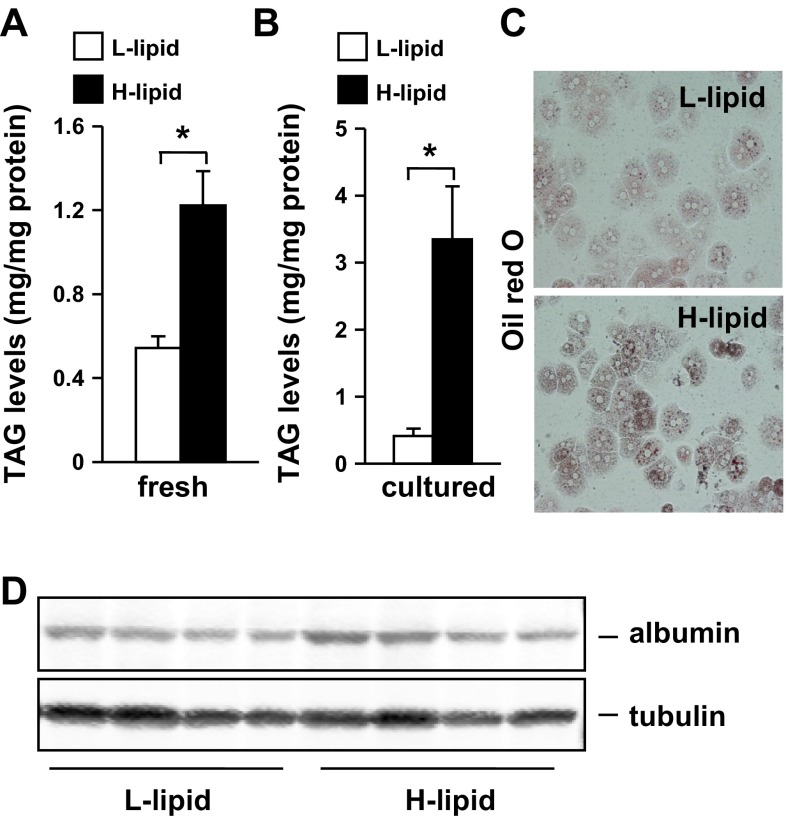
We developed a cell fraction method to isolate mouse primary hepatocytes according to their lipid levels (see materials and methods). Using this method, we fractioned hepatocytes of each individual mouse (under fed conditions) into two pools that had either H-lipid or L-lipid content. We biochemically measured intracellular cellular TAG levels and observed that, in freshly-isolated hepatocytes, TAG levels were 125% higher in the H-lipid group than in the L-lipid group (Fig. 1A). Intracellular TAG levels further increased by 710% in H-lipid hepatocytes after growing in culture medium for 10 h (Fig. 1B). In contrast, L-lipid hepatocytes were unable to accumulate additional TAG in cultures (Fig. 1B). We confirmed higher lipid levels in the H-lipid group using Oil red O staining methods (Fig. 1C). To verify both the L-lipid and H-lipid groups being hepatocytes, we immunoblotted cell extracts with antibody against albumin, a hepatocyte marker. We detected similar levels of albumin proteins in both H-lipid and L-lipid groups (Fig. 1D). These data indicate that in normal mice hepatocytes are heterogeneous in their lipid content.
Fig. 1.
Mouse livers contain both high (H)-lipid and low (L)-lipid subpopulations of hepatocytes. A: C56BL/6 male mice (11–12 wk) were fed a normal chow diet. Triacylglycerol (TAG) levels were measured in hepatocytes freshly isolated from mice under fed conditions and normalized to total protein levels (n = 4). B–D: primary hepatocytes were cultured for 10 h. B: TAG levels (n = 4). C: representative image of Oil red O staining of hepatocytes from 4 similar experiments. D: hepatocyte extracts were immunoblotted with antibodies against albumin or tubulin. Values are presented as means ± SE. *P < 0.05.
Intracellular lipid content is an intrinsic determinant for hepatocyte metabolic states.
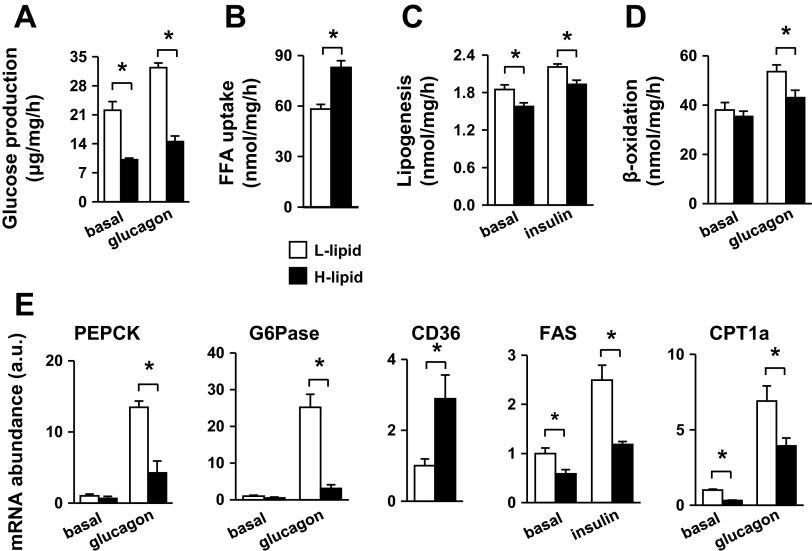
Hepatocytes produce, via both glycogenolysis and gluconeogenesis, glucose that provides an essential metabolic fuel for extrahepatic tissues during fasting. Glucagon, an important fasting hormone, stimulates hepatocytes to produce glucose (11). To determine whether lipid content affects hepatocyte glucose production, we measured both basal and glucagon-stimulated glucose production in primary H-lipid and L-lipid hepatocytes. Glucose production rates were 54 and 55% lower in H-lipid hepatocytes under basal and glucagon-stimulated conditions, respectively (Fig. 2A). We also examined lipid metabolism in primary H-lipid and L-lipid hepatocytes by measuring fatty acid uptake, lipogenesis, and β-oxidation. Fatty acid uptake was 43% higher in H-lipid hepatocytes (Fig. 2B). Surprisingly, lipogenic rates were 15% (under basal conditions) and 13% (under insulin-stimulated conditions) lower in H-lipid hepatocytes (Fig. 2C). Fatty acid β-oxidation rates were similar between H-lipid and L-lipid hepatocytes under basal conditions but 20% lower in H-lipid hepatocytes after glucagon stimulation (Fig. 2D). These data indicate that both high levels of fatty acid uptake and low levels of β-oxidation contribute to high lipid levels in H-lipid hepatocytes.
Fig. 2.
L-lipid and H-lipid subpopulations have different metabolic profiles. A: primary hepatocytes were treated without (basal) or with 50 nM glucagon. Glucose production was measured and normalized to total protein levels (n = 5). Fatty acid uptake (B), lipogenesis rates (C), and fatty acid β-oxidation rates (D) were measured and normalized to total protein levels (n = 5). E: expressions of indicated genes were measured by qPCR and normalized to 18S expression (n = 5). B–D: hepatocytes were stimulated with 50 nM glucagon or 100 nM insulin for 12 h. E: cells were treated with insulin or glucagon for 2 h (PEPCK, G6Pase) or 4 h (CD36, CPT-1a, FAS). Values are presented as means ± SE. *P < 0.05.
Hepatocyte glucose and lipid metabolism is controlled largely by transcriptional regulation of metabolic enzymes. We measured the expression of these key enzymes by qPCR. Basal expression of PEPCK and G6Pase, two key gluconeogenic enzymes, was similar between L-lipid and H-lipid hepatocytes; however, glucagon-stimulated expression of PEPCK and G6Pase was higher in L-lipid than in H-lipid hepatocytes (Fig. 2E), consistent with higher glucose production rates in the L-lipid group. the expression of CD36, a key fatty acid transporter in hepatocytes (12), was 189% higher in H-lipid hepatocytes (Fig. 2E), in agreement with higher levels of fatty acid uptake in these cells. The expression of FAS was lower in H-lipid hepatocytes (Fig. 2E). The expression of carnitine CPT-1a, which controls the rate-limiting step in β-oxidation, was lower in H-lipid hepatocytes (Fig. 2E), consistent with low β-oxidation rates in these cells. These data suggest that high intracellular lipid content is likely to suppress hepatocyte metabolic activity, including gluconeogenesis, lipogenesis, and β-oxidation, in H-lipid subpopulation.
Intracellular lipid content is an intrinsic determinant of hepatocyte inflammatory potentials.
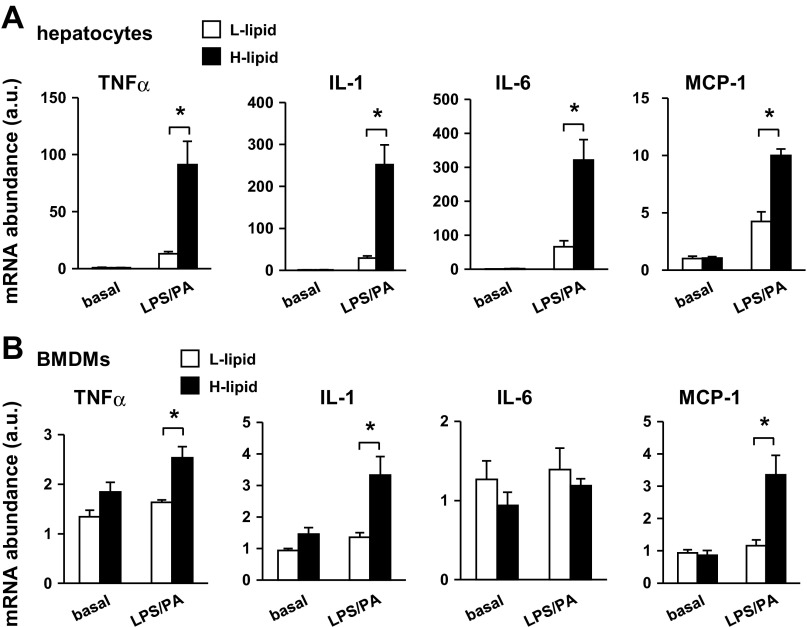
Liver inflammation is a key risk factor for insulin resistance, a hallmark of type 2 diabetes (10, 21). Additionally, liver inflammation also promotes liver fibrosis and liver cancer in the setting of hepatic steatosis (1, 14, 19). To determine whether high intracellular lipid content predisposes hepatocytes to inflammation, we stimulated L-lipid and H-lipid hepatocytes with lipopolysaccharides (LPS) and palmitic acid (PA), which are commonly used to induce liver inflammation (5). We measured the expression of proinflammatory cytokines, which was used as an index to estimate hepatocyte inflammatory potentials, by qPCR. The expression of proinflammatory cytokines was similar between L-lipid and H-lipid hepatocytes and relatively low under basal conditions. LPS and PA stimulated cytokine expression in both groups; however, the expressions of TNFα, IL-1, IL-6, and MCP-1 were 594, 761, 383, and 135% higher in H-lipid than in L-lipid hepatocytes, respectively (Fig. 3A). These results indicate that mouse hepatocytes are heterogamous in their inflammatory potentials. Intracellular lipid content is a critical intrinsic determinant of hepatocyte proinflammatory states.
Fig. 3.
High intracellular lipid content sensitizes hepatocyte inflammatory responses. A: L-lipid and H-lipid primary hepatocytes were treated for 4 h without or with 0.1 μg/ml LPS and 0.25 mM PA in combination. Expressions of indicated genes were measured by qPCR and normalized to 18S expression (n = 5). B: conditioned media were prepared from primary L-lipid and H-lipid hepatocytes treated with or without 0.1 μg/ml LPS and 0.25 mM palmitic acid (PA) for 2 h. Bone marrow-derived macrophages (BMDMs) were treated with indicated conditioned media for 5 h, and expressions of the indicated genes were measured by qPCR (n = 5). Values are presented as means ± SE. *P < 0.05.
To verify the higher proinflammatory capability of the H-lipid subpopulation, we examined the ability of hepatocyte-released factors to activate BMDMs. We prepared conditioned media from L-lipid or H-lipid hepatocytes under either basal or LPS/PA-stimulated conditions. BMDMs were treated with conditioned medium, and the expressions of proinflammatory cytokines were measured by qPCR. Both L-lipid and H-lipid conditioned media, which were prepared under basal conditions, similarly stimulated cytokine expression in BMDMs. In contrast, conditioned medium from LPS/PA-treated H-lipid hepatocytes stimulated higher levels of TNFα (by 55%), IL-1 (by 145%), and MCP-1 (by 188%) expression than LPS/PA-treated L-lipid hepatocyte-derived conditioned medium (Fig. 3B). These data indicate that high intracellular lipid levels sensitize hepatocytes to inflammatory signals, thus triggering and/or exacerbating liver inflammation under pathological conditions.
Intracellular lipid content negatively regulates hepatocyte viability.
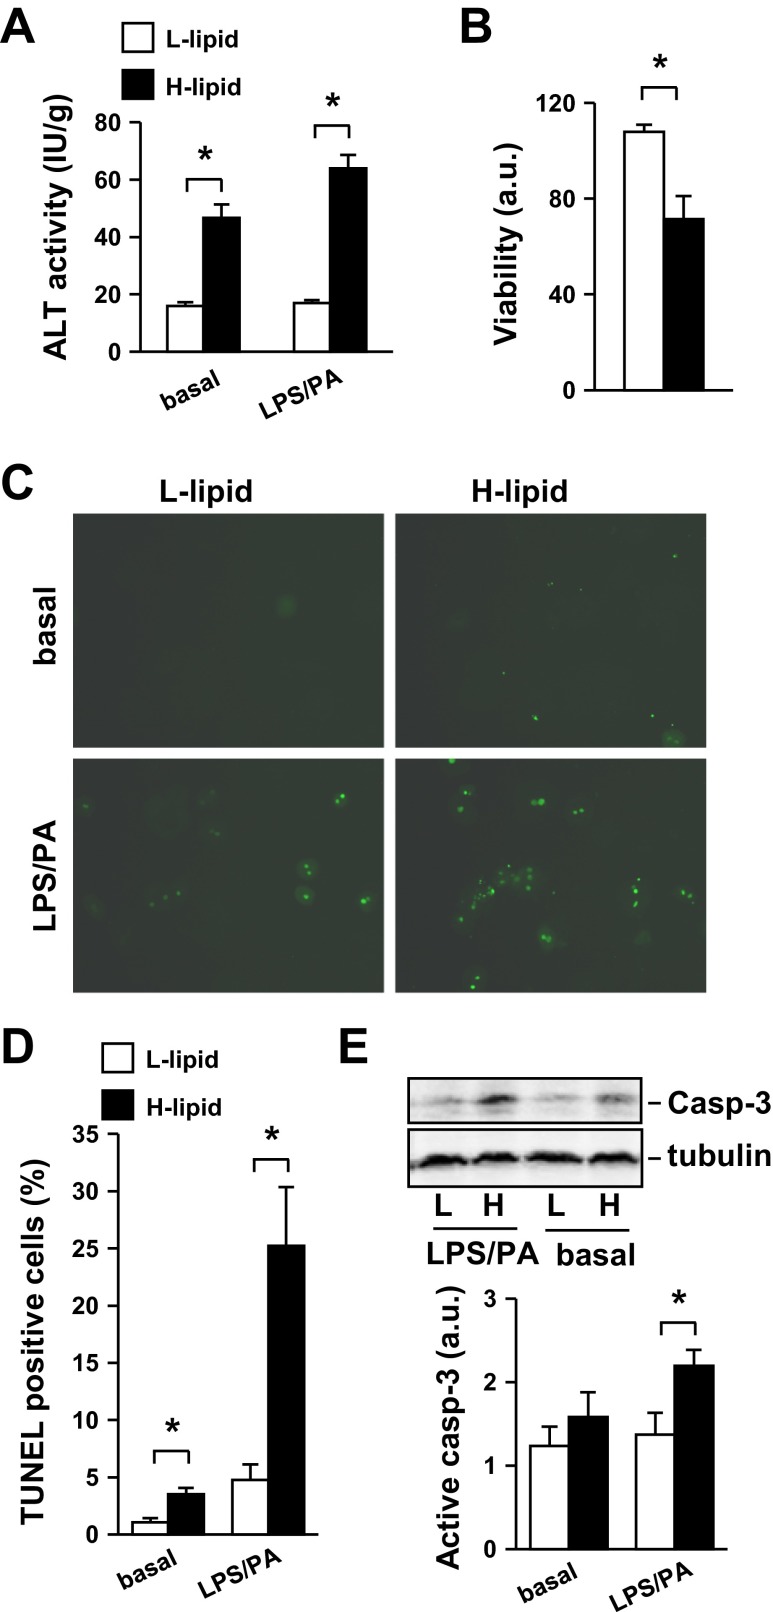
Hepatocyte injury and death are key risk factors for liver failure. It is unclear whether different hepatocyte subpopulations have different viability due to their distinct locations, biochemical characteristics, and/or metabolic states. We tested the hypothesis that intracellular lipid content is a key intrinsic determinant of hepatocyte viability. L-lipid or H-lipid hepatocytes were treated with or without LPS and PA, and hepatocyte injury was assessed by measuring release of alanine transaminase (ALT) from hepatocytes into culture medium. ALT activity released from H-lipid hepatocytes was 191% (under basal conditions) and 277% (under LPS/PA-stimulated conditions) higher than that from L-lipid hepatocytes (Fig. 4A). We measured the viability of LPS/PA-treated hepatocytes using MTT assays. The survival rates of H-lipid hepatocytes were 51% lower than that of L-lipid hepatocytes (Fig. 4B). We also examined apoptosis using TUNEL assays. L-lipid hepatocyte apoptosis rates were very low under basal conditions and increased 3.5-fold after LPS/PA treatments (Figs. 4, C and D). Importantly, apoptosis was 230% (under basal conditions) and 427% (under LPS/PA-stimulated conditions) higher in H-lipid than in L-lipid hepatocytes (Fig. 4, C and D). In agreement, activation of caspase-3 was also higher in H-lipid than in L-lipid hepatocytes (Fig. 4E). Together, these data indicate that mouse hepatocytes are heterogeneous in both their viability and their susceptibility to injury. Thus, intracellular lipid content appears to be a key intrinsic determinant of hepatocyte viability and hepatocyte resistance to injury.
Fig. 4.
H-lipid hepatocytes are more susceptible to injury and death than L-lipid hepatocytes. Primary L-lipid and H-lipid hepatocytes were treated with or without 0.1 μg/ml LPS and 0.25 mM PA for 24 h. A: alanine transaminase (ALT) activity in growth medium was measured and normalized to total hepatocyte protein levels (n = 5). B: hepatocyte viability was measured using MTT assays (n = 4). C: hepatocyte apoptosis was examined by TUNEL assays. A representative image is shown. D: TUNEL-positive cells were quantified and normalized to total cell numbers (n = 4). E: hepatocyte extracts were immunoblotted with antibodies against caspase-3 (casp-3) or tubulin. Levels of active caspase-3 were quantified by densitometry and normalized to tubulin levels (n = 5). Values are presented as means ± SE. *P < 0.05.
Dietary fat has different metabolic effects on H-lipid and L-lipid subpopulations.
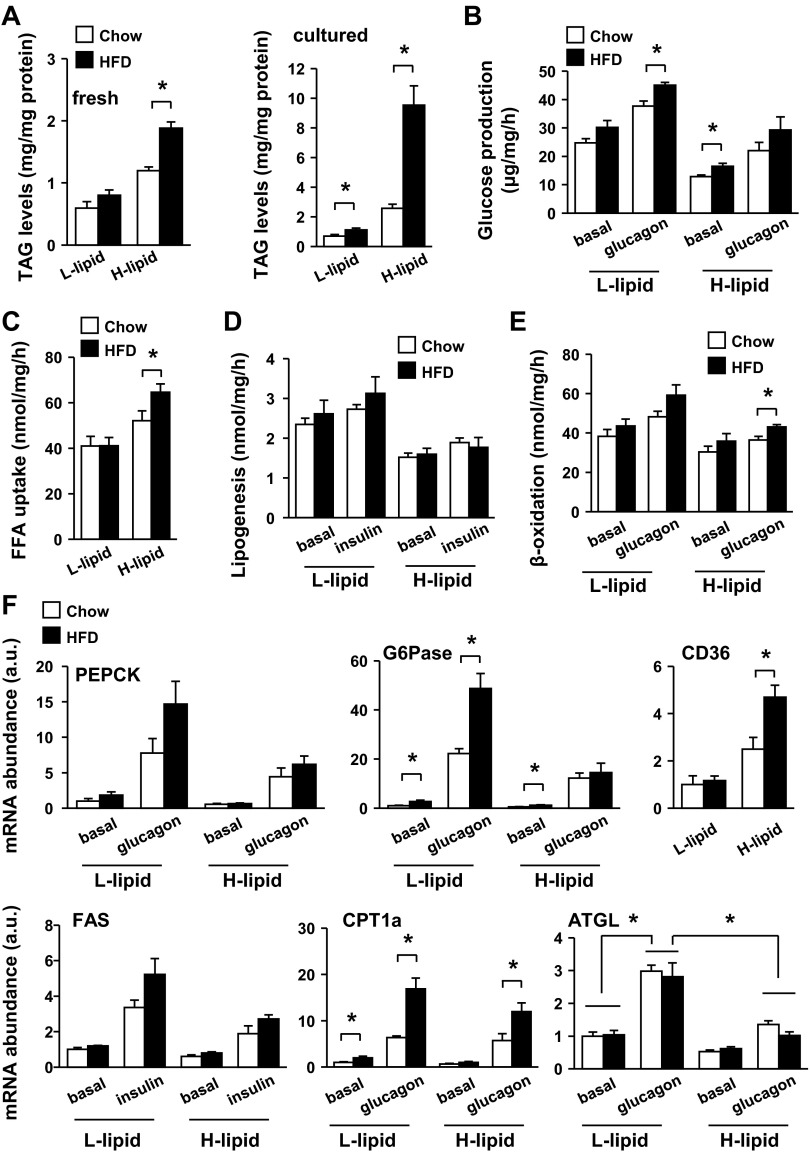
Dietary fat is a primary risk factor for obesity, type 2 diabetes, and liver diseases. To examine the impact of fat consumption on hepatocyte metabolism, C57BL/6 male mice were fed a HFD for 2 wk, and primary L-lipid and H-lipid hepatocytes were prepared and subjected to glucose production, fatty acid uptake, lipogenesis, and β-oxidation assays. We did not observe a significant change in L-lipid vs. H-lipid hepatocyte ratios by HFD feeding. Feeding a HFD markedly increased intracellular lipid levels in both freshly isolated (by 63%) and cultured (by 270%) H-lipid hepatocytes (Fig. 5A); in contrast, it only modestly increased lipid levels in both fresh (by 35%) and cultured (by 61%) L-lipid hepatocytes (Fig. 5A). In mice fed a normal chow diet, L-lipid hepatocytes produced more glucose than H-lipid hepatocytes under both basal and glucagon-stimulated conditions (Fig. 5B). HFD treatments significantly increased glucose production in L-lipid hepatocytes stimulated with glucagon (Fig. 5B). Fatty acid uptake was higher in H-lipid than in L-lipid hepatocytes of mice fed a normal chow diet as described before, and feeding a HFD further increased fatty acid uptake in H-lipid but not L-lipid hepatocytes (Fig. 5C). HFD consumption did not increase lipogenesis in either L-lipid or H-lipid hepatocytes (Fig. 5D) and slightly increased fatty acid β-oxidation in both L-lipid and H-lipid hepatocytes (Fig. 5E). In agreement, HFD treatments increased glucagon-stimulated expression of gluconeogenic G6Pase in L-lipid but not H-lipid hepatocytes (Fig. 5F). By contrast, HFD consumption increased the expression of CD36 fatty acid transporter in H-lipid but not L-lipid hepatocytes (Fig. 5F). HFD feeding increased CPT-1a expression in both L-lipid and H-lipid hepatocytes (Fig. 5F). Glucagon stimulated the expression of adipose triglyceride lipase (ATGL; Fig. 5F), a key lipolytic enzyme in the liver (20, 25, 27). ATGL expression was lower in H-lipid than in L-lipid hepatocytes under both basal and glucagon-stimulated conditions (Fig. 5F), raising the possibility that lipolysis rates are lower in the H-lipid subpopulation. HFD feeding did not significantly alter ATGL expression in either L-lipid or H-lipid hepatocytes (Fig. 5F). Together, these data indicate that consumption of HFD has different effects on glucose and lipid metabolism between H-lipid and L-lipid subpopulations.
Fig. 5.
High-fat diet (HFD) consumption selectively increases fatty acid uptake in H-lipid hepatocytes and gluconeogenesis in L-lipid hepatocytes. C57BL/6 male mice (9–10 wk) were fed Chow or HFD for 2 wk. A: TAG levels were measured in freshly isolated or cultured (for 10 h) hepatocytes and normalized to total protein levels. B: glucose production was measured in primary hepatocytes treated with or without 50 nM glucagon for 4 h (n = 5). C–E: primary hepatocytes were stimulated with or without 50 nM glucagon or 100 nM insulin for 12 h and subjected to fatty acid uptake (C), β-oxidation (D), and lipogenesis assays (E) (n = 5). F: primary hepatocytes were treated with or without indicated hormones for 2 h (for PEPCK and G6Pase) or 4 h (for CD36, CPT-1, and FAS). Expressions of indicated genes were measured by qPCR and normalized to 18S expression (n = 5), and the values were further normalized to the basal expression values of L-lipid hepatocytes of normal chow-fed mice. Values are presented as means ± SE. *P < 0.05.
H-lipid subpopulation is more susceptible to HFD-induced inflammation and death.
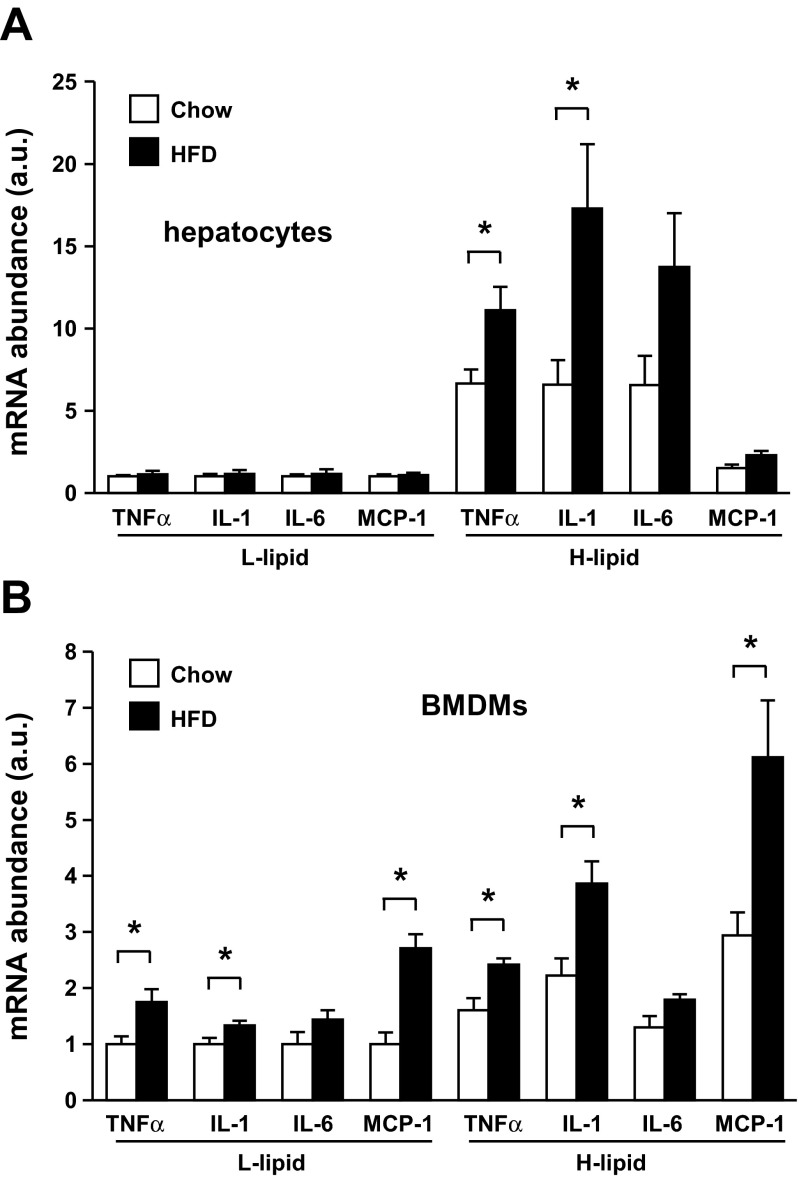
To examine the effect of HFD on the proinflammatory states of L-lipid and H-lipid hepatocytes, we measured the expression of proinflammatory cytokines in these hepatocytes stimulated with LPS and PA. HFD treatments did not increase basal expression of proinflammatory cytokines in either L-lipid or H-lipid hepatocytes. In mice fed a normal chow diet, LPS/PA stimulated cytokine expression to a greater extent in H-lipid than in L-lipid hepatocytes, as described before; surprisingly, HFD treatments increased the expression of TNFα and IL-1 in H-lipid but not L-lipid hepatocytes (Fig. 6A). We also examined the ability of conditioned media derived from L-lipid and H-lipid hepatocytes to activate BMDMs. HFD treatments increased the ability of both L-lipid and H-lipid hepatocytes to activate BMDMs; however, the levels of proinflammatory cytokine expression were higher in H-lipid hepatocyte conditioned medium-stimulated BMDMs (Fig. 6B). Together, these data indicate that dietary fat selectively increases the ability of the H-lipid subpopulation to express proinflammatory cytokines in mice.
Fig. 6.
HFD consumption selectively increases expression of proinflammatory cytokines in the H-lipid subpopulation. C57BL/6 male mice (9–10 wk) were fed Chow or HFD for 2 wk. A: primary L-lipid and H-lipid hepatocytes were treated with 0.1 μg/ml LPS and 0.25 mM PA for 4 h. Expressions of indicated genes were measured by qPCR and normalized to 18S expression (n = 5). B: conditioned media were prepared from LPS/PA-treated L-lipid and H-lipid hepatocytes. BMDMs were stimulated with indicated conditioned medium for 5 h, and expressions of the indicated genes were measured by qPCR and normalized to 18S expression (n = 5). Values are presented as means ± SE. *P < 0.05.
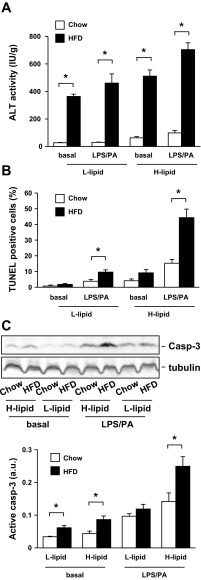
To determine whether HFD treatments have different effects on the viability of L-lipid and H-lipid hepatocytes, we measured ALT release, apoptosis, and caspase-3 activation in these cells. HFD treatments markedly increased ALT release from both L-lipid and H-lipid hepatocytes (Fig. 7A), suggesting that feeding a HFD causes a similar injury in these two subpopulations. In mice fed a normal chow diet, apoptosis was higher in H-lipid than in L-lipid hepatocytes under both basal and LPS/PA-stimulated conditions (Fig. 7B). HFD treatments increased apoptosis in both subpopulations; however, apoptosis rates were 359% higher in the H-lipid than in the L-lipid subpopulations after LPS/PA treatments (Fig. 7B). HFD treatments increased caspase-3 activation to a greater extent in H-lipid than in L-lipid hepatocytes (Fig. 7C). These data suggest that intracellular lipid content is an intrinsic determinant of hepatocyte viability and susceptibility to death signals.
Fig. 7.
HFD consumption preferentially promotes apoptosis of the H-lipid subpopulation. C57BL/6 male mice (9–10 wk) were fed Chow or HFD for 2 wk. Primary L-lipid and H-lipid hepatocytes were treated with or without 0.1 μg/ml LPS and 0.25 mM PA for 24 h. A: ALT activity in growth medium was measured and normalized to total hepatocyte protein levels (n = 5). B: hepatocyte apoptosis was examined by TUNEL assays, and TUNEL-positive cells were normalized to total cell numbers (n = 4). C: hepatocyte extracts were immunoblotted with antibodies against caspase-3 or tubulin. Levels of active caspase-3 were quantified and normalized to tubulin levels (n = 5). Values are presented as means ± SE. *P < 0.05.
DISCUSSION
Liver zonation reflects the metabolic heterogeneity of hepatocytes along the portovenous axis. In addition to metabolic heterogeneity, we show in this study that hepatocytes also display heterogeneity of viability, resistance to injury, and inflammation potentials.
We first showed that mouse livers contained different subpopulations of hepatocytes, which have different lipid contents. We experimentally divided these hepatocytes into L-lipid and H-lipid subpopulations according to their lipid content. We observed that the H-lipid subpopulation accumulated high levels of lipids mainly by increasing fatty acid uptake and reducing fatty acid β-oxidation. We demonstrated that the H-lipid subpopulation was more prone to injury and death and that they also secreted higher levels of proinflammatory cytokines that activate macrophages. These observations raise the possibility that the H-lipid subpopulation may initiate liver injury and liver inflammation in vivo under pathological conditions, thus playing a key role in the pathogenesis of liver diseases.
Dietary fat is a primary risk factor for liver diseases, including NASH, cirrhosis, and aberrant liver metabolism. We observed that consumption of HFD markedly increased lipid levels in the H-lipid subpopulation and that it only slightly increased lipid levels in the L-lipid subpopulation. In agreement, HFD treatments increased CD36 expression and fatty uptake in the H-lipid subpopulation but not in the L-lipid subpopulation. These data suggest that consumption of dietary fat promotes steatosis mainly in the H-lipid subpopulation. We also showed that HFD treatments increased ligand-stimulated expression of proinflammatory cytokines selectively in the H-lipid but not in the L-lipid subpopulation. Excessive inflammation causes liver damage and drives NASH progression (1, 14, 19). Indeed, HFD consumption increased LPS-stimulated apoptosis 427% higher in the H-lipid subpopulation than in the L-lipid subpopulation. Therefore, the H-lipid subpopulation may not only trigger NASH in early stages but also be a driving force of NASH progression.
Lipids, particularly saturated fatty acids and ceramides, are known to promote inflammation and cell death (3). H-lipid hepatocytes may generate higher levels of intracellular toxic lipid species that promote injury, inflammation, and death. The H-lipid subpopulation is more susceptible to injury and death. Damaged and dead hepatocytes release numerous damage-associated molecular patterns (DAMPs) (3). DAMPs activate immune cells and hepatic stellate cells (HSCs) via their cognate pattern recognition receptors (PRRs) and further exacerbate liver inflammation (3). Excessive inflammation causes additional hepatocyte death (3), thus forming the H-lipid hepatocyte-immune cell/HSCs vicious cycle that may drive liver disease progression. The detailed molecular steps that mediate H-lipid hepatocytes' responses will be elucidated in the future. Together, our data suggest that H-lipid hepatocytes may orchestrate liver injury and NASH progression in conjunction with immune cells and HSCs. Therefore, the H-lipid subpopulation may serve as important therapeutic targets in treating NASH and other liver degenerative diseases.
We also observed that H-lipid hepatocytes have lower levels of gluconeogenesis, lipogenesis, and fatty acid β-oxidation, suggesting that the metabolic activity of the H-lipid subpopulation is relatively low. It is currently unclear whether low metabolic activity contributes to low viability and high inflammation of the H-lipid subpopulation. This possibility will be examined in the future. Glucose production rates were 54% lower in H-lipid than in L-lipid hepatocytes, indicating that the L-lipid subpopulation is the major cell type responsible for liver glucose production in vivo. HFD consumption further increased the ability of the L-lipid subpopulation to generate glucose; therefore, the L-lipid subpopulation may serve as a therapeutic target in treating hyperglycemia. Since inflammation promotes insulin resistance, a driving force for type 2 diabetes, the H-lipid subpopulation is also likely to contribute the pathogenesis of type 2 diabetes by stimulating the production of proinflammatory cytokines. These cytokines may increase the ability of the L-lipid subpopulation to produce glucose by increasing insulin resistance and/or by increasing the hyperglycemic response to glucagon as we recently reported (23).
In summary, we show that mouse hepatocytes display heterogeneity of metabolism, viability, and inflammation according to their intracellular content. Hepatocytes with high lipid content are more prone to inflammation, injury, and death, and consumption of a HFD has a more severe detrimental effect on this subpopulation. Hepatocytes with low lipid content produce higher levels of glucose and are likely responsible for liver glucose production in vivo. Dietary fat further increases the ability of this group to produce glucose, which may contribute to hyperglycemia in type 2 diabetes.
GRANTS
This study was supported by National Institutes of Health (NIH) Grants RO1 DK-065122, RO1 DK-091591, and RO1 DK-094014. This work utilized cores supported by the Michigan Diabetes Research and Training Center (funded by NIH 5P60 DK-20572), the University of Michigan's Cancer Center (funded by NIH 5 P30 CA-46592), and the University of Michigan Gut Peptide Research Center (funded by NIH DK-34933).
DISCLOSURES
No conflicts of interest, financial or otherwise, are declared by the author(s).
AUTHOR CONTRIBUTIONS
Author contributions: L.S. and B.J. performed experiments; L.S. and L.R. analyzed data; L.S. and L.R. interpreted results of experiments; L.S. and L.R. prepared figures; L.S. and L.R. edited and revised manuscript; L.S. and L.R. approved final version of manuscript; L.R. conception and design of research; L.R. drafted manuscript.
ACKNOWLEDGMENTS
We thank Drs. Lin Jiang, Zheng Chen, and Hong Shen for helpful discussions.
REFERENCES
- 1.Baffy G. Kupffer cells in non-alcoholic fatty liver disease: the emerging view. J Hepatol 51: 212–223, 2009 [DOI] [PMC free article] [PubMed] [Google Scholar]
- 2.Braeuning A, Ittrich C, Kohle C, Hailfinger S, Bonin M, Buchmann A, Schwarz M. Differential gene expression in periportal and perivenous mouse hepatocytes. FEBS J 273: 5051–5061, 2006 [DOI] [PubMed] [Google Scholar]
- 3.Brenner C, Galluzzi L, Kepp O, Kroemer G. Decoding cell death signals in liver inflammation. J Hepatol 59: 583–594, 2013 [DOI] [PubMed] [Google Scholar]
- 4.Cohen JC, Horton JD, Hobbs HH. Human fatty liver disease: old questions and new insights. Science 332: 1519–1523, 2011 [DOI] [PMC free article] [PubMed] [Google Scholar]
- 5.Csak T, Ganz M, Pespisa J, Kodys K, Dolganiuc A, Szabo G. Fatty acid and endotoxin activate inflammasomes in mouse hepatocytes that release danger signals to stimulate immune cells. Hepatology 54: 133–144, 2011 [DOI] [PMC free article] [PubMed] [Google Scholar]
- 6.Diehl AM. Hepatic complications of obesity. Gastroenterol Clin North Am 39: 57–68, 2010 [DOI] [PubMed] [Google Scholar]
- 7.Gebhardt R, Mecke D. Heterogeneous distribution of glutamine synthetase among rat liver parenchymal cells in situ and in primary culture. EMBO J 2: 567–570, 1983 [DOI] [PMC free article] [PubMed] [Google Scholar]
- 8.Goncalves LA, Vigario AM, Penha-Goncalves C. Improved isolation of murine hepatocytes for in vitro malaria liver stage studies. Malaria J 6: 169, 2007 [DOI] [PMC free article] [PubMed] [Google Scholar]
- 9.Hijmans BS, Grefhorst A, Oosterveer MH, Groen AK. Zonation of glucose and fatty acid metabolism in the liver: Mechanism and metabolic consequences. Biochimie 2013. June 20 pii: S0300-9084(13)00173-9. 10.1016/j.biochi.2013.06.007 [Epub ahead of print] [DOI] [PubMed] [Google Scholar]
- 10.Hotamisligil GS. Inflammation and metabolic disorders. Nature 444: 860–867, 2006 [DOI] [PubMed] [Google Scholar]
- 11.Jiang G, Zhang BB. Glucagon and regulation of glucose metabolism. Am J Physiol Endocrinol Metab 284: E671–E678, 2003 [DOI] [PubMed] [Google Scholar]
- 12.Kennedy DJ, Kashyap SR. Pathogenic role of scavenger receptor CD36 in the metabolic syndrome and diabetes. Metab Syndrome Relat Dis 9: 239–245, 2011 [DOI] [PubMed] [Google Scholar]
- 13.Larter CZ, Yeh MM. Animal models of NASH: getting both pathology and metabolic context right. J Gastroenterol Hepatol 23: 1635–1648, 2008 [DOI] [PubMed] [Google Scholar]
- 14.Lewis JR, Mohanty SR. Nonalcoholic fatty liver disease: a review and update. Dig Dis Sci 55: 560–578, 2010 [DOI] [PubMed] [Google Scholar]
- 15.Micuda S, Fuksa L, Brcakova E, Osterreicher J, Cermanova J, Cibicek N, Mokry J, Staud F, Martinkova J. Zonation of multidrug resistance-associated protein 2 in rat liver after induction with dexamethasone. J Gastroenterol Hepatol 23: e225–e230, 2008 [DOI] [PubMed] [Google Scholar]
- 16.Nishitsuji H, Funami K, Shimizu Y, Ujino S, Sugiyama K, Seya T, Takaku H, Shimotohno K. Hepatitis C virus infection induces inflammatory cytokines and chemokines mediated by the cross talk between hepatocytes and stellate cells. J Virol 87: 8169–8178, 2013 [DOI] [PMC free article] [PubMed] [Google Scholar]
- 17.Postic C, Dentin R, Girard J. Role of the liver in the control of carbohydrate and lipid homeostasis. Diabetes Metab 30: 398–408, 2004 [DOI] [PubMed] [Google Scholar]
- 18.Quistorff B, Katz N, Witters LA. Hepatocyte heterogeneity in the metabolism of fatty acids: discrepancies on zonation of acetyl-CoA carboxylase. Enzyme 46: 59–71, 1992 [DOI] [PubMed] [Google Scholar]
- 19.Reddy JK, Rao MS. Lipid metabolism and liver inflammation. II. Fatty liver disease and fatty acid oxidation. Am J Physiol Gastrointest Liver Physiol 290: G852–G858, 2006 [DOI] [PubMed] [Google Scholar]
- 20.Reid BN, Ables GP, Otlivanchik OA, Schoiswohl G, Zechner R, Blaner WS, Goldberg IJ, Schwabe RF, Chua SC, Jr, Huang LS. Hepatic overexpression of hormone-sensitive lipase and adipose triglyceride lipase promotes fatty acid oxidation, stimulates direct release of free fatty acids, and ameliorates steatosis. J Biol Chem 283: 13087–13099, 2008 [DOI] [PMC free article] [PubMed] [Google Scholar]
- 21.Schenk S, Saberi M, Olefsky JM. Insulin sensitivity: modulation by nutrients and inflammation. J Clin Invest 118: 2992–3002, 2008 [DOI] [PMC free article] [PubMed] [Google Scholar]
- 22.Sheng L, Cho KW, Zhou Y, Shen H, Rui L. Lipocalin 13 protein protects against hepatic steatosis by both inhibiting lipogenesis and stimulating fatty acid beta-oxidation. J Biol Chem 286: 38128–38135, 2011 [DOI] [PMC free article] [PubMed] [Google Scholar]
- 23.Sheng L, Zhou Y, Chen Z, Ren D, Cho KW, Jiang L, Shen H, Sasaki Y, Rui L. NF-kappaB-inducing kinase (NIK) promotes hyperglycemia and glucose intolerance in obesity by augmenting glucagon action. Nat Med 18: 943–949, 2012 [DOI] [PMC free article] [PubMed] [Google Scholar]
- 24.Smith DD, Jr, Campbell JW. Distribution of glutamine synthetase and carbamoyl-phosphate synthetase I in vertebrate liver. Proc Natl Acad Sci USA 85: 160–164, 1988 [DOI] [PMC free article] [PubMed] [Google Scholar]
- 25.Turpin SM, Hoy AJ, Brown RD, Rudaz CG, Honeyman J, Matzaris M, Watt MJ. Adipose triacylglycerol lipase is a major regulator of hepatic lipid metabolism but not insulin sensitivity in mice. Diabetologia 54: 146–156, 2011 [DOI] [PubMed] [Google Scholar]
- 26.Wang J, Olin M, Rozell B, Bjorkhem I, Einarsson C, Eggertsen G, Gafvels M. Differential hepatocellular zonation pattern of cholesterol 7alpha-hydroxylase (Cyp7a1) and sterol 12alpha-hydroxylase (Cyp8b1) in the mouse. Histochem Cell Biol 127: 253–261, 2007 [DOI] [PubMed] [Google Scholar]
- 27.Wu JW, Wang SP, Alvarez F, Casavant S, Gauthier N, Abed L, Soni KG, Yang G, Mitchell GA. Deficiency of liver adipose triglyceride lipase in mice causes progressive hepatic steatosis. Hepatology 54: 122–132, 2011 [DOI] [PubMed] [Google Scholar]
- 28.Zhou Y, Jiang L, Rui L. Identification of MUP1 as a regulator for glucose and lipid metabolism in mice. J Biol Chem 284: 11152–11159, 2009 [DOI] [PMC free article] [PubMed] [Google Scholar]


