

Abstract
Deletions of claudin-2 (Cldn2) and aquaporin1 (AQP1) reduce proximal fluid reabsorption (PFR) by about 30% and 50%, respectively. Experiments were done to replicate these observations and to determine in AQP1/claudin-2 double knockout mice (DKO) if the effects of deletions of these established water pores are additive. PFR was determined in inactin/ketamine-anesthetized mice by free-flow micropuncture using single-nephron I125-iothalamate (io) clearance. Animal means of PFR [% of glomerular filtration rate (GFR)] derived from TF/Piothalamate ratios in 12 mice in each of four groups [wild type (WT), Cldn2−/−, AQP1−/−, and DKO) were 45.8 ± 0.85 (51 tubules), 35.4 ± 1 (54 tubules; P < 0.01 vs. WT), 36.8 ± 1 (63 tubules; P < 0.05 vs. WT), and 33.9 ± 1.4 (69 tubules; P < 0.01 vs. WT). Kidney and single-nephron GFRs (SNGFR) were significantly reduced in all mutant strains. The direct relationship between PFR and SNGFR was maintained in mutant mice, but the slope of this relationship was reduced in the absence of Cldn2 and/or AQP1. Transtubular osmotic pressure differences were not different between WT and Cldn2−/− mice, but markedly increased in DKO. In conclusion, the deletion of Cldn2, AQP1, or of both Cldn2 and AQP1 reduces PFR by 22.7%, 19.6%, and 26%, respectively. Our data are consistent with an up to 25% paracellular contribution to PFR. The reduced osmotic water permeability caused by absence of AQP1 augments luminal hypotonicity. Aided by a fall in filtered load, the capacity of non-AQP1-dependent transcellular reabsorption is sufficient to maintain PFR without AQP1 and claudin-2 at 75% of control.
Keywords: micropuncture, iothalamate, tubular fluid osmolarity, paracellular, transcellular
seemingly excessive amounts of water and solutes crossing the glomerular filtration barrier are reduced by the renal tubular epithelium to the small quantities that must be excreted in the urine to achieve fluid volume and blood pressure homeostasis. All segments of the nephron participate in this vital task of fluid and solute retrieval, but the greatest reabsorptive burden is carried by the proximal tubules of the nephron. The architecture of the proximal tubular epithelium suggests two principal pathways of transtubular movement: permeation through the epithelial cells (transcellular) or permeation between the epithelial cells (paracellular). There is agreement that solutes and water use both routes to gain access to the blood, but estimates of the magnitudes of transcellular vs. paracellular absorption rates have been difficult to establish. Nevertheless, measurements of transtubular and transmembrane fluxes by micropuncture, microperfusion, and membrane fractionation together with the subsequent identification and manipulation of the major solute transport proteins have yielded good estimates of the utilization of transcellular vs. paracellular transport routes for most solutes. In contrast, while there is some agreement that both transcellular and paracellular transport routes are used for the reabsorption of water, it is still unknown what fraction of the large volume of water absorbed across the proximal tubule cell barrier passes through the cells and how much moves between cells.
Transcellular absorption by simple osmosis is supported by the presence of a slight luminal hypotonicity of about 5–10 mosm and a corresponding absorbate hypertonicity that result from the active reabsorption of sodium mediated by the basolateral Na,K-ATPase, and that in view of a high water permeability of the proximal tubular epithelium is thought to be a sufficient driving force for the majority of transtubular water flux (2, 3, 15). This concept received strong support by the discovery that aquaporin1 (AQP1), a protein dedicated to the movement of water, is highly expressed in both apical and basolateral membranes of proximal tubule cells (31). Measurements in mice with complete deletion of the AQP1 gene have shown an 80% reduction in the osmotic water permeability coefficient and an about 50% decrease of net fluid reabsorption, findings that were interpreted as supporting a predominantly transcellular water flux in the proximal tubule mediated by AQP1 water channels (39). However, these results obviously do not exclude the possibility of some fraction of water reabsorption following a paracellular route.
Like transcellular water flux, the magnitude of paracellular fluid transfer has been difficult to quantify. In fact, its very existence has been questioned because the calculated osmotic permeability of the paracellular pathway was found to be vanishingly small compared with the transepithelial water permeability (4, 35). On the other end of the spectrum, paracellular water flow was estimated to account for as much as half of proximal fluid reabsorption based on the finding that transepithelial water permeability was roughly twice that of apical or basolateral membranes (6). Aside from daunting technical and interpretational difficulties, progress in this area has been hampered by the lack of specific ways to interfere with the paracellular permeation pathway. Identification of claudins and other critical protein constituents of the epithelial tight junctions has now opened a new way for targeted manipulation of the paracellular barrier function (13). Of specific relevance is the observation that the expression of claudin-2 in MDCK cells induces an osmotic and Na-dependent water flux that is not observed in cells lacking this protein (37). Claudin-2 is a tight junction protein with high expression in the proximal tubule (7), and net transepithelial water reabsorption was found to be reduced by 28% in isolated perfused proximal tubules of claudin-2-deficient mice (30).
The three main purposes of the present study were to replicate and quantify the inhibitory effect of claudin-2 deletion on net proximal fluid reabsorption by tubular micropuncture in vivo, to replicate the effect of AQP1 deletion in a larger group of nephrons, and to examine the additivity of the effects of these two proteins in claudin-2/AQP1 double-knockout mice. Our data confirm that the deletion of claudin-2 causes a significant reduction of proximal fluid reabsorption that is consistent with a contribution of the paracellular pathway of at least 25% of total proximal reabsorption. Unexpectedly, the effect of codeletions of both claudin-2 and AQP1 was not greater than the effects of either single deletion showing nonadditivity of their inhibitory effects. As was shown previously for AQP1 single knockouts, DKO mice develop a markedly enhanced transepithelial osmotic gradient that appears to provide a sufficient driving force to maintain fractional reabsorption at about 75% of control values.
METHODS
Animals.
Experiments were performed in male animals of three strains of mutant mice. Mice with targeted deletion of claudin-2 (Cldn2−/−) were obtained through the Mutant Mouse Regional Resource Center at University of California, Davis (strain designation B6;129S5-Cldn2tm1Lex/Mmucd). Beyond the use of 129/SvEvBrd ES cells for recombination, the mutation was maintained in a C57BL/6 background. To the extent possible, wild-type (WT) and knockout mice were from the same litters, and they were generated by breeding female Cldn2+/− with male Cldn2y/− (null because of x-linkage of the cldn2 gene). Breeder pairs of AQP1-deficient mice (AQP1−/−) were obtained from a colony kept by Dr. Heddwen Brooks at the University of Arizona. This colony was established using offspring of the original AQP1-null strain generated by Ma et al. (27). Because the null mutation had been maintained by inbreeding of homozygous mutants, there was a lack of directly comparable wild-type animals, a disadvantage that we tried to compensate for by comparisons with wild-type mice of different genetic backgrounds. Claudin-2/AQP1 double-deficient mice (DKO) were generated at the National Institutes of Health by crossing female AQP1−/− with male Cldn2y/− animals. Animals were kept on a standard diet (NaCl content 0.2%) and tap water. Genotyping was done on tail DNA by standard PCR using the following two primers for claudin-2: sense: 5′-CAGGCTCCGAAGATACTTC, and antisense: 5′-GTAGAAGTCCCGAAGGATG. The wild-type band of 478 bp is absent in the mutant mice. For the identification of the AQP1 genotype, three primers were used: sense: ACTCAGTGGCTAACAACAA ACAGGG, antisense 1: AAGTCAACCTCTGCTCAGCTGGG, and antisense 2: CTCTATGGCTTCTGAGG CGGAAAG. Products of 500 bp and 430 bp were obtained in wild-type or mutant DNA, respectively. Animal care and experimentation were approved and carried out in accordance with the National Institutes of Health's Guide for the Care and Use of Laboratory Animals (Animal Study Proposal no. K058-KDB-10).
Animal preparation.
For micropuncture experiments, mice were anesthetized with 100 mg/kg thiobutabarbital (inactin) intraperitoneally and 100 mg/kg ketamine subcutaneously. Body temperature was maintained at 37.5°C by placing the animals on an operating table with a servo-controlled heating plate. The trachea was cannulated, and a stream of 100% oxygen was blown toward the tracheal tube throughout the experiment. As determined by the MouseOx transcutaneous O2 detection method with a collar sensor (Starr Life Sciences, Oakmont, PA), anesthetized mice under our conditions have a mean O2 saturation of 92.3 ± 0.8% (n = 8); enriching O2 in the inspired air caused O2 saturation to increase to 99.1 ± 0.5%. In most cases, O2 administration was also associated with an increase of arterial blood pressure and a fall in heart rate. The left carotid artery was catheterized with hand-drawn polyethylene tubing for continuous measurement of arterial blood pressure and blood withdrawal. A catheter connected to an infusion pump was inserted into the right jugular vein for an intravenous maintenance infusion of saline at 400 μl/h. The bladder was exposed by a suprapubic midline incision, a urine sample was withdrawn by direct puncture for later measurements of osmolarity, and the bladder was cannulated for urine collections. After turning the animal on its right side, a transcutaneous incision was made after locally administering lidocaine followed by a flank incision to expose the left kidney. The kidney was carefully dissected free of surrounding fat and placed in a lucite holder. The opening of the cup at the hilum was obstructed with fat, and the kidney was covered with mineral oil. The time from anesthesia to completion of surgery was between 2 and 2.5 h.
Glomerular and tubular function of single nephrons.
To measure rates of proximal fluid reabsorption an infusion of 125I-iothalamate (Glofil-125, Iso-Tex Diagnostics, Friendswood, TX; ∼40 μCi/h) was started 20–25 min before micropuncture. Nephron filtration and absorption rates were determined by free-flow micropuncture, as previously described (19). Following tubular identification by dye injection, proximal collections were done in the last surface segment (collection times 2.5 min in most cases) using oil-filled pipettes. In a given animal, between 2 and 7 fluid samples were collected over a time span of up to 50 min. Fluid volume was determined from column length in a constant bore capillary. Samples were transferred into a counting vial, and radioactivity was determined in a gamma counter. Blood samples were collected in heparinized 5-μl microcaps at the beginning and at the end of the micropuncture period with the second sample being consistently higher than the initial one. Reference plasma concentrations for each sample were derived by linear interpolation. In four experiments, three plasma samples were collected in 20-min intervals. TF/Piothalamate ratios were identical whether plasma references were calculated with all three samples or only with the first and the third (1.57 ± 0.05 vs. 1.55 ± 0.04), supporting the notion that linear extrapolation over an up to 50-min time span is reasonable. 125I-iothalamate radioactivity was measured in duplicates of plasma and urine using Drummond 0.5-μl microcaps for sample transfer. In four experiments, plasma was collected at the end of the experiments and was subjected to ultrafiltration across Amicon Ultra NMWL 3000 filters. Ultrafiltrate 125I-iothalamate concentration was 11.3 ± 2.6% lower than plasma concentration, presumably because of protein binding, as suggested previously (36).
Tubular fluid osmolarity.
In an additional series of four wild-type, four claudin-2−/−, and four DKO mice end-proximal tubular samples were collected as described above. Micropuncture was followed by the collection of a terminal blood sample. Osmolarities in plasma and tubular fluid samples were determined by freezing point depression in a nanoliter microosmometer (Clifton Technical Physics, Hartford, NY) using an eight-hole cooling plate. Holes were filled with 1,325 cs immersion oil (Spectrum Chemical, Gardena, CA), and samples of approximately equal size were deposited in the center of the holes with the aid of a micromanipulator. Melting of the last ice crystal during slow warming (auto position) was taken as the freezing point. In each run, a two-point standard curve was established using 325 and 285 mosm/l standard solutions. Plasma osmolarity was determined by both micro- and macro- methods (Roebling).
Plasma chemistry.
A panel of electrolyte, glucose, urea, protein, and enzymes was measured in plasma taken from the carotid artery of mice shortly after the induction of ketamine/xylazine anesthesia (n = 6 of each genotype). Measurements were done by the Department of Laboratory Medicine, Clinical Center, Bethesda, MD, using standard methods.
Renal cortical mRNA.
Kidney cortex was homogenized, and RNA was isolated using the Qiagen RNeasy mini kit (no. 74104) with the DNase treatment using the Qiagen RNase-free DNase 1 kit (no. 79254). DNase treatment was necessary to remove any genomic DNA for use with claudin-9 and claudin-17 primer/probe sets, since they lie within a single exon. Reverse transcription was carried out using oligo (dt) 12–18 primer (Invitrogen; 18418–012) heated at 70° for 5 min and immediately put on ice. A mixture of 0.1 M DTT, 5× first-strand buffer, and superscript II reverse transcriptase (Invitrogen 18064–014), 10 mM NTP (NEB no. N0447S), and Protector RNase Inhibitor (Roche no. 03335402001) was added to the sample and brought to 42° for 45 min, 70° for 10 min, and then stored at 4°. Twenty-five nanograms cDNA was run on the Applied Biosystems 7900 Sequence Detector using the following primer/probe sets for AQP1, 7, 8, and 11, and claudin-2, 6, 9, 10, 11, and 17 and HPRT: claudin-2 Mm00516703_s1, claudin-6 Mm01309194_m1, claudin-9 Mm00517434_s1, claudin-10 Mm00457974_m1, claudin-11 Mm00500915_m1, claudin-17 Mm00626967_s1, AQP 1 Mm00431834_m1, AQP 7 Mm00431839_m1, AQP 8 Mm00431846_m1, AQP 11 Mm00613023_m1, and HPRT Mm03024075_m1.
Statistics.
Values in the text are means ± SE. Statistical comparisons between two groups were made by t-test and between the four groups of mice used in this study by one-way ANOVA with Bonferroni post hoc test. A P value <0.05 was assigned statistical significance.
RESULTS
Kidney function.
Four groups of male mice were used in the present experiments with 12 animals per group. Descriptive metrics are summarized in Table 1. Body weights of AQP1−/− and DKO were about 10–15% lower than WT and Cldn2−/− animals, and this was related to their younger age. Chronic diuresis in the AQP1-deficient mice leads to progressive hydronephrosis with potential secondary consequences that we attempted to minimize by experimentation at a younger age. Despite the difference in body weight, kidney wet weights were not significantly different between groups resulting in an increase in the kidney/body weight ratio in the AQP1-deficient mice. This is possibly due to a greater medullary water content in the diuretic AQP1−/− animals. The osmolarity of urine aspirated from the exposed bladder in the course of the animal preparation was markedly lower in the two strains with AQP1 deficiency than in WT or Cldn2−/− mice, and the nonoverlapping nature of this difference provides a second and independent verification of the AQP1-null genotype (Fig. 1). Urine osmolarity tended to be lower in Cldn2−/− mice (by 13%), but this difference was not significant. This is qualitatively similar to an earlier observation in another strain of Cldn2−/− mice, in which an osmolarity reduction by 25% was observed in 24-h urine samples (29). Urine volumes during micropuncture were not different between WT and Cldn2−/− mice, but there was an about 3- or 4-fold increase in the AQP1−/− animals consistent with earlier observations (27). The increase in urine flow was accompanied by significant decrements in fractional fluid absorption as determined from U/Piothalamate ratios. Glomerular filtration rate (GFR) was significantly lower in both AQP1−/− (n = 12) and DKO (n = 12) than wild-type mice (WT; n = 12) regardless of whether comparisons were made with uncorrected values or whether data were normalized for body or kidney weight. GFR of Cldn2−/− mice (n = 12) was also lower than WT in both uncorrected and body weight corrected terms. Hematocrit values were higher in AQP1−/− mice, and they increased over the experimental period of about 1 h in all strains of mice reaching significance compared with WT in the two strains with AQP1 deficiency. Mean arterial blood pressure during the micropuncture phase of the experiment was not significantly different between strains. Plasma chemistry was found to be similar between WT and Cldn2−/− (n = 6 in each genotype) and between WT, AQP1−/−, and DKO, respectively (n = 6 in each genotype). Data are shown in Tables 2 and 3.
Table 1.
Kidney function and general animal metrics of WT, Cldn2−/−, AQP1−/−, and DKO mice
| Wild Type (n = 12) | Cldn2−/− (n = 12) | AQP1−/− (n = 12) | DKO (n = 12) | |
|---|---|---|---|---|
| BW, g | 33 ± 1.07 | 31.2 ± 1.5 | 28.9 ± 0.9 | 28 ± 1.2** |
| KW, mg | 394 ± 23 | 325 ± 14 | 399.5 ± 15 | 412 ± 29.5 |
| KW right/KW left | 1.13 ± 0.03 | 1.12 ± 0.03 | 1.14 ± 0.04 | 1.14 ± 0.03 |
| KW/BW, mg/g | 11.9 ± 0.44 | 10.5 ± 0.3 | 13.8 ± 0.3* | 14.7 ± 0.6*** |
| Age, wk | 20.9 ± 2.7 | 18.4 ± 1.9 | 13.1 ± 2.1* | 10.6 ± 0.65** |
| GFR, μl/min | 504.5 ± 43 | 344 ± 45* | 309 ± 35** | 314 ± 28.8** |
| GFR, μl/min ·100 g BW | 1621.5 ± 157 | 1312 ± 142* | 1150 ± 112* | 1105 ± 101* |
| GFR, μl/min · g KW | 1291 ± 107 | 1170 ± 113 | 780 ± 84** | 784 ± 82** |
| UV, μl/min | 1.5 ± 0.15 | 1.45 ± 0.17 | 4.8 ± 0.5*** | 5.9 ± 0.5*** |
| U/Piothalamate | 363 ± 36 | 262 ± 32.5* | 66.6 ± 7.6*** | 56.5 ± 7.1*** |
| Uosm, mosmol/l | 2139 ± 129 | 1891 ± 139 | 625 ± 14*** | 568 ± 13*** |
| Hctinitial | 43.4 ± 0.8 | 46 ± 1.5 | 47.8 ± 1.3 | 44.8 ± 1.6 |
| Hctend | 45.6 ± 0.7 | 49 ± 1.7 | 50.5 ± 0.7** | 50.8 ± 0.7** |
| MAP, mmHg | 104 ± 2 | 111 ± 3.4 | 106 ± 2.2 | 114 ± 2.7 |
GFR, glomerular filtration rate; MAP, mean arterial blood pressure during micropuncture; UV, urine flow rate; Uosm, urine osmolarity in bladder urine; U/Piothalamate, urine/plasma ratio for iothalamate; Hct, hematocrit (subscripts “initial” and “end” refer to blood samples taken at the beginning and end of the micropuncture period); BW, body weight; KW, kidney weight.
P < 0.05,
P < 0.01,
P < 0.001 (ANOVA with Bonferroni post hoc test; significances given for comparison with wild type).
Fig. 1.

Urine osmolarity (left) and urine/plasma ratio for iothalamate (U/Piothalamate) (right) in WT, Cldn2−/−, AQP1−/−, and DKO mice. Symbols are animal means, and lines indicate average values. Urine osmolarity was determined in bladder urine aspirated during animal preparation, while U/Piothalamate was measured in urine collected during the micropuncture period. Significances are given for comparison with WT (ANOVA with Bonferroni post hoc test with P < 0.05 significance level).
Table 2.
Plasma chemistry in Cldn 2−/−/AQP1−/−, AQP1−/−, and respective WT mice (n = 6 in each genotype)
| WT |
AQP1−/− |
DKO |
||||
|---|---|---|---|---|---|---|
| Mean | SD | Mean | SD | Mean | SD | |
| Age, wk | 23.7 | 7.00 | 21.6 | 0.27 | 21.5 | 0.34 |
| Body weight, g | 35.7 | 5.28 | 32.2 | 2.19 | 27.8 | 2.73 |
| Sodium, mmol/l | 150.0 | 1.63 | 149.3 | 1.97 | 152.5 | 2.22 |
| Potassium, mmol/l | 3.7 | 0.29 | 3.7 | 0.25 | 3.3 | 0.56 |
| Chloride, mmol/l | 112.5 | 1.89 | 110.5 | 1.80 | 112.3 | 2.36 |
| Calcium, mmol/l | 2.3 | 0.10 | 2.4 | 0.11 | 2.2 | 0.12 |
| Magnesium, mmol/l | 0.9 | 0.06 | 0.9 | 0.08 | 0.9 | 0.07 |
| Inorganic phosphorus, mg/dl | 8.1 | 0.67 | 7.6 | 0.68 | 7.7 | 1.06 |
| Glucose, mg/dl | 406.5 | 48.65 | 349.3 | 41.02 | 315.8 | 33.64 |
| BUN, mg/dl | 24.3 | 2.62 | 22.8 | 2.19 | 37.2 | 27.27 |
| Creatinine, mg/dl | 0.1 | 0.00 | 0.1 | 0.00 | 0.2 | 0.19 |
| Uric acid, mg/dl | 0.4 | 0.21 | 0.3 | 0.04 | 0.1 | 0.07 |
| Albumin, g/dl | 3.0 | 0.36 | 3.2 | 0.26 | 3.1 | 0.21 |
| Total protein, g/dl | 5.1 | 0.29 | 5.2 | 0.34 | 5.0 | 0.25 |
| Cholesterol, mg/dl | 177.8 | 32.93 | 187.0 | 20.64 | 191.5 | 54.59 |
| Triglycerides, mg/dl | 78.5 | 23.32 | 78.0 | 23.35 | 88.7 | 25.49 |
| Alkaline phosphatase, U/l | 79.7 | 18.19 | 90.8 | 30.60 | 109.2 | 56.14 |
| ALT/GPT, U/l | 35.8 | 15.28 | 36.3 | 6.55 | 30.3 | 5.50 |
| AST/GOT, U/l | 97.3 | 80.00 | 129.0 | 56.62 | 115.8 | 31.94 |
| Amylase, U/l | 2743.5 | 541.64 | 2531.5 | 267.73 | 2694.8 | 692.25 |
| CK, U/l | 512.7 | 503.20 | 850.2 | 473.83 | 853.5 | 407.94 |
| LD, U/l | 283.0 | 250.75 | 326.7 | 143.75 | 264.7 | 63.36 |
BUN, blood urea nitrogen; ALT, alanine aminotransferase; GPT, glutamic-pyruvic transaminase; AST, aspartate aminotransferase; GOT, glutamic oxaloacetic transaminase; CK, creatine kinase; LD, lactate dehydrogenase.
Table 3.
Plasma chemistry in Cldn 2−/− and WT mice (n = 6 in each genotype)
| WT |
Cldn 2−/− |
|||
|---|---|---|---|---|
| Mean | SD | Mean | SD | |
| Age, wk | 23.6 | 0.0 | 34.24 | 15.09 |
| Body weight, g | 38.7 | 4.5 | 35.83 | 7.99 |
| Sodium, mmol/l | 152.0 | 2.1 | 150.7 | 2.81 |
| Potassium, mmol/l | 3.7 | 0.4 | 3.57 | 0.66 |
| Chloride, mmol/l | 114.7 | 2.3 | 115.3 | 2.05 |
| Calcium, mmol/l | 2.3 | 0.1 | 2.16 | 0.07 |
| Magnesium, mmol/l | 0.9 | 0.1 | 0.98 | 0.11 |
| Inorganic phosphorus, mg/dl | 7.6 | 1.0 | 8.07 | 0.92 |
| Glucose, mg/dl | 251.0 | 31.6 | 358.7 | 57.2 |
| BUN, mg/dl | 23.8 | 8.4 | 27.67 | 3.64 |
| Creatinine, mg/dl | 0.1 | 0.0 | 0.10 | 0.00 |
| Uric acid, mg/dl | 0.3 | 0.3 | 0.22 | 0.09 |
| Albumin, g/dl | 2.5 | 0.4 | 2.82 | 0.28 |
| Total protein, g/dl | 4.6 | 0.2 | 4.77 | 0.29 |
| Cholesterol, mg/dl | 105.2 | 20.3 | 117.50 | 26.76 |
| Triglycerides, md/dl | 82.0 | 24.1 | 78.50 | 10.6 |
| Alkaline phosphatase, U/l | 54.8 | 12.5 | 57.83 | 15.31 |
| ALT/GPT, U/l | 21.2 | 4.9 | 22.67 | 3.30 |
| AST/GOT, U/l | 43.8 | 11.0 | 43 | 7.51 |
| Amylase, U/l | 2254 | 604.9 | 2738 | 369.2 |
| CK, U/l | 321.7 | 153.8 | 359.2 | 236.7 |
| LD, U/l | 141.5 | 41.2 | 155 | 76 |
Nephron function.
Measurements of TF/Piothalamate in individual tubules are shown in Fig. 2A. Average TF/Piothalamate of single nephrons was 1.87 ± 0.04 in WT (12 mice, 51 tubules), and this was significantly higher at P < 0.001 than the mean values of 1.57 ± 0.03 in Cldn2−/− (12 mice, 54 tubules), 1.61 ± 0.03 in AQP1−/− (12 mice, 63 tubules), and 1.56 ± 0.03 in DKO (12 mice, 69 tubules). There were no significant differences among the different strains of mutant mice. Fractional fluid reabsorption calculated from these data was 45.4 ± 1.07% in WT, 35.1 ± 1.16% in Cldn2−/−, 36.3 ± 1.18% in AQP1−/−, and 34.3 ± 1.26% in DKO (Fig. 2B). Because of uncertainties concerning the genetic background of WT mice, we have also averaged all measurements made in WT animals over the past 4 years in our laboratory, thereby maximally diversifying the genetic and environmental mix (WT mice of the following strains are included: SAD transgenic for the sickle Hb SAD-C57BL/6J; A1ARtg transgenic for A1AR receptor-FVB; Akita-C57BL/6; β1/β2ADR knockout-FVB/C57/129SvJ; SP Sweet Pee knockout for SGLT2-C3H; AT1FF with floxed AT1 angiotensin receptor-129/SvEv; MMA methylmalonic acidemia model-C57BL/6). This overall average of the TF/Piothalamate ratio was 1.84 ± 0.02 (40 mice, 180 tubules), corresponding to a fractional fluid absorption of 44.5 ± 0.62%, not different from the present WT data, but significantly higher than the mutant animals of this study. Iothalamate-based measurements may underestimate fractional fluid reabsorption by about 10% because of the effects of plasma binding.
Fig. 2.

Fractional reabsorption along the proximal tubule accessible for micropuncture in WT mice and in Cldn2−/−, AQP1−/−, and DKO mice. A: tubular fluid/plasma iothalamate ratios (TF/Piothalamate) measured at the end of the proximal convoluted tubules; symbols represent individual tubules. Solid lines are mean values, and dotted lines indicate 95% confidence intervals. Values in the last column (all WT) represent all measurements in wild-type mice from different experimental groups performed over the past 4 years in this laboratory. Numbers in parentheses are numbers of mice/tubules. B: mean fractional fluid reabsorption expressed as % of GFR in the four experimental groups and in the wild-type control group (All WT). Values are expressed as means ± SD. Significances are indicated for comparisons with WT (ANOVA with Bonferroni post hoc test with P < 0.05 significance level).
Determinations of single-nephron filtration rate (SNGFR) in the same tubules of the four experimental strains are shown in Fig. 3A. Mean SNGFR of WT mice was 16.2 ± 0.64 nl/min, and this was significantly higher (P < 0.001 by ANOVA) than the mean SNGFRs of 10.6 ± 0.52 nl/min in Cldn2−/−, 9.8 ± 0.49 nl/min in AQP1−/−, and 10.1 ± 0.4 nl/min in DKO animals. When expressed as animal means rather than tubule means, values were 15.7 ± 0.6 nl/min, 10.5 ± 0.87 nl/min, 9.2 ± 1.1 nl/min, and 10 ± 0.66 nl/min in WT, Cldn2−/−, AQP1−/−, and DKO, respectively. Mean SNGFR of the comprehensive WT cohort was 14.0 ± 0.37 nl/min, significantly higher than all three groups of mutant mice (P < 0.001 by ANOVA). The decrease of SNGFR compared with wild type by 33.1%, 41.7%, and 36.6% in Cldn2−/−, AQP1−/−, and DKO was similar to the decrease of kidney GFR by 31.8%, 38.7%, and 37.8% in the three strains of mice, indicating that there is a direct relationship between mean SNGFR per animal and kidney GFR (Fig. 4). The reduction in both SNGFR and fractional fluid reabsorption caused an amplification in the fall of absolute rates of fluid reabsorption along the proximal convolution by ∼50% in all groups of mutant mice (Fig. 3B). The conclusion that SNGFR is a major determinant of fluid reabsorption in all strains studied is supported by the consistent correlation between SNGFR and net fluid flux as shown in Fig. 5. In WT mice, absorption increased with increasing SNGFR with a slope of 0.5 ± 0.04 (r2 = 0.77). Importantly, glomerulotubular balance (GTB) was well maintained in the absence of AQP1 and/or claudin-2. Slopes of the linear regression lines were very similar in the three groups of mutant mice (AQP1−/−: slope 0.41 ± 0.034, r2 = 0.7; Cldn2−/−: slope 0.44 ± 0.028, r2 = 0.82; DKO: slope 0.44 ± 0.039, r2 = 0.66), and about 10–15% lower than in WT animals. Thus, the change of fluid reabsorption for a 10 nl/min change of SNGFR is calculated to be 5.0 nl/min for WT and about 4.4 nl/min for the mutant mice (Fig. 5F).
Fig. 3.

Glomerular filtration rate (GFR) in single nephrons (SNGFR) and fluid reabsorption rate in WT mice and in Cldn2−/−, AQP1−/−, and DKO mice. All WT refers to all measurements in wild-type mice from different experimental groups performed over the past 4 years in this laboratory. A: SNGFR using flow rates at the end of the proximal convoluted tubules; symbols represent individual tubules. Solid lines are mean values, and dotted lines indicate 95% confidence intervals. B: rate of fluid reabsorption in the four experimental groups and in the wild-type control group (All WT). Values are expressed as means ± SD. Significances are indicated for comparisons with WT (ANOVA with Bonferroni post hoc test at P < 0.05 significance level).
Fig. 4.

Relationship between kidney GFR (μl/min) and mean SNGFR for the 48 mice used in this study. Each symbol represents one animal without consideration of genotype. The line shows the linear regression function.
Fig. 5.

Relationship between rates of proximal fluid reabsorption and glomerular filtration rate (SNGFR) in WT mice (A), and in Cldn2−/− (B), AQP1−/− (C), and DKO mice (D), as well as for the overall wild-type group (E). F: direct comparison of the linear regression lines is shown: regression lines for the wild-type cohorts and for the three mutant strains fall on top of each other; the ovals indicate normal operating ranges for WT and mutant mice. Solid lines are linear regressions and dotted lines are 95% confidence intervals.
Our observations in a sufficiently large number of mice revealed that the scatter in fractional reabsorption and SNGFR between individual tubules seen in Figs. 2A and 3A does not appear to be solely random, but that it is, at least in part, an expression of marked differences between individual mice. TF/Piothalamate ratios and SNGFRs averaged for each individual mouse are shown in Fig. 6 and Fig. 7. It can be seen that differences between individual mice exist in all groups that can reach significance when tested by ANOVA. There was no apparent correlation between fractional absorption and SNGFR in individual mice. This variability between mice can be larger than the genotype-dependent difference between overall mean values. When comparing fractional reabsorption in single mutant mice to all WT data by ANOVA, only 6 Cldn2−/−, 5 AQP1−/−, and 7 DKO animals were significantly different from the WT average. None of the individual measurements can be eliminated as outliers with either the Grubbs' test or the Chauvenet criterion. Incorrect genotyping can be essentially excluded in the case of the AQP1−/− and DKO mice because of the strict separation in urinary osmolarity and U/Piothalamate ratios (Fig. 1). Since samples from individual tubules cannot be considered independent, statistical analysis was performed using animal means (Fig. 8). This analysis confirmed that there is a significant reduction of fractional reabsorption and SNGFR in mice without claudin-2 and/or AQP1 compared with wild-type animals.
Fig. 6.

TF/Piothalamate ratios in individual WT, Cldn2−/−, AQP1−/−, and DKO mice (labeled 1–12 in each genotype). Bars show means ± SD. Numbers inside the bars are numbers of tubules in each animal. Dotted line indicates the mean for each genotype, and stippled lines reproduce the mean of WT mice. Lines above the bars extend between mice that are significantly different from each other (ANOVA with Bonferroni post hoc test with P < 0.05 or less). Stars inside bars indicate significance vs. mean WT at P < 0.05 or less (ANOVA with Bonferroni post hoc test).
Fig. 7.

Nephron filtration rates (SNGFR) in individual WT, Cldn2−/−, AQP1−/−, and DKO mice (labeled 1–12 in each genotype). Bars show means ± SD. Numbers inside the bars are numbers of tubules in each animal. Dotted line indicates the mean for each genotype, and stippled lines reproduce the mean of WT mice. Lines above the bars extend between mice that are significantly different from each other (ANOVA with Bonferroni post hoc test with P < 0.05 or less). Stars inside bars indicate significance vs. mean WT at P < 0.05 or less (ANOVA with Bonferroni post hoc test).
Fig. 8.

TF/Piothalamate ratios (top), proximal fluid reabsorption in % of GFR (middle), and SNGFR (bottom) in WT, Cldn2−/−, AQP1−/−, and DKO mice, as well as in WT mice of various strains (All WT). Each symbol is the average of 2–7 measurements in an individual animal (n = 12 in each genotype). Lines indicate mean values. Significances are indicated for comparisons with WT (ANOVA with Bonferroni post hoc test).
Tubular fluid osmolarity.
Plasma osmolarity in wild-type mice prepared for micropuncture in the same way as in the SNGFR studies averaged 310 ± 1.75 mosm/l when measured by the micromethod (317 ± 2.2 mosm/l by macromethod; 4 mice). Tubular fluid osmolarity in end-proximal samples had a mean of 302.5 ± 4.4 mosm/l (n = 17) resulting in a mean TF/Posm of 0.98 ± 0.01. In Cldn2−/− mice, plasma osmolarity averaged 320.5 ± 4.9 mosm/l (322 ± 1.8 by macromethod; n = 4), and tubular fluid 313.6 ± 2.3 mosm/l (n = 19), resulting in a mean TF/Posm of 0.98 ± 0.01. Plasma osmolarity of DKO mice was 322.5 ± 1.4 mosm/l (327 ± 1.1 mosm/l by macromethod; n = 4) and tubular fluid osmolarity averaged 283 ± 3.9 mosm/l (n = 18). TF/Posm was 0.875 ± 0.01 (P < 0.001 compared with wild-type or Cldn2−/−). Transepithelial osmotic gradients expressed as the difference between plasma and end-proximal tubular fluid averaged 7.1 ± 4.2 mosm/l, 5.4 ± 2.9 mosm/l (P = 0.74 vs. WT), and 37.3 ± 3.7 mosm/l (P < 0.0001 vs. WT) in WT, Cldn2−/− and DKO, respectively (Fig. 9).
Fig. 9.

Transepithelial osmotic gradients, the differences between plasma and tubular fluid osmolarities, in WT, Cldn2−/−, and DKO mice. Bars show means, and vertical lines indicate SE. The right columns labeled WT and AQP1−/− are from an earlier study in our laboratory (42). The factor by which the osmotic difference in AQP1-deficient strains exceeds respective WT values is indicated above the bars.
Expression of claudin and AQP mRNA.
Gene expression of claudins and aquaporins that have been found previously in the proximal tubule was determined by real-time RT-PCR in small samples of renal cortical tissue (n = 10 for each genotype). As shown in Fig. 10, AQP1 is by far the dominant aquaporin in the renal cortex with significant expression of AQP11, and very low levels of AQP7 and AQP8. In the claudin gene family, claudin-2 is most highly expressed. There is also a strong expression of claudin-10 (without distinguishing between claudin-10a and 10b), while all other claudins are expressed at levels of less than 1% of claudin-2. Comparisons of claudin and AQP gene expression in the mutant strains compared with WT are shown in Fig. 11. There was a significant upregulation of claudin-9 expression in Cldn2−/− mice and a tendency for upregulation of the same gene in AQP−/− mice. Levels of AQP8 were downregulated in AQP1−/− and DKO. Absence of claudin-2 mRNA in Cldn2−/− and DKO and of AQP1 mRNA in AQP1−/− and DKO confirmed the genotype of the mice.
Fig. 10.

Expression of mRNAs of proximal claudins (left) and aquaporins (AQ) (right) in renal cortical tissue of wild-type mice. Data are expressed as a percentage of claudin-2 and aquaporin1, respectively. Data are means, and vertical lines indicate standard deviations (n = 10).
Fig. 11.
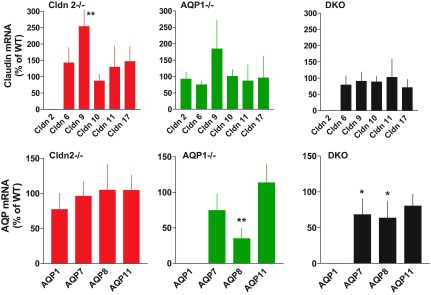
Expression of mRNAs of claudins (upper) and aquaporins (lower) in Cldn2−/− (n = 10), AQP1−/− (n = 10), and DKO mice (n = 10). Data are expressed using wild-type expression levels for each claudin or aquaporin as 100% reference. Data are means, and vertical lines are standard deviations. *P < 0.05, **P < 0.01 (compared to WT by t-test).
DISCUSSION
Previous in vivo studies in gene-modified mice have shown that claudin-2 and AQP1 are two proteins with direct involvement in transtubular water transport in the renal proximal tubule. A null mutation in the claudin-2 gene caused a reduction of net water reabsorption by about 30%, while deleting AQP1 reduced proximal fluid flux by about 50% (30, 39). Because of the location of AQP1 in apical and basolateral cell membranes and of claudin-2 in tight junctions, it is reasonable to assume that the AQP1- and claudin-2-dependent flux fractions represent water movement along transcellular and paracellular routes, respectively. Thus, an assessment of the absorptive deficits caused by single and combined deletions of claudin-2 and AQP1 should yield reasonable estimates of the contribution of paracellular and transcellular routes to proximal water transport. Our observations in Cldn2−/− mice indicate that ∼25% of near-isotonic fluid reabsorption in the proximal tubule requires the presence of claudin-2 and might, therefore, use the paracellular route. The absence of AQP1 creates a transepithelial osmotic difference that permits 75% of proximal fluid reabsorption to follow a non-AQP1-dependent transcellular pathway both in the absence and presence of claudin-2. The effectiveness of AQP1-independent transcellular mechanisms is aided by marked reductions in filtered fluid loads and, therefore, in the absorptive burden.
Identification of the protein components of tight junctions has created the potential of targeted alterations of tight junction composition and, therefore, of tight junction water and ion permeabilities (13). Specifically, expression of the tight junction protein claudin-2 in MDCK cells that do not express the protein endogenously (MDCK I, MDCK C7) has been found to reduce transepithelial resistance and to increase cation and water permeability, indicating that this particular protein has pore-forming properties (1, 14, 37). These findings are fully consistent with the demonstration of a 37% reduction of net Na flux and a 28% reduction of net water reabsorption in perfused proximal tubules of mice with a targeted deletion of claudin-2 (30). The present results confirm these findings in vivo in that Cldn2−/− mice have a reduction of fractional proximal fluid reabsorption by 23.5%. Claudin-2 expression in the proximal tubule has been found to increase along its longitudinal axis with lower levels in S1 than in S2 or S3 segments (7). This may explain the somewhat lower estimate of claudin-2 dependency of fluid reabsorption in our study, since S1 segments are included in the micropuncture experiments, whereas tubule perfusion was done in S2 segments selectively (30). Estimates of tight junction water flux from claudin-2 dependency may be a lower bound limit of paracellular water absorption, since other tight junction proteins could contribute to water transfer. Several claudins have been shown to increase the conductance for either cations or anions, but up until now, no other claudin besides claudin-2 has been found to confer water permeability to epithelial cell layers (16). Deletion of the tight junction-specific protein occludin had no effect on the barrier function in gastrointestinal epithelia, and suppression of occludin levels in MDCK cells by siRNA increased rather than decreased the permeability of a number of charged solutes (40, 45).
Previous evidence for paracellular movement of water in proximal tubules includes a strong correlation between water flux and absorption of membrane-impermeable solutes, the demonstration of solvent drag on the absorption of small ions, and a transepithelial water permeability much greater than water permeabilities of individual cell membranes (5, 6, 12, 43). A magnitude of paracellular water flux of around 25% does not seem unreasonable on the basis of calculations of proximal Na absorption by solvent drag (12), but markedly higher and markedly lower estimates of paracellular water flux have been proposed (6, 35). While the effect of claudin-2 deficiency is consistent with utilization of a paracellular pathway for at least 25% of proximal fluid reabsorption, it is unclear whether the changes in tight junction cation conductance or in water permeability are the primary cause for a reduced paracellular fluid flux. If a significant solvent flow is, indeed, carried across the paracellular shunt as the solvent drag effect on small ions suggests, the alteration in claudin-2-dependent water permeability could be the primary impediment. In this case, a transepithelial driving force for near-isotonic paracellular fluid absorption would have to be postulated that might be the osmolarity difference created by active Na transport and/or the transtubular hydraulic and oncotic pressure gradients. On the other hand, if paracellular diffusion of Na along its electrochemical gradient is secondarily coupled to water movement, the critical change in the claudin-2-deficient mice may be the reduced Na conductance. This process would be restricted to S2 and S3 segments because of the absence of an electrochemical driving force for passive Na reabsorption in S1 segments. This scenario would be consistent with a role of the Na current across the tight junction causing fluid movement by electro-osmotic coupling, as has been suggested for the corneal endothelium and for some epithelia (10). If one disregards all previous evidence for paracellular water transport, it would also be consistent with paracellular diffusion of Na, creating an osmotic gradient for water movement through AQP1 channels. Such use of alternate pathways for Na and water may be less likely in MDCK cells in which a claudin-2-dependent water flux could be induced by a Na concentration gradient in the absence of an osmotic gradient (37).
The present results in AQP1−/− mice confirm our earlier finding that proximal fluid reabsorption is significantly reduced, although the reduction in fractional proximal fluid reabsorption by 25% was markedly less than the ∼50% decrease reported previously (39). The cause for this quantitative difference is likely to be biological, since data were obtained with identical technical approaches in the same laboratory. It is conceivable that AQP1−/− mice have undergone changes in genetic background that permit relative compensation for the reduced absorptive capacity. Genetic drifts are not implausible because of the elapsed time and the strategy of AQP1-null inbreeding. However, a more likely explanation may be the identification in the present experiments of a strong animal-specific bias in proximal fractional reabsorption. Significant differences in proximal reabsorption were found between individual mice that were unrelated to the genotype of the animals. For example, of the 12 AQP1−/− mice studied, only 5 mice or about 40% had a mean individual fractional reabsorption that was significantly different from the overall WT average, while 7 were statistically indistinguishable from WT. Similar differences within genotypes were observed in Cldn2−/− and DKO, while the diversity was less pronounced in WT mice. Technical differences cannot be excluded as causes for these differences, although the experiments were performed in standardized fashion under standardized conditions. Biological differences may, therefore, be more likely, and they may reflect variations in the expression levels of transport proteins, lipid composition, or morphological characteristics. Regardless of the true causes, the implication would be that two groups of mice studied at different times may yield different quantitative outcomes dependent upon the specific mix of animals. It is important to point out that the interindividual variability only affects the quantitative aspect, but not the ability to statistically discriminate between two population means.
Because paracellular fluxes through claudin-2 and transcellular fluxes through AQP1 are spatially distinct, we expected the effects of deletions of AQP1 and claudin-2 to be additive. However, a surprising outcome of our study is the result that the effects of single deletions of claudin-2 or AQP1 were statistically identical to that of a combined deletion of both of these proteins. A possible interpretation of this observation would be the assumption that water fluxes mediated by AQP1 and claudin-2 are interdependent, perhaps similar to the interaction in salivary glands in which the deletion of AQP5 reduced both saliva production and the secretion of FITC-labeled dextran, suggesting that paracellular permeability is somehow dependent upon AQP5 function (22). While such interactions cannot be excluded, it is striking that AQP1 deficiency both on WT and Cldn2−/− backgrounds leads to a three- to five-fold increase in the osmotic gradient across proximal tubules, so that water may be reabsorbed across the membrane bilayer by simple osmosis (42). Water permeability of lipid membranes depends on the lipid composition with cholesterol-rich membranes being, in general, less water-permeable (8, 9). Although renal brush-border membrane lipid composition is not unusual in its cholesterol-phospholipid content, so that a strong case for facilitated partitioning into the lipid phase cannot be made, the magnification of the proximal membrane area by apical microvilli and basolateral infoldings provides an enormously magnified surface for unaided membrane permeation (29, 34). Non-AQP1-mediated water transport could also involve ion-linked cotransporters, especially the Na/glucose cotransporter, or a number of other proteins that have been suggested to have the potential for transmembrane water conduction, but for which direct experimental evidence in the proximal tubule is not yet available (11, 18, 25, 32, 44, 46). The present data in DKO mice suggest that a 1-mosm gradient can drive a flux of 0.09 nl/min across a non-AQP1-dependent transcellular pathway. This apparent permeability would permit an absorption of about 0.8 nl/min at the normal osmotic gradient of wild-type mice, corresponding to ∼15% of total fluid reabsorption and suggesting that 85% normally uses a water channel. The development of an augmented luminal hypotonicity in response to a reduction of osmotic water permeability has been predicted more than a decade ago (23). A recent mathematical model of the effects of AQP1 deficiency also came to the conclusion that the steady-state in the absence of AQP1 is characterized by an increase of the transepithelial osmotic gradient, as water permeability decreases and that nonlinearities in the relationship between water flux, water permeability, and salt transport can explain the larger effect of AQP1 loss on water permeability than on water flux (28). A corollary of the increased osmotic gradient is a reduction in salt transport that has been predicted by both models and that may be the result of increased paracellular Na backflux or of a less favorable Na gradient for active transport (23, 28). As diagrammatically summarized in Fig. 12, our data suggest that proximal fluid reabsorption in WT mice is divided between transcellular and paracellular routes in an ∼4:1 ratio, and that the majority of transcellular movement utilizes AQP1. When the paracellular pathway is occluded by claudin-2 absence, fluid reabsorption is entirely transcellular and proceeds at a reduced rate both because paracellular flux is abolished and because GFR drops. Fluid reabsorption in DKO mice occurs through transcellular non-AQP1-dependent routes and is driven by the several-fold increase in osmotic driving force and aided by the reduction in filtered load. A similar process drives transcellular fluid reabsorption in AQP1−/− mice; in addition, we assume that paracellular flux is reduced by paracellular ion back flux and reduced solvent drag.
Fig. 12.

Diagrammatic data summary showing magnitudes and pathways of absolute rates of fluid reabsorption along the proximal convoluted tubule calculated from SNGFR and fractional reabsorption for WT, Cldn2−/−, DKO, and AQP1−/− strains. Data for TF/Posm in AQP1−/− mice are from our earlier work (41). L, tubular lumen; I, interstitium.
Reductions of glomerular filtration rate are a common feature of all mutant strains with proximal fluid malabsorption used in this study. The validity of the SNGFR determinations is supported by a highly significant correlation between kidney and nephron GFRs across all strains used in this study (Fig. 4). Previous observations in Cldn2−/− mice have not shown a reduction in GFR using 24-h creatinine excretion, but the differences in techniques make direct comparisons difficult (30). GFR and SNGFR values in both wild-type and AQP1−/− mice were higher than reported in our earlier experiments (39). We believe that this is mainly due to a more rigid adherence to a 40–50-min time limit for micropuncture and to the use of younger and healthier animals. Nevertheless, our observations are fully in agreement with earlier evidence for a link between an inhibition of proximal fluid transport and a reduction of GFR in both rats and mice (17, 21, 26, 33, 41). Reductions of the tubular fluid load are a highly effective way to limit nonhomeostatic renal fluid loss in states of proximal malabsorption (38). In the present experiments, absolute reabsorption in the mutant mice decreased by about 50% due to the fact that filtration rate and, therefore, filtered fluid load fell, whereas fractional reabsorption was reduced only by ∼20–25%. The current experiments were not designed to examine the causes for this relationship, but it has been tempting to speculate that the fall in GFR might be the consequence of an activation of tubuloglomerular feedback (TGF) by the increased distal delivery of NaCl (33, 41). Previous evidence from AQP1- and NHE3-deficient mice has indicated that this can, indeed, be the case since the fall in SNGFR was more pronounced when the TGF mechanism was functional (26, 39). However, in the present study, a fall of SNGFR was observed in proximal fluid collections, where TGF is acutely inactivated by fluid withdrawal before the distal sensor site. Therefore, it is likely that the mechanisms behind the fall of GFR in states of proximal malabsorption are multifactorial. There is evidence that TGF-independent reductions of GFR could result from increases in tubular pressure, reductions in renal blood flow, and from the complex consequences of extracellular volume depletion (21, 24). Elevated hematocrit values in mutant mice in the micropuncture phase suggest the existence of volume depletion in the present study.
Flow-dependent fluid reabsorption (GTB) is a robust phenomenon that describes the positive and near-linear relationship between proximal flow rate (usually single-nephron GFR) and the rate of net fluid transfer. The present results clearly demonstrate a strong correlation between spontaneous variations of SNGFR and fluid absorption rate, thereby documenting the existence of GTB in mice without AQP1 or claudin-2. Concordant with the reduction in fluid absorption in the mutant mice, the slope of GTB was reduced by about 15% in the absence of claudin-2 and/or aquaporin 1. In a previous study in AQP1−/− mice codeficient in A1 adenosine receptors in which GFR was elevated because of the absence of TGF control, proximal fluid reabsorption has been found to be elevated in proportion to the GFR increase, again suggesting that flow-dependent reabsorption was intact in the absence of AQP1 (20). There were no clear differences in GTB slope among mice with single or double mutations consistent with the comparable reductions in fluid reabsorption in the different mutant strains. Overall, our data indicate that the absence of AQP1 or claudin-2 modulates, but does not abolish flow-dependent fluid reabsorption in the proximal tubule. Furthermore, water movement through both the AQP1 and claudin-2 channels and through the AQP1 and claudin-2-independent pathways of proximal fluid reabsorption appears to vary as a function of tubular flow.
In summary, from the magnitude of the effect of claudin-2-deficiency on proximal tubule fluid reabsorption, we conclude that the paracellular pathway may account for ∼25% of total proximal fluid reabsorption in mice. In animals with targeted deletion of both claudin-2 and AQP1, proximal reabsorption of 74% was not significantly less than seen in single mutant animals. An about five-fold increase in the transepithelial osmotic gradient together with a significant reduction of tubular load permits absorption through non-AQP1-dependent transcellular mechanisms at a rate sufficient to prevent severe homeostatic derangements.
DISCLOSURES
No conflicts of interest, financial or otherwise, are declared by the authors.
AUTHOR CONTRIBUTIONS
Author contributions: J.S. conception and design of research; J.S., Y.G.H., and D.M. performed experiments; J.S., Y.G.H., and D.M. analyzed data; J.S. interpreted results of experiments; J.S. prepared figures; J.S. drafted manuscript; J.S. edited and revised manuscript; J.S., Y.G.H., and D.M. approved final version of manuscript.
ACKNOWLEDGMENTS
This work was supported by the Intramural Research Program of the National Institute of Diabetes and Digestive and Kidney Diseases, National Institutes of Health (DK-043408-12 to the Kidney Disease Branch). The authors acknowledge valuable discussions with Drs. Mark Knepper and Josephine Briggs.
REFERENCES
- 1.Amasheh S, Meiri N, Gitter AH, Schoneberg T, Mankertz J, Schulzke JD, Fromm M. Claudin-2 expression induces cation-selective channels in tight junctions of epithelial cells. J Cell Sci 115: 4969–4976, 2002 [DOI] [PubMed] [Google Scholar]
- 2.Andreoli TE, Schafer JA. Volume absorption in the pars recta. III. Luminal hypotonicity as a driving force for isotonic volume absorption. Am J Physiol Renal Fluid Electrolyte Physiol 234: F349–F355, 1978 [DOI] [PubMed] [Google Scholar]
- 3.Barfuss DW, Schafer JA. Hyperosmolality of absorbate from isolated rabbit proximal tubules. Am J Physiol Renal Fluid Electrolyte Physiol 247: F130–F139, 1984 [DOI] [PubMed] [Google Scholar]
- 4.Berry CA. Water permeability and pathways in the proximal tubule. Am J Physiol Renal Fluid Electrolyte Physiol 245: F279–F294, 1983 [DOI] [PubMed] [Google Scholar]
- 5.Bomsztyk K, Wright FS. Dependence of ion fluxes on fluid transport by rat proximal tubule. Am J Physiol Renal Fluid Electrolyte Physiol 250: F680–F689, 1986 [DOI] [PubMed] [Google Scholar]
- 6.Carpi-Medina P, Whittembury G. Comparison of transcellular and transepithelial water osmotic permeabilities (Pos) in the isolated proximal straight tubule (PST) of the rabbit kidney. Pflügers Arch 412: 66–74, 1988 [DOI] [PubMed] [Google Scholar]
- 7.Enck AH, Berger UV, Yu AS. Claudin-2 is selectively expressed in proximal nephron in mouse kidney. Am J Physiol Renal Physiol 281: F966–F974, 2001 [DOI] [PubMed] [Google Scholar]
- 8.Fettiplace R, Haydon DA. Water permeability of lipid membranes. Physiol Rev 60: 510–550, 1980 [DOI] [PubMed] [Google Scholar]
- 9.Finkelstein A. Water and nonelectrolyte permeability of lipid bilayer membranes. J Gen Physiol 68: 127–135, 1976 [DOI] [PMC free article] [PubMed] [Google Scholar]
- 10.Fischbarg J. Fluid transport across leaky epithelia: central role of the tight junction and supporting role of aquaporins. Physiol Rev 90: 1271–1290, 2010 [DOI] [PubMed] [Google Scholar]
- 11.Fischbarg J, Vera JC. Multifunctional transporter models: lessons from the transport of water, sugars, and ring compounds by GLUTs. Am J Physiol Cell Physiol 268: C1077–C1089, 1995 [DOI] [PubMed] [Google Scholar]
- 12.Fromter E, Rumrich G, Ullrich KJ. Phenomenologic description of Na+, Cl− and HCO3− absorption from proximal tubules of rat kidney. Pflügers Arch 343: 189–220, 1973 [DOI] [PubMed] [Google Scholar]
- 13.Furuse M, Fujita K, Hiiragi T, Fujimoto K, Tsukita S. Claudin-1 and -2: novel integral membrane proteins localizing at tight junctions with no sequence similarity to occludin. J Cell Biol 141: 1539–1550, 1998 [DOI] [PMC free article] [PubMed] [Google Scholar]
- 14.Furuse M, Furuse K, Sasaki H, Tsukita S. Conversion of zonulae occludentes from tight to leaky strand type by introducing claudin-2 into Madin-Darby canine kidney I cells. J Cell Biol 153: 263–272, 2001 [DOI] [PMC free article] [PubMed] [Google Scholar]
- 15.Green R, Giebisch G. Luminal hypotonicity: a driving force for fluid absorption from the proximal tubule. Am J Physiol Renal Fluid Electrolyte Physiol 246: F167–F174, 1984 [DOI] [PubMed] [Google Scholar]
- 16.Gunzel D, Fromm M. Claudins and other tight junction proteins. Comprehensive Physiol 2: 1819–1852, 2012 [DOI] [PubMed] [Google Scholar]
- 17.Gurley SB, Riquier-Brison AD, Schnermann J, Sparks MA, Allen AM, Haase VH, Snouwaert JN, Le TH, McDonough AA, Koller BH, Coffman TM. AT1A angiotensin receptors in the renal proximal tubule regulate blood pressure. Cell Metab 13: 469–475, 2011 [DOI] [PMC free article] [PubMed] [Google Scholar]
- 18.Hasegawa H, Skach W, Baker O, Calayag MC, Lingappa V, Verkman AS. A multifunctional aqueous channel formed by CFTR. Science 258: 1477–1479, 1992 [DOI] [PubMed] [Google Scholar]
- 19.Hashimoto S, Adams JW, Bernstein KE, Schnermann J. Micropuncture determination of nephron function in mice without tissue angiotensin converting enzyme. Am J Physiol Renal Physiol 288: F445–F452, 2005 [DOI] [PubMed] [Google Scholar]
- 20.Hashimoto S, Huang Y, Mizel D, Briggs J, Schnermann J. Compensation of proximal tubule malabsorption in AQP1-deficient mice without TGF-mediated reduction of GFR. Acta Physiol Scand 181: 455–462, 2004 [DOI] [PubMed] [Google Scholar]
- 21.Hashimoto S, Huang YG, Castrop H, Hansen PB, Mizel D, Briggs J, Schnermann J. Effect of carbonic anhydrase inhibition on GFR and renal hemodynamics in adenosine-1 receptor-deficient mice. Pflügers Arch 448: 621–628, 2004 [DOI] [PubMed] [Google Scholar]
- 22.Kawedia JD, Nieman ML, Boivin GP, Melvin JE, Kikuchi K, Hand AR, Lorenz JN, Menon AG. Interaction between transcellular and paracellular water transport pathways through Aquaporin 5 and the tight junction complex. Proc Natl Acad Sci USA 104: 3621–3626, 2007 [DOI] [PMC free article] [PubMed] [Google Scholar]
- 23.Knepper MA, Nielsen S, Chou CL. Physiological roles of aquaporins in the kidney. In: Aquaporins, edited by Hohmann S, Nielsen S, Agre P. San Diego, CA: Academic, 2001, p. 121–153 [Google Scholar]
- 24.Leyssac PP, Karlsen FM, Holstein-Rathlou NH, Skott O. On determinants of glomerular filtration rate after inhibition of proximal tubular reabsorption. Am J Physiol Regul Integr Comp Physiol 266: R1544–R1550, 1994 [DOI] [PubMed] [Google Scholar]
- 25.Loo DD, Zeuthen T, Chandy G, Wright EM. Cotransport of water by the Na+/glucose cotransporter. Proc Natl Acad Sci USA 93: 13367–13370, 1996 [DOI] [PMC free article] [PubMed] [Google Scholar]
- 26.Lorenz JN, Schultheis PJ, Traynor T, Shull GE, Schnermann J. Micropuncture analysis of single-nephron function in NHE3-deficient mice. Am J Physiol Renal Physiol 277: F447–F453, 1999 [DOI] [PubMed] [Google Scholar]
- 27.Ma T, Yang B, Gillespie A, Carlson EJ, Epstein CJ, Verkman AS. Severely impaired urinary concentrating ability in transgenic mice lacking aquaporin-1 water channels. J Biol Chem 273: 4296–4299, 1998 [DOI] [PubMed] [Google Scholar]
- 28.Maclaren OJ, Sneyd J, Crampin EJ. What do aquaporin knockout studies tell us about fluid transport in epithelia? J Membr Biol 246: 297–305, 2013 [DOI] [PMC free article] [PubMed] [Google Scholar]
- 29.Molitoris BA, Alfrey AC, Harris RA, Simon FR. Renal apical membrane cholesterol and fluidity in regulation of phosphate transport. Am J Physiol Renal Fluid Electrolyte Physiol 249: F12–F19, 1985 [DOI] [PubMed] [Google Scholar]
- 30.Muto S, Hata M, Taniguchi J, Tsuruoka S, Moriwaki K, Saitou M, Furuse K, Sasaki H, Fujimura A, Imai M, Kusano E, Tsukita S, Furuse M. Claudin-2-deficient mice are defective in the leaky and cation-selective paracellular permeability properties of renal proximal tubules. Proc Natl Acad Sci USA 107: 8011–8016, 2010 [DOI] [PMC free article] [PubMed] [Google Scholar]
- 31.Nielsen S, Smith BL, Christensen EI, Knepper MA, Agre P. CHIP28 water channels are localized in constitutively water-permeable segments of the nephron. J Cell Biol 120: 371–383, 1993 [DOI] [PMC free article] [PubMed] [Google Scholar]
- 32.Nilius B. Is the volume-regulated anion channel VRAC a “water-permeable” channel? Neurochem Res 29: 3–8, 2004 [DOI] [PubMed] [Google Scholar]
- 33.Persson AEG, Wright FS. Evidence for feedback mediated reduction of glomerular filtration rate during infusion of acetazolamide. Acta Physiol Scand 114: 1–7, 1982 [DOI] [PubMed] [Google Scholar]
- 34.Pratz J, Ripoche P, Corman B. Cholesterol content and water and solute permeabilities of kidney membranes from aging rats. Am J Physiol Regul Integr Comp Physiol 253: R8–R14, 1987 [DOI] [PubMed] [Google Scholar]
- 35.Preisig PA, Berry CA. Evidence for transcellular osmotic water flow in rat proximal tubules. Am J Physiol Renal Fluid Electrolyte Physiol 249: F124–F131, 1985 [DOI] [PubMed] [Google Scholar]
- 36.Rehling M, Nielsen LE, Marqversen J. Protein binding of 99Tcm-DTPA compared with other GFR tracers. Nucl Med Commun 22: 617–623, 2001 [DOI] [PubMed] [Google Scholar]
- 37.Rosenthal R, Milatz S, Krug SM, Oelrich B, Schulzke JD, Amasheh S, Gunzel D, Fromm M. Claudin-2, a component of the tight junction, forms a paracellular water channel. J Cell Sci 123: 1913–1921, 2010 [DOI] [PubMed] [Google Scholar]
- 38.Schnermann J. NaCl transport deficiencies—hemodynamics to the rescue. Pflügers Arch 439: 682–690, 2000 [DOI] [PubMed] [Google Scholar]
- 39.Schnermann J, Chou CL, Ma T, Traynor T, Knepper MA, Verkman AS. Defective proximal tubular fluid reabsorption in transgenic aquaporin-1 null mice. Proc Natl Acad Sci USA 95: 9660–9664, 1998 [DOI] [PMC free article] [PubMed] [Google Scholar]
- 40.Schulzke JD, Gitter AH, Mankertz J, Spiegel S, Seidler U, Amasheh S, Saitou M, Tsukita S, Fromm M. Epithelial transport and barrier function in occludin-deficient mice. Biochim Biophys Acta 1669: 34–42, 2005 [DOI] [PubMed] [Google Scholar]
- 41.Tucker BJ, Steiner RW, Gushwa LC, Blantz RC. Studies on the tubulo-glomerular feedback system in the rat. The mechanism of reduction in filtration rate with benzolamide. J Clin Invest 62: 993–1004, 1978 [DOI] [PMC free article] [PubMed] [Google Scholar]
- 42.Vallon V, Verkman AS, Schnermann J. Luminal hypotonicity in proximal tubules of aquaporin-1-knockout mice. Am J Physiol Renal Physiol 278: F1030–F1033, 2000 [DOI] [PubMed] [Google Scholar]
- 43.Whittembury G, Malnic G, Mello-Aires M, Amorena C. Solvent drag of sucrose during absorption indicates paracellular water flow in the rat kidney proximal tubule. Pflügers Arch 412: 541–547, 1988 [DOI] [PubMed] [Google Scholar]
- 44.Yang B, Ma T, Verkman AS. cDNA cloning, gene organization, and chromosomal localization of a human mercurial insensitive water channel. Evidence for distinct transcriptional units. J Biol Chem 270: 22907–22913, 1995 [DOI] [PubMed] [Google Scholar]
- 45.Yu AS, McCarthy KM, Francis SA, McCormack JM, Lai J, Rogers RA, Lynch RD, Schneeberger EE. Knockdown of occludin expression leads to diverse phenotypic alterations in epithelial cells. Am J Physiol Cell Physiol 288: C1231–C1241, 2005 [DOI] [PubMed] [Google Scholar]
- 46.Zeuthen T, Stein WD. Cotransport of salt and water in membrane proteins: membrane proteins as osmotic engines. J Membr Biol 137: 179–195, 1994 [DOI] [PubMed] [Google Scholar]