

Abstract
Changes in the intestinal microbiota have been linked to diabetes, obesity, inflammatory bowel disease, and Clostridium difficile (C. difficile)-associated disease. Despite this, it remains unclear how the intestinal environment, set by ion transport, affects luminal and mucosa-associated bacterial composition. Na+/H+-exchanger isoform 3 (NHE3), a target of C. difficile toxin B, plays an integral role in intestinal Na+ absorption. Thus the NHE3-deficient mouse model was chosen to examine the effect of pH and ion composition on bacterial growth. We hypothesized that ion transport-induced change in the intestinal environment would lead to alteration of the microbiota. Region-specific changes in ion composition and pH correlated with region-specific alteration of luminal and mucosal-associated bacteria with general decreases in Firmicutes and increases in Bacteroidetes members. Bacteroides thetaiotaomicron (B. thetaiotaomicron) increased in NHE3−/− terminal ileum and was examined in vitro to determine whether altered Na+ was sufficient to affect growth. Increased in vitro growth of B. thetaiotaomicron occurred in 43 mM Na+ correlating with the NHE3−/− mouse terminal ileum [Na+]. NHE3−/− terminal ileum displayed increased fut2 mRNA and fucosylation correlating with B. thetaiotaomicron growth. Inoculation of B. thetaiotaomicron in wild-type and NHE3−/− terminal ileum organoids displayed increased fut2 and fucosylation, indicating that B. thetaiotaomicron alone is sufficient for the increased fucosylation seen in vivo. These data demonstrate that loss of NHE3 alters the intestinal environment, leading to region-specific changes in bacteria, and shed light on the growth requirements of some gut microbiota members, which is vital for creating better treatments of complex diseases with an altered gut microbiota.
Keywords: Na+/H+-exchanger isoform 3, Clostridium difficile, Bacteroides thetaiotaomicron, fucosylation, ileum
the alteration of normal gut microbiota is known to play a role in a variety of complex diseases, such as obesity (2, 3, 51, 52, 84, 85, 86), diabetes (9, 47), inflammatory bowel disease (28, 30, 56, 68, 70), antibiotic-associated diarrhea (92), and Clostridium difficile (C. difficile)-associated disease (14). These complex diseases are increasing in frequency and are associated with significant health care costs. Although these diseases each demonstrate dramatic shifts in the gut microbiota at the phylum level, it remains mechanistically unclear how certain bacterial groups are able to proliferate and maintain an altered composition. It is well documented that changes in the gut microbiota are able to impact epithelial ion transport (8, 21, 53, 54). However, little is known about the effect of epithelial ion transport processes on the intestinal microbiota. Ion transporters are expressed in distinctive patterns based on their intestinal location and are required for maintaining intestinal homeostasis (80). Likewise, microbiota composition varies in total number and species representation along the intestinal length (6). An understanding of the relationship of ion transport status to the microbiota is important for a clear understanding of regional microbiota changes.
Transporter-null mouse models offer the unique ability to examine the microbial populations and epithelial cross-talk along the length of the intestine. We have used the Na+/H+-exchanger isoform 3 null (NHE3−/−) mouse model to access region-specific bacterial changes in the intestine (72). NHE3 plays a critical role in intestinal sodium, water absorption, and pH regulation (31, 72). Due to decreased sodium and water absorption and H+ secretion, NHE3−/− mice have an enlarged cecum and colon and exhibit alkaline diarrhea (72). This particular mouse model is clinically relevant in that the pathogen C. difficile is responsible for the majority of antibiotic-associated diarrhea (23). C. difficile interacts with the mucus layer (19, 81) and delivers two exotoxins, toxin A (TcdA) and toxin B (TcdB) (23, 44, 88). These toxins result in glucosylation of Rho family GTPases, resulting in disorganization of the host cell cytoskeleton (19) and internalization of the NHE3 (36), which leads to subsequent diarrhea. C. difficile infection has also been shown to produce an altered microbiota composition (14, 92). The clinical relevance of C. difficile infection highlights the importance of looking more in depth into how ion transport affects the gut microbiota.
We hypothesized that the intestinal bacterial composition of NHE3−/− mice is changed in response to an altered microenvironment. Our research focused on examination of both luminal and mucosa-associated bacterial populations along the length of the intestine and identifies specific patterns of bacterial populations in each region. These populations correlated with both environmental and epithelial changes. Although these changes are likely many, herein we focus on one example, Bacteroides thetaiotaomicron (B. thetaiotaomicron). B. thetaiotaomicron proliferation in the NHE3−/− terminal ileum appears to be driven by a sodium concentration optimum (∼43 mM) and maintained by increased host fut2 mRNA and fucosylation. Together, our data link changes in ion composition and pH, as a result of altered ion transport, to changes in bacterial composition. We demonstrate that NHE3−/− mice exhibit an altered intestinal microbiota and with region-specific changes.
MATERIALS AND METHODS
Mice.
Animal protocol was approved by the University of Cincinnati Animal Care and Use Committee and complied with National Institutes of Health guidelines. FVBN NHE3−/− mice were generated as previously described (72). Mice were maintained on a normal mouse diet (7922 NIH-07 mouse diet; Harlan Laboratories, Indianapolis, IN). At 6–8 wk postweaning, terminal ileum (<10 cm proximal to the cecum, hereafter referred to as ileum), cecum, and colon (proximal and distal) segments were collected from wild-type (WT) and NHE3−/− littermates. Individual intestinal segments were flushed with PBS (pH 7.4) and mucosal scrapings collected as previously described (20, 29, 42, 61). Briefly, intestinal segments were flushed with 500 μl PBS. The segments were then opened lengthwise and washed thoroughly with PBS, and glass slides were used to scrape the epithelia and mucus layer. Luminal flushes were processed for total DNA, and mucosal scrapings were processed either for total DNA or for RNA. Sample wet weight was determined and tissue homogenized with a Tissue Tearor homogenizer (Biospec Products, Bartlesville, OK) for 1 min. RNA was extracted and stored at −80°C until examined by quantitative real-time PCR (qRT-PCR). DNA was extracted and stored at −20°C until examined by quantitative PCR (qPCR).
Bacterial strains and culture conditions.
Staphylococcus aureus (S. aureus), Escherichia coli (E. coli), Micrococcus luteus (M. luteus), Peptostreptococcus anaerobius (P. anaerobius), and Burkoholdena cepacia (B. cepacia) were from Dr. Daniel J. Hassett. B. thetaiotaomicron ATCC 29741 and Prevotella melaninogenica (P. melaninogenica) ATCC 25845 were purchased from Fisher Scientific (Thermo Fisher Scientific, Waltham, MA). Lactobacillus acidophilus (L. acidophilus) and Rhibozium legaminosarum (R. legaminosarum) were purchased from Carolina Biological Supply (Carolina Biological Supply, Burlington, NC). Ruminococcus productus (R. productus) ATCC 27340D-5 and Faecalibacterium prausnitzii (F. prausnitzii) ATCC 27766 were purchased from ATCC (American Type Culture Collection, Manassas, VA). E. coli, S. aureus, M. luteus, B. cepacia, L. acidophilus, and R. legaminosarum were grown in Luria-Burtani (LB; Thermo Fisher Scientific) broth at 37°C in a shaking incubator. B. thetaiotaomicron and P. melaninogenica were grown in tryptone soy broth (TSB, Thermo Fisher Scientific), R. productus and F. prausnitzii were grown in tryptone-yeast extract-glucose broth (Thermo Fisher Scientific), and P. anaerobius was grown in brain-heart-infusion (Thermo Fisher Scientific) broth at 37°C in a Coy Systems, dual-port anaerobic chamber (Coy Lab Products, Grass Lake, MI). These cultures were used to generate qPCR standard curves.
For characterization of the optimal [Na+] for growth of B. thetaiotaomicron and L. acidophilus, bacteria were grown in media where sodium chloride (NaCl) was either removed or replaced with cesium chloride (CsCl) as previously described (12). B. thetaiotaomicron was grown in TSB broth. Briefly, low-Na+ media was mixed with normal media at various dilutions to obtain the optimal concentration of Na+ for bacterial growth. Actual Na+ and K+ concentrations were confirmed by flame photometry (Single-Channel Digital Flame Photometer model 02655-10; Cole-Parmer Instrument, Vernon Hills, IL), and Cl− concentration was measured by chloridometry (Digital Chloridometer model 4425100; Labconco, Kansas City, MO). Bacteria were grown under anaerobic conditions at 37°C with gentle shaking to early stationary phase (optical density, O.D.600nm, ∼1) in normal media and used to inoculate media containing varying Na+ levels. Growth was measured as the O.D.600nm using an Amersham Biosciences Ultospec 3100 Spectrophotometer (GE Healthcare Life Sciences, Pittsburgh, PA) vs. uninoculated tubes of medium. Cell concentration was determined by bacterial cell counts using a Petroff Hauser chamber (Hausser Scientific, Horsham, PA) and colony-forming units (CFU) (11, 12, 40).
Histology.
WT and NHE3−/− mouse terminal ileum, cecum, and proximal and distal colon segments were fixed for 4 h at 4°C in Carnoy's fixative and embedded in paraffin. Serial 6–7-μm-thick sections were applied to glass slides and stained with hematoxylin and eosin (H&E) for intestine architecture. Goblet cells were analyzed semiquantitatively by counting goblet cells per five regions of interest/slide, three slides, n = 4 mice. Expression of fucosyl glycoconjugates on the mucosal surface was examined using FITC-conjugated Ulex europaeus agglutinin-1 (UEA-1; Vector Laboratories, Burlingame, CA) as previously described (41, 55). Briefly, sections were deparaffinized, blocked with PBS containing 10% BSA, and stained with FITC-labeled lectin (10 μg/ml) for 1 h at room temperature. Sections were then washed three times in PBS, mounted using Vectashield mounting medium with DAPI (Vector Laboratories), and analyzed by confocal laser scanning microscopy (Zeiss LSM Confocal 710; Carl Zeiss, Jena, Germany). Digital images of slides were evaluated by tabulating mean pixel intensity of the respective color channel on each image using Image J software (NIH). Five regions of interests of fixed size per slide, three slides per mouse, and n = 4 mice were used for semiquantitation of stain intensity.
Quantitative real-time-PCR amplification of 16S sequences.
Total DNA was isolated with the QIAamp DNA Stool kit (Qiagen, Valencia, CA) according to the manufacturer's instructions. The lysis temperature was increased to 95°C, and an incubation with lysozyme (10 mg/ml, 37°C for 30 min) was added to improve bacterial cell lysis as previously described (13, 27, 61, 67). The abundance of total bacteria and specific intestinal bacterial phyla, class, genus, and species was measured by qPCR using a Step One Real Time PCR machine (Applied Biosystems (ABI) Life Technologies, Grand Island, NY) with SYBR Green PCR Master Mix (ABI) and bacteria-specific primers (Table 1) in a 20-μl final volume. Bacterial numbers were determined using standard curves from the pure bacterial cultures as previously described (4, 62, 67), which correlated cycle of threshold values (CT) to calculated bacteria number.
Table 1.
Primer sequences for qRT-PCR of total bacteria and specific bacterial phyla and groups
| Type | Bacteria | Forward | Reverse | Reference |
|---|---|---|---|---|
| Total | Universal (Total Bacteria) | ACTCCTACGGGAGGCAGCAG | ATTACCGCGGCTGCTGG | (4, 26, 34) |
| Phyla | Bacteroidetes | GGCGACCGGCGCACGGG | GRCCTTCCTCTCAGAACCC | (34) |
| Phyla | Firmicutes | GGAGYATGTGGTTTAATTCGAAGCA | AGCTGACGACAACCATGCAC | (26) |
| Phyla | Actinobacteria | CGCGGCCTATCAGCTTGTTG | ATTACCGCGGCTGCTGG | (26) |
| Phyla | α-proteobacteria | ACTCCTACGGGAGGCAGCAG | TCTACGRATTTCACCYCTAC | (26) |
| Phyla | β-proteobacteria | CCGCACAGTTGGCGAGATGA | CGACAGTTATGACGCCCTCC | (26) |
| Phyla | y-Proteobacteria | GAGTTTGATCATGGCTCA | GTATTACCGCGGCTGCTG | (50) |
| Class | Clostridium coccoides cluster XIVa group | ACTCCTACGGGAGGCAGC | GCTTCTTAGTCAGGTACCGTCAT | (67) |
| Class | Clostridium leptum cluster IV group | GTTGACAAAACGGAGGAAGG | GACGGGCGGTGTGTACAA | (67) |
| Class | Lactobacillus/Enterococcus group | AGCAGTAGGGAATCTTCCA | CACCGCTACACATGGAG | (67) |
| Genus | Bacteroides | GGTTCTGAGAGGAGGTCCC | CTGCCTCCCGTAGGAGT | (67) |
| Genus | Prevotella | CCAGCCAAGTAGCGTGCA | TGGACCTTCCGTATTACCGC | (18) |
| Genus | Mouse Intestinal Bacteria (MIB) | CCAGCAGCCGCGGTAATA | CGCATTCCGCATACTTCTC | (67) |
| Species | Bacteroides thetaiotaomicron | GGTAGTCCACACAGTAAACGATGAA | CCCGTCAATTCCTTTGAGTTTC | (78) |
qRT-PCR of mRNA.
Total RNA was extracted from mucosal scrapings with TRIzol Reagent (Invitrogen Life Technologies, Grand Island, NY) according to the manufacturer's instructions. Reverse transcription was performed using 50 μg/ml oligo(dT) 20 primer and SuperScript reverse transcriptase (Invitrogen) according to the manufacturer's instructions. Amplification reactions were performed with SYBR Green PCR Master Mix (ABI), 200-ng sample cDNA in a 20-μl final volume on the Step One Real Time PCR Machine (ABI). Data were reported as the ΔΔCT using GAPDH as the standard. Differences in mRNA expression were determined by qRT-PCR and expressed as the ΔΔCT relative fold difference. Primers for fucosyltransferase and GAPDH were used as previously described (57): GAPDH forward, 5′-CCTGCACCACCAACTGCTTA-3′, GAPDH reverse, 5′-ATGACCTTGCCCACAGCCT-3′; fut2 forward, 5′-AGTCTTCGTGGTTACAAGCAAC-3′, reverse, 5′-TGGCTGGTGAGCCCTCAATA-3′; fut1 forward, 5′-CAGCTCTGCCTGACATTTCTG-3′, and reverse, 5′-AGCAGGTGATAGTCTGAACACA-3′.
Ion and pH measurements.
Intestinal flushes of WT and NHE3−/− mice were performed with 100 μl of double deionized water. Samples were weighed and centrifuged at 3,000 g for 10 min at 4°C to pellet intestinal solids, and the supernatant Na+ and K+ concentrations were determined using a digital Flame photometer (Single-Channel Digital Flame Photometer Model 02655-10; Cole-Parmer Instrument, Vernon Hills, IL). Cl− ion concentration was determined by a digital Chloridometer (Model 4425100; Labconco, Kansas City, MO) and normalized to intestinal volume. pH measurements were performed electrochemically via an electronic pH meter (Orion Model 720A; Thermo Fisher Scientific).
Organoid culture.
The terminal ileum (<10 cm proximal to the cecum) was dissected from WT and NHE3−/− mice and washed in ice-cold Ca/Mg-free DPBS. Tissue was incubated in 2 mM EDTA for 30 min at 4°C. Dissociated tissues were centrifuged at 150 g for 10 min and embedded in Matrigel (BD Biosciences, San Diego, CA). After the Matrigel was polymerized, Advanced DMEM/F12 medium supplemented with R-spondin 1 (500 ng/ml; R&D, Minneapolis, MN), penicillin/streptomycin (100/100 U/ml), HEPES (10 mM), Glutamax (2 mM), N2, and B27 (Drummon Scientific, Broomall, PA) was overlaid with Noggin (100 ng/ml; PeproTech, Rocky Hill, NJ) and EGF (50 ng/ml, PeproTech) as previously described (69).
Organoid microinjection.
We have previously used microinjection to inject cRNA into Xenopus oocytes (17, 22). Given that the organoids are of similar size to Xenopus oocytes used for expression studies, a similar technique to that used for oocytes (39) was used to inject the lumen of the growing organoids. Organoids derived from terminal mouse ileum tissue ranging in size from 200 to 350 μm in approximate diameter (∼5 days after passage) were used. Injection needles were pulled on a horizontal bed puller (Sutter Instruments, Novato, CA) and the tip ends broken under stereoscope view to obtain a tip diameter of ∼10–15 μm. Microinjection was accomplished using a Nanoject microinjector (Drummon Scientific). Injection volume was determined by the predicted organoid luminal volume. Injection volumes of ∼10% or less of the organoid luminal volume were used to minimize stretch effects on epithelial cells and tight junctions. Under these conditions, no observable leak is detected from the lumen of the organoid or from the injection site upon injection needle removal. Organoids were injected with either TBS broth alone or with TBS broth containing B. thetaiotaomicron (106 CFU). Organoids were incubated overnight, fixed with 4% paraformaldehyde, permeabilized with PBS Triton-X 100 (0.1%), stained with UEA-1 FITC (Vector Laboratories) and Hoechst, and imaged by confocal microscopy.
Statistics.
The data are presented as the means ± SE. Comparisons between two groups were made with unpaired t-tests, and comparisons between genotype and region were performed using two-way ANOVA and the Holme-Sidak post hoc test to determine significance between pairwise comparisons using SigmaPlot (Systat Software, San Jose, CA). P < 0.05 was considered significant, whereas n is number of experiments.
RESULTS
NHE3−/− mice exhibit an altered intestinal environment with increased luminal Na+ and alkaline pH.
NHE3−/− mice display increased fluid retention and intestinal size (72). To determine whether NHE3−/− mice preserve normal intestinal architecture, H&E (Fig. 1A) were done for ileum, cecum, proximal, and distal colon. No gross morphological changes are observed in NHE3−/− mice compared with WT littermates. Although there appeared to be a slight decrease in goblet cell number in the NHE3−/− distal colon (WT: 9.3 ± 0.7 vs. NHE3−/−: 7.7 ± 0.4 goblet cells/crypt) significance was not reached (P = 0.097). To examine the intestinal environment, Na+ and K+ concentrations were determined by flame photometry, and Cl− concentration was determined by chloridometry (Fig. 2, see also Table 2). Compared with WT mice, NHE3−/− mice had increased luminal Na+ concentration in terminal ileum, cecum, proximal, and distal colon (Fig. 2A). K+ concentration was increased in the cecum, proximal, and distal colon but not in the terminal ileum (Fig. 2B). Cl− concentration increased only in the cecum of NHE3−/− mice (Fig. 2C). Although we did not directly measure bicarbonate or short-chain fatty acids (SCFA), they represent the bulk of non-Cl anions. The non-Cl anion gap was calculated by [Na+] + [K+] − [Cl−] and is shown in Fig. 2D. NHE3−/− mice exhibited a higher non-Cl anion gap than is seen in WT mice for all intestinal segments studied, representing increased bicarbonate and/or SCFA content. In addition, the NHE3−/− mice had increased pH in all segments (Table 2). These data indicate that NHE3−/− mice have an altered intestinal environment.
Fig. 1.
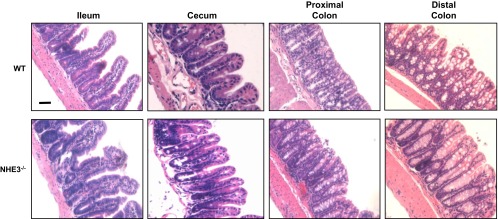
Na+/H+-exchanger isoform 3 (NHE3)−/− mice have normal histology. Mucosal morphology shown in hematoxylin and eosin-stained sections from WT and NHE3−/− mouse terminal ileum, cecum, proximal colon, and distal colon, demonstrating no gross alteration of the mucosal architecture. Micrographs are representative of observations from all mice n = 4. Scale bar = 50 μM.
Fig. 2.

Ion concentrations in luminal fluid from wild-type (WT) (solid bar) and NHE3−/− (open bar) mouse intestinal segments. A: sodium concentration as determined by flame photometry was significantly increased in all measured segments from NHE3−/− vs. WT littermates. B: potassium concentration as determined by flame photometry was significantly increased in cecum and colon but not terminal ileum of NHE3−/− vs. WT littermates. C: chloride concentration as determined by chloridometry was significantly increased only in the cecum of NHE3−/− vs. WT littermates. D: calculated anion gap + bicarbonate ([Na+] + [K+] − [Cl−]) was significantly increased in all measured segments from NHE3−/− vs. WT littermates. n = 5 for WT and n = 3 for NHE3−/−. *P < 0.05.
Table 2.
Luminal ion concentration (mM) and pH in WT and NHE3−/− intestinal segments
| Terminal Ileum |
Cecum |
Proximal Colon |
Distal Colon |
|||||
|---|---|---|---|---|---|---|---|---|
| Measurement | WT | NHE3−/− | WT | NHE3−/− | WT | NHE3−/− | WT | NHE3−/− |
| Na+ | 32.7 ± 1.2 | 42.8 ± 0.5* | 54.0 ± 1.8 | 109 ± 1* | 23.8 ± 1.7 | 36.6 ± 4.7* | 16.0 ± 1.8 | 24.5 ± 2.2* |
| K+ | 11.8 ± 0.7 | 10.6 ± 0.9 | 39.7 ± 1.9 | 49.8 ± 2.4* | 10.7 ± 0.9 | 19.0 ± 0.7* | 10.2 ± 1.0 | 24.2 ± 0.8* |
| Cl− | 16.0 ± 1.1 | 18.6 ± 1.0 | 16.1 ± 0.7 | 34.4 ± 0.7* | 17.1 ± 2.9 | 15.9 ± 1.1 | 11.3 ± 0.3 | 9.5 ± 0.9 |
| Anion gap | 19.0 ± 2.2 | 36.0 ± 3.1* | 71.4 ± 4.0 | 121 ± 11* | 16.0 ± 2.5 | 53.0 ± 4.8* | 8.9 ± 4.7 | 47.1 ± 4.3* |
| pH | 7.2 ± 0.1 | 8.0 ± 0.0* | 6.9 ± 0.1 | 7.8 ± 0.1* | 7.3 ± 0.2 | 8.0 ± 0.1* | 7.2 ± 0.2 | 7.7 ± 0.0* |
The anion gap was calculated as (Na+ + K+ − Cl−) ion concentrations, and the value predominately represents (HCO3− and short-chain fatty acid− anions. n = 8 for wild-type (WT) and n = 6 for Na+/H+-exchanger isoform 3 (NHE3)−/− groups. An interaction exists between genotype and region for Na+ (P = 0.007), Cl− (P < 0.001), and pH (P < 0.001) but not for K+ (P = 0.382) or anion gap (P = 0.703) although the concentrations are statistically different (K+ P = 0.006; anion gap P = 0.002). 2-Way ANOVA, Holme-Sidak
P < 0.005.
NHE3−/− mice exhibit altered microbiota composition in the luminal and mucosa-associated bacteria at the phylum level.
To determine whether total bacterial numbers were increased in correlation with increased intestinal size, total DNA was extracted from luminal flushes and mucosal scrapings and analyzed by qPCR. As shown in Fig. 3A, total luminal bacteria in the NHE3−/− mouse ileum, cecum, and distal colon was significantly increased. No significant change was observed in the proximal colon of the NHE3−/− mice, indicating a regional difference for this intestinal segment. Total mucosa-associated bacteria (Fig. 3B) were significantly increased in NHE3−/− mouse ileum, cecum, proximal colon, and distal colon. These data indicate that there is bacterial overrepresentation in most of the luminal and all the mucosa-associated bacterial populations.
Fig. 3.

NHE3−/− mice exhibit region-specific increases in total bacteria. Total bacteria were quantified by qPCR using a universal bacterial 16S DNA sequence. Calculated bacterial cell number was calculated using an Escherichia coli standard curve normalized to intestinal flush volume. A: luminal bacterial levels in WT (solid bar) and NHE3−/− (open bar) littermates (n = 6). Significant increases in total bacteria in NHE3−/− samples were observed in all but the proximal colon segment. B: mucosa-associated (adherent) bacterial levels in WT (solid bar) and NHE3−/− (open bar) littermates (n = 6). Significant increases in total bacteria were observed in all NHE3−/− mucosal regions tested. *P > 0.005.
To further characterize the luminal and mucosa-associated bacterial populations, the major intestinal bacterial phyla were compared as a percentage of total bacteria by qPCR. As shown in the bacterial phyla representation in Fig. 4A and Table 3, there was an expansion of members of the Bacteroidetes and a contraction of those within the Firmicutes in the NHE3−/− ileum, cecum, and distal colon luminal fluid. The major phylum Firmicutes decreased in the terminal ileum (13.2%), cecum (23.1%), and distal colon (22.5%) of NHE3−/− mice, whereas the phylum Bacteroidetes were increased (13%, 22.8%, and 25.6%, respectively). Smaller changes were also observed in the less dominant phyla Proteobacteria in the distal colon (2.8% decrease) (Fig. 4A). No significant changes were observed in phylum from the lumen of the proximal colon. These profiles reveal that there is a region-specific microbiota changes in the NHE3−/− luminal bacterial population. In the mucosa-associated bacterial population representation (Fig. 4B and Table 3), there was a contraction of Firmicutes in all NHE3−/− intestinal segments (ileum: 40.3%, cecum: 48.9%, proximal colon: 58.1%, distal colon: 59.9%) and an expansion of Bacteroidetes, such that it became the dominant phyla (ileum: 44.1%, cecum: 44.1%, proximal colon: 47.4%, distal colon: 52.5%). The overrepresentation of Bacteroidetes phylum members in the mucosa-associated population exceeds the expansion observed in the lumen. In addition to changes in Firmicutes and Bacteroidetes, significant changes were observed in Proteobacteria in the colon (proximal colon: 4.2% increase, distal colon: 2.5% increase) and Actinobacteria in the cecum (3.2% increase) and colon (proximal colon: 7.3% increase, distal colon: 5.2% increase). These data demonstrate that the NHE3−/− mouse mucosa-associated bacterial composition is significantly transformed in response to altered ion transport status. These data also highlight the differences between the luminal and mucosa-associated bacterial population representation. Taken together, our data indicate that the NHE3−/− mouse intestine exhibits significant region-specific changes in the luminal and mucosa-associated bacterial population.
Fig. 4.

NHE3−/− mice exhibit an altered gut microbiota in luminal and mucosa-associated bacterial populations. Relative bacterial phyla abundance was calculated as the percentage of bacterial phyla compared with total bacteria for luminal (A) and mucosa-associated bacteria (B). NHE3−/− mice showed a disproportionate amount of Bacteroidetes relative to Firmicutes phyla compared with WT littermates (n = 6). In the luminal bacterial population, significant interaction between genotype and region was observed in Firmicutes (P = <0.001), Bacteroidetes (P < 0.001), and Proteobacteria (P < 0.001). No interaction was observed in Actinobacteria (P = 0.641) or unspecified (P = 0.409). In the mucosa-associated bacterial population, significant interaction between genotype and region was observed in Firmicutes (P = <0.001), Bacteroidetes (P = 0.001), Actinobacteria (P < 0.001), Proteobacteria (P < 0.001), and unspecified bacteria (P < 0.001). Relative abundance of luminal (C) and mucosa-associated (D) bacterial subgroups of Firmicutes and Bacteroidetes phyla was observed. Relative abundance was calculated as the percentage of bacterial subgroup compared with total bacteria. Regional changes were observed in the Firmicutes subgroup Clostridium coccoides cluster XIVa, Clostridium leptum cluster IV, and Lactobacillus/Enterococcus group. Changes were also observed in the Bacteroidetes subgroup Prevotella, Bacteroides, and mouse intestinal Bacteroidetes (MIB) in the NHE3−/− mouse luminal and mucosa-associated bacterial populations. Significant interaction was observed between genotype and region for all groups (P < 0.001), n = 6 for WT and NHE3−/−. 2-way ANOVA, Holme-Sidak *P > 0.005. DC, distal colon; PC, proximal colon.
Table 3.
Bacterial phyla statistics between WT and NHE3−/− intestinal segments
| Luminal |
Mucosa-Associated |
|||||||
|---|---|---|---|---|---|---|---|---|
| Bacteria | Region | Δ of Means | P Value | Interaction | Δ of Means | P Value | Interaction | |
| Firmicutes | Ileum | 13.2 | <0.001 | 40.3 | <0.001 | |||
| Cecum | 23.1 | <0.001 | P = <0.001 | 48.9 | <0.001 | P = <0.001 | ||
| Proximal Colon | 1.1 | NS | 58.1 | <0.001 | ||||
| Distal Colon | 22.5 | <0.001 | 59.9 | <0.001 | ||||
| Bacteroidetes | Ileum | 13.0 | <0.001 | 44.1 | <0.001 | |||
| Cecum | 22.8 | <0.001 | P = <0.001 | 44.1 | <0.001 | P = 0.001 | ||
| Proximal Colon | 0.1 | NS | 47.4 | <0.001 | ||||
| Distal Colon | 25.6 | <0.001 | 52.5 | <0.001 | ||||
| Actinobacteria | Ileum | 0.1 | NS | 1.2 | NS | |||
| Cecum | 0.1 | NS | NS | 3.2 | <0.001 | P = <0.001 | ||
| Proximal Colon | 0.3 | NS | 7.3 | <0.001 | ||||
| Distal Colon | 0.4 | NS | 5.2 | <0.001 | ||||
| Proteobacteria | Ileum | 0.7 | NS | 0.3 | NS | |||
| Cecum | 0.1 | NS | P = <0.001 | 0.1 | NS | P = <0.001 | ||
| Proximal Colon | 0.5 | NS | 4.2 | <0.001 | ||||
| Distal Colon | 2.8 | <0.001 | 2.5 | <0.001 | ||||
| Unspecified | Ileum | 0.8 | NS | 2.3 | NS | |||
| Cecum | 0.2 | NS | NS | 1.8 | NS | NS | ||
| Proximal Colon | 1.2 | NS | 0.8 | NS | ||||
| Distal Colon | 0.7 | NS | 0.4 | NS | ||||
NS, not significant.
NHE3−/− mice exhibit altered microbiota composition in the luminal and mucosa-associated bacteria at the subgroup level.
The subgroups of Firmicutes and Bacteroidetes were further examined to determine the groups responsible for the significant changes observed in the Bacteroidetes and Firmicutes phyla (Fig. 4, C and D). In the luminal population (Fig. 4C and Table 4), changes were observed in all NHE3−/− intestinal segments. From the phylum Firmicutes, C. coccoides cluster XIVa was decreased in all the NHE3−/− segments (ileum: 13.7%, cecum: 47.5%, proximal colon: 9.1%, distal colon: 26.7%) and C. leptum cluster IV decreased in the cecum (8.0%) and colon (proximal colon: 8.4%, distal colon: 13.8%). The Lactobacillus/Enterococcus group was increased only in the cecum (46.5%), and another Firmicutes group was changed in the cecum (14.1% decrease) and colon (proximal colon: 17.1% increase, distal colon: 18.3% increase). From the phylum Bacteroidetes, Prevotella was increased in all NHE3−/− segments (ileum: 3.4%, cecum: 4.8%, proximal colon: 23.5%, distal colon: 14.2%), whereas Bacteroides was only increased in the NHE3−/− ileum (5.1%). Interestingly, Bacteroides was decreased in the NHE3−/− cecum and colon (cecum: 4.0%, proximal colon: 14.6%, distal colon: 11.9%). Mouse intestinal Bacteroidetes (MIB) was increased in the NHE3−/− ileum (11.0%) and cecum and decreased in the NHE3−/− proximal colon (14.2%). Other Bacteroidetes subgroups were decreased in the NHE3−/− ileum (7.3%) and increased in the NHE3−/− cecum (3.0%) and colon (proximal colon: 4.8%, distal colon: 21.4%). Although the overall phylum did not change in the NHE3−/− proximal colon lumen, there were changes in Firmicutes and Bacteroidetes subgroups, indicating that the microbiota composition is altered in all NHE3−/− segments.
Table 4.
Bacterial subgroup statistics between WT and NHE3−/− intestinal segments
| Luminal |
Mucosa-Associated |
||||||||
|---|---|---|---|---|---|---|---|---|---|
| Phyla | Bacteria | Region | Δ of Means | P Value | Interaction | Δ of Means | P Value | Interaction | |
| Firmicutes | C. coccoides cluster XIVa | Ileum | 13.7 | <0.001 | 11.5 | <0.001 | |||
| Cecum | 47.5 | <0.001 | P = <0.001 | 35.4 | <0.001 | P = <0.001 | |||
| Proximal Colon | 9.1 | <0.001 | 25.0 | <0.001 | |||||
| Distal Colon | 26.7 | <0.001 | 44.0 | <0.001 | |||||
| C. leptum cluster IV | Ileum | 1.6 | NS | 2.6 | <0.001 | ||||
| Cecum | 8.0 | <0.001 | P = <0.001 | 4.2 | <0.001 | P = <0.001 | |||
| Proximal Colon | 8.4 | <0.001 | 6.8 | <0.001 | |||||
| Distal Colon | 13.8 | <0.001 | 8.1 | <0.001 | |||||
| Lactobacillus/Enterococcus | Ileum | 1.0 | NS | 16.9 | <0.001 | ||||
| Cecum | 46.5 | <0.001 | P = <0.001 | 4.2 | <0.001 | P = <0.001 | |||
| Proximal Colon | 0.9 | NS | 3.6 | <0.001 | |||||
| Distal Colon | 0.3 | NS | 3.1 | <0.001 | |||||
| Other Firmicutes | Ileum | 2.1 | NS | 9.1 | <0.001 | ||||
| Cecum | 14.1 | <0.001 | P = <0.001 | 5.1 | <0.001 | P = <0.001 | |||
| Proximal Colon | 17.1 | <0.001 | 22.6 | <0.001 | |||||
| Distal Colon | 18.3 | <0.001 | 4.7 | <0.001 | |||||
| Bacteroidetes | Prevotella | Ileum | 3.4 | <0.001 | 3.6 | <0.001 | |||
| Cecum | 4.8 | <0.001 | P = <0.001 | 1.9 | NS | P = <0.001 | |||
| Proximal Colon | 23.5 | <0.001 | 3.3 | <0.001 | |||||
| Distal Colon | 14.2 | <0.001 | 5.5 | <0.001 | |||||
| Bacteroides | Ileum | 5.1 | <0.001 | 7.6 | <0.001 | ||||
| Cecum | 4.0 | <0.001 | P = <0.001 | 0.6 | 0.195 | P = <0.001 | |||
| Proximal Colon | 14.6 | <0.001 | 0.1 | 1.000 | |||||
| Distal Colon | 11.9 | <0.001 | 0.3 | 1.000 | |||||
| MIB | Ileum | 11.0 | <0.001 | 40.5 | <0.001 | ||||
| Cecum | 19.0 | <0.001 | P = <0.001 | 46.3 | <0.001 | P = <0.001 | |||
| Proximal Colon | 14.2 | <0.001 | 40.8 | <0.001 | |||||
| Distal Colon | 1.9 | NS | 50.7 | <0.001 | |||||
| Other Bacteroidetes | Ileum | 6.5 | <0.001 | 14.8 | <0.001 | ||||
| Cecum | 3.0 | <0.001 | P = <0.001 | 0.3 | NS | P = <0.001 | |||
| Proximal Colon | 4.8 | <0.001 | 10.0 | <0.001 | |||||
| Distal Colon | 21.4 | <0.001 | 3.3 | <0.001 | |||||
In the mucosa-associated bacterial population (Fig. 4D and Table 4), C. coccoides cluster XIVa (ileum: 11.5%, cecum: 35.4%, proximal colon: 25.0%; distal colon: 44.0%), C. leptum cluster IV (ileum: 2.6%, cecum: 4.2%, proximal colon: 6.8%, distal colon: 8.1%), and Lactobacillus/Enterococcus group (ileum: 16.9%, cecum: 4.2%, proximal colon 3.6%, distal colon: 3.1%) decreased in all NHE3−/− segments. Likewise, Bacteroides was decreased in the NHE3−/− ileum (7.6%), and Prevotella was decreased in the NHE3−/− ileum (3.6%), cecum (1.9%), and proximal colon (3.3%). However, Prevotella increased in the NHE3−/− distal colon (5.5%), and MIB increased in representation in all the NHE3−/− segments (ileum: 40.5%, cecum: 46.3%, proximal colon 40.8%, distal colon: 50.7%). In addition, another unspecified Bacteroidetes subgroup was increased in the NHE3−/− ileum (14.8%) and proximal colon (10.0%) and decreased in the distal colon (3.3%). These data indicate that, in the mucosa-associated bacterial population, Clostridium clusters and Lactobacillus/Enterococcus groups are responsible for the decrease in the Firmicutes phyla, whereas the MIB group is largely responsible for the significant increase in the Bacteroidetes phyla.
The genus Bacteroides makes up a substantial portion of Bacteroidetes in the gastrointestinal tract, and the species B. thetaiotaomicron is a well-characterized Bacteroides member found in both the human and mouse intestine (7, 10, 15, 35, 40, 58, 91). Based on the increased luminal [Na+], we sought to determine whether B. thetaiotaomicron was responsible for the increase in luminal Bacteroides in the NHE3−/− terminal ileum. Figure 5A shows that B. thetaiotaomicron is indeed increased in NHE3−/− ileum. No increase in B. thetaiotaomicron was observed in the cecum, proximal, or distal colon. B. thetaiotaomicron accounted for 11.3% in WT and 31.7% in NHE3−/− of the genus Bacteroides, which represents 33% of the observed Bacteroides species increase. B. forsythus, B. fragilis, B. distasonis, and B. vulgaris were not increased in the NHE3−/− terminal ileum (data not shown). These data indicate that Bacteroides, specifically B. thetaiotaomicron proliferation, is partially responsible for the Bacteroidetes overgrowth in the NHE3−/− terminal ileum lumen.
Fig. 5.

In vivo and in vitro growth of Bacteroides thetaiotaomicron (B. thetaiotaomicron). A: calculated bacterial cell number for the Bacteroides species B. thetaiotaomicron. Bacterial cell numbers were calculated from a standard curve using a pure culture of B. thetaiotaomicron. B. thetaiotaomicron was significantly increased only in NHE3−/− terminal ileum vs. WT littermates. This increase accounts for 33% of the increased Bacteroidetes. n = 6 for WT (solid bar) and n = 6 for NHE3−/− (open bar) *P > 0.005. B: growth of B. thetaiotaomicron in tryptone soy broth (TSB) at varying concentrations of Na+, which mimic those seen in vivo for NHE3−/− and WT intestinal fluid (Table 2). The steepest change in B. thetaiotaomicron growth is observed at a [Na+] range that correlates directly with that seen in the WT and NHE3−/− terminal ileum. n = 3. [Na+] ranges for each intestinal segment in WT and NHE3−/− are displayed as bars along the x-axis. Arrows indicate in vivo values for terminal ileum. C: growth of B. thetaiotaomicron in TSB broth at varying pH, which mimics that seen in vivo for NHE3−/− and WT intestinal fluid (Table 2). Growth was determined at 33 mM Na+ (●), mimicking WT terminal ileum and 43 mM Na+ (○), mimicking NHE3−/− ileum. No significant difference was observed in B. thetaiotaomicron growth within the pH range seen in WT and NHE3−/− terminal ileum (indicated by the bar). n = 3. Bars and arrows indicate in vivo values.
In vitro B. thetaiotaomicron growth is significantly enhanced at [Na+] observed in NHE3−/− mouse terminal ileum.
To determine whether B. thetaiotaomicron overrepresentation was indeed due to the altered luminal ion composition caused by loss of NHE3, B. thetaiotaomicron growth was tested in vitro. TSB at varying Na+ concentrations, intended to mimic the intestinal Na+ concentration observed in WT and NHE3−/− mice, was used to determine B. thetaiotaomicron growth. Na+ and K+ concentration were measured in the modified TSB by flame photometry. Na+ concentrations used were 19, 26, 33.6, 43.5, 57.1, 65.9, and 106.5 mM, values that closely resembled the in vivo concentrations (Table 2). K+ concentration averaged 43.2 ± 0.1 mM (ranging 42.8 to 43.6 mM) for all solutions. After 20 h of growth, bacterial content was examined by O.D.600nm, cell counts, and CFU (O.D.600nm data are shown in Fig. 5B). The data show that B. thetaiotaomicron has optimal growth at 43 mM Na+ and that the greatest increase in growth occurs over the range of [Na+] measured in the terminal ileum of WT and NHE3−/− mice (annotated by the bars and arrows). Slight growth rate changes were observed over the [Na+] range from other intestinal segments in WT and NHE3−/− mice. The specific effect of [Na+] on B. thetaiotaomicron growth was further confirmed by varying the Na+ concentration in TSB by cation replacement with Cs+ (data not shown). The NHE3−/− mouse intestinal fluid is more alkaline than WT littermates (Table 2). Thus we examined the effect of varying pH on B. thetaiotaomicron growth at WT (33 mM Na+) and NHE3−/− (43 mM Na+) concentrations. Whereas increased B. thetaiotaomicron growth correlated well with terminal ileum [Na+], no significant correlation was seen with varying pH (Fig. 5C). These data indicate that both in vivo and in vitro B. thetaiotaomicron are capable of using Na+ to enhance its growth and proliferation in the terminal ileum and that 43 mM Na+ provides an optimal concentration for its growth. It is important to note that this change occurs within the physiological range of intestinal Na+, thus supporting the notion that ion transport status plays a role in microbial niche development.
Increased B. thetaiotaomicron correlates with increased fut2 mRNA expression and surface fucosylation in vivo in NHE3−/− ileum and in vitro in mouse organoids.
Luminal B. thetaiotaomicron is able to secrete α-fucosidases, which extract fucose residues from mucus glycans (41, 91), and stimulates fut2 mRNA transcription and fucosyltransferase activity to increase mucus fucosylation, which is used as an energy source by the bacterium (16, 41, 57). We hypothesized that increased B. thetaiotaomicron in NHE3−/− mouse terminal ileum would stimulate increased fucosylation and thus provide a positive nutrient feedback mechanism that would further enhance B. thetaiotaomicron growth. To determine whether B. thetaiotaomicron was altering host fucosyltransferase activity, we examined fut mRNA by qRT-PCR. As shown in Fig. 6, A and B, no significant changes were observed in fut1 mRNA; however, the dominant form fut2 mRNA was increased in NHE3−/− terminal ileum (6 ± 1 relative fold change). No significant change in fut2 mRNA was observed in NHE3−/− cecum, proximal colon, or distal colon compared with WT littermates. Thus increased B. thetaiotaomicron in the NHE3−/− terminal ileum correlates with increased fut2 mRNA levels. To determine whether increased fut2 mRNA levels reflect increased fucosyltransferase activity, a α-1,2-fucose-specific lectin, UEA-1, conjugated to FITC was used to assess fucosylation in intestinal segments. Indeed, fucosylation was increased only in NHE3−/− terminal ileum (Fig. 6C). No significant changes in fucosylation were observed in the cecum or colon of NHE3−/− vs. WT littermates.
Fig. 6.

Increased fut2 and fucosylation are observed in the NHE3−/− terminal ileum. mRNA expression was determined by qRT-PCR and expressed as the ΔΔCT relative fold difference. A: no significant difference is observed in fut1 mRNA expression between NHE3−/− (open bar) and WT (solid bar) littermate mice. B: fut2 mRNA is significantly increased only in NHE3−/− (open bar) mouse terminal ileum vs. WT (solid bar) littermates. No significant difference in fut2 expression is observed in mucosal segments distal to the terminal ileum. This directly correlates with B. thetaiotaomicron levels shown in Fig. 5A. n = 6. *P < 0.05. C: significant increase in fucosylation was only observed in terminal ileum of NHE3−/− vs. WT mice with fucosylated residues apparent from crypt to villus tip (depicted by the arrows). This increase directly correlates with increased fut2 mRNA and Bacteroides levels in the terminal ileum of the NHE3−/− mice. Fucosylation was determined by Ulex europaeus agglutinin (UEA)-1-FITC lectin binding (red). Nuclei stained with DAPI (blue). Representative micrographs of observations from n = 4 mice. Scale bar = 50 μM. D: semiquantitative analysis of fucosylation. There is a significant interaction between genotype and segment (*P = <0.001). NHE3−/− vs. WT ileum P < 0.001. No significant differences were observed between WT and NHE3−/− cecum (P = 0.896), proximal (P = 0.511) and distal colon (P = 0.720) by 2-way ANOVA, Holme-Sidak.
To confirm that B. thetaiotaomicron was indeed responsible for the fucosylation changes observed in the NHE3−/− ileum, B. thetaiotaomicron was injected into WT and NHE3−/− terminal ileum organoids, and fut2 mRNA and fucosylation were examined (Fig. 7). WT ileum organoids closely resemble mouse ileum tissue: both contain mRNA for ion transporters such as CFTR, NHE1, NKCC1, NBC1, DRA, AE2, NHE3, GLUT 1, GLUT 2, and GLUT 5, in addition to mucins (MUC 1, MUC 2, MUC 5AC) and fut1 and fut2 mRNA (data not shown). The organoids also secrete MUC2 mucus glycoproteins (data not shown). Although the NHE3−/− terminal ileum shows elevated fucosylation, as seen in Fig. 7B, NHE3−/− organoids did not have high baseline fucosylation as a direct result of NHE3 loss. It is noteworthy that, in the preparation of the organoid culture, the endogenous microbiota are removed. Injection of B. thetaiotaomicron into WT as well as NHE3−/− organoids resulted in increased fut2 mRNA and fucosylation, confirming that increased B. thetaiotaomicron in the NHE3−/− ileum is sufficient for the observed in vivo fucosylation. Fucosylation represents a mechanism of host-bacteria interaction, and increased fucosylation reflects the ability of B. thetaiotaomicron to adjust to intestinal environment and other bacterial composition changes.
Fig. 7.

B. thetaiotaomicron induced host epithelial changes in mouse terminal ileal organoid. A: fut2 mRNA in WT and NHE3−/− mouse ileum organoids (solid bar = ileum organoid injected with TSB broth; open bar = ileum organoid injected with B. thetaiotaomicron culture). B: confocal images from WT and NHE3−/− mouse ileum organoids depicting fucosylation by UEA-1-rhodamine lectin (red) binding. Nuclei stained with DAPI (blue). Shown from top to bottom are projection images, x-y plane midsection slice, and transmitted light image. Images reveal increased fucosylation in organoids infected with B. thetaiotaomicron. These data demonstrate that B. thetaiotaomicron alone is sufficient to induce fut2, which correlates to increased fucosylation in terminal mouse ileum. n = 5 *P < 0.05. Scale bar = 50 μm.
These results demonstrate that changes in ion transport can alter the intestinal environment and thereby result in changes in bacteria representation. Certain bacteria are also capable of modifying the epithelia in a manner that allows for further proliferation and niche maintenance.
DISCUSSION
Recent studies have shown that the intestinal epithelium is not simply a static barrier; the epithelium is in a constant “cross talk” with the gut microbiota and the external environment (6). Environment and bacterial cues signal changes in ion transport, pH regulation, tight junction function, and activation of inflammatory cascades (6). Although pathogens from a variety of phyla have been shown to alter certain host functions, like ion transport, the overall role of an altered intestinal environment on bacteria, pathogens, and commensal bacteria alike remains largely undetermined. This study provides a seminal examination of changes in the gut microbiota as a result of altered ion transport. Our data demonstrate that single transporter-null mice represent a valid model to better understand mechanisms of host bacterial niche development and region-specific intestinal microbiota changes. In addition, we demonstrate that B. thetaiotaomicron in vitro is Na+ sensitive in the physiological range, and increased B. thetaiotaomicron directly correlates with increased fut2 mRNA and fucosylation, in vivo and in vitro, revealing host-bacterial interactions that further enhance B. thetaiotaomicron bacterial proliferation. Collectively, our work indicates that altered bacterial growth occurs in response to an altered intestinal environment and that Na+ and pH play a key role in shaping the gut microbiota.
Very few studies have focused on the effect of ion transport on the gut microbiota. An altered gut microbiota was demonstrated in a mouse model of cystic fibrosis (CF) (83), where the chloride transporter CFTR was knocked out. This model displayed decreased members of Acinetobacter lwoffii and several Lactobacilliales members in addition to significant enrichment of Mycobacteria and Bacteroides in the ileum. Additionally, increased fut2 mRNA and fucosylation were observed in the small intestine of the CF mice (83) and in humans with CF (82). In the CF mice, there was an increase in total bacteria in the small intestine, and the authors hypothesized that bacteria-host interactions were responsible for the induction of increased fut2 and fucosylation. Data presented herein conclusively identify increased B. thetaiotaomicron and increased fut2 and fucosylation in a mouse model with a complex microbiota. Although CFTR is crucial for transepithelial anion transport, loss of chloride secretion also results in mucus accumulation and may provide a new niche for abnormal bacterial colonization.
NHE3−/− mice do experience diarrhea, and some of the changes in the gut microbiota could be a result of diarrhea; however, based on previous literature, we believe that the dominant changes in the gut microbiota are in fact due to changes in ion transport. In the mouse model of nontyphoidal Salmonella diarrhea, Endt et al. (23) demonstrated that Salmonella infection and diarrhea resulted in decreased Firmicutes members and decreased Bacteroidetes members, with increased Proteobacteria members. Barman et al. (4) also demonstrated decreased Eubacterium rectale/Clostridium coccoides group (Firmicutes) and Bacteroides (Bacteroidetes) in the cecum and colon of mice infected with Salmonella for 7 days. In addition, Enterobacteriaceae (Proteobacteria) was found to be increased in the cecum and colon. No changes were observed in Lactobacillus or MIB groups. In humans, osmotic diarrhea from oral ingestion of polyethylene glycol was found in general to increase Firmicutes members in the stool and decrease Bacteroidetes members in the mucosa-associated bacterial population. Moreover, diarrhea led to a relative increase in the abundance of Proteobacteria (33). The data herein demonstrate that NHE3−/− mice have increased Bacteroidetes and decreased Firmicutes phyla both in the luminal and mucosa-associated bacterial populations. Because NHE3−/− bacterial composition differs from the bacterial composition seen in diarrhea, the data are consistent with the bacteria in the NHE3−/− being predominantly affected by changes in the intestinal environment as a result of the loss of NHE3.
The increases observed in the luminal and mucosa-associated subgroups of Bacteroidetes indicate that the intestinal environment set by NHE3 regulates the Bacteroidetes phylum significantly. We show that ion transport status alters the intestinal microenvironment in ways that are advantageous for certain bacterial groups. pH changes have been shown to affect bacterial growth. High (alkaline) pH resulting from streptomycin use has been shown to result in increased Gram-negative Bacteroidetes and decreased Gram-positive Firmicutes (71, 73), similar to the profile observed in the NHE3−/− intestine. Gastrointestinal bacteria have been shown to rely on bacterial cation/proton antiporters when exposed to alkaline pH conditions. Studies of Gram-negative E. coli have demonstrated a key role in Na+ extrusion and proton capture at high-pH homeostasis (63, 64, 66). As one might expect, these Na+-coupled ATPase transporters are increased in response to elevated pH or elevated Na+ (43, 45). A myriad of studies have also demonstrated that Na+ can be used by bacteria for many aspects of their fundamental physiological processes (1, 38, 75, 76, 77, 79, 89). Bacteroides spp. require Na+ for growth (12), and Na+ and K+ ions were found to independently affect the growth rate and growth yield of B. amylophilus (12), B. ruminicola, B. oralis, and B. succinogenes S-85, respectively (11). Mutational studies of B. thetaiotaomicron have shown that mutating genes involved in sensing Na+ gradients resulted in a loss of bacterial fitness (32). In the terminal ileum, where there is low expression of oligosaccharides, an additional proliferator factor, such as Na+ may provide B. thetaiotaomicron a competitive edge.
Data presented herein also demonstrate that mucosa-associated bacterial populations respond more dramatically to changes in sodium and pH caused by the loss of NHE3 than the luminal bacteria. It is probable that the mucosa-associated bacteria might be more influenced by the host genetics, as they are in closer physical proximity to the host epithelia. However, clearly ion transport status affects both luminal and mucosa-associated representation of bacteria. Dramatic changes in the mucosa-associated bacterial population are also observed in mouse models with genetic host alterations (5, 29, 67, 83, 87). We hypothesize that the luminal bacterial population may be more affected by diet-induced changes (24, 42, 74) and luminal microenvironment, whereas the mucosa associated population may be more influenced by host changes, such as immunity and antimicrobial concentration (29, 67), mucus production (5, 29, 87) or changes in ion transport (83).
It should be noted that NHE3−/− mice from our facility do not display overt intestinal inflammation, whereas NHE3−/− mice of the same source (Gary E. Shull) housed elsewhere do show signs of active inflammation (49). Our NHE3−/− mice do exhibit increased IFN-γ and inducible nitric oxide synthase (iNOS) mRNA in the ileum and IL-1β mRNA in the distal colon (data not shown) and have elevated blood IL-1β and IFN-γ (90), but there is no increase in proinflammatory cytokine mRNA of IL-18, TNF-α, NOS2, and IL-10 (49) and no apparent neutrophil infiltration (data not shown) (48). The cytokines observed in the NHE3−/− mouse may also represent a subthreshold immune response due to increased Gram-negative bacteria as observed in other models (5, 37, 87). In conditions such as IBD and parasite Toxoplasma gondii infection, increased Gram-negative bacteria, such as E. coli and Bacteroides, signal through Toll-like receptor 4, which increases IFN-γ and iNOS in terminal ileum (37). Studies with monoassociated B. thetaiotaomicron have also demonstrated increased cytokine production (48, 65). In contrast, increased MIB has been linked with protection against inflammation with S. Typhimurium colonization (25). Increased MIB in the NHE3−/− intestine may dampen down large-scale inflammatory responses, contributing to the low level of inflammatory response observed in our mice. The altered intestinal microbiota exhibited by the NHE3−/− may make these mice vulnerable to subsequent pathogen infection in other mouse facilities. However, for the mice housed at the animal facility at our university, the analysis of the gut microbiota are not complicated by an active, robust inflammatory response. Nevertheless, careful comparative study of differences between similar mice with or without overt inflammation should prove valuable in determining the key factors (e.g., bacterial species) leading to an inflammatory response or pathogen susceptibility.
NHE3 is also clinically relevant for analysis, as it is a target of C. difficile toxin B (36). C. difficile is a leading cause of nosocomial enteric infections. According to the CDC, C. difficile affects over half a million people in America yearly, and the incidence of non-hospital-acquired C. difficile infection is increasing. Because NHE3 is involved in Na+ and water regulation, a large percentage of patients infected with C. difficile suffer from diarrhea (46, 59). In humans, increased Bacteroidetes and decreased Firmicutes have been shown to be associated with C. difficile-associated disease (14, 92). In mice infected with C. difficile, increased Bacteroides coordinately occurred in the ileum (60). Such alterations resemble the microbial changes observed in the NHE3−/− mouse model. Thus it is likely that C. difficile toxin B inhibition of NHE3 serves to alter the intestinal microbiota and thus create a more suitable environment for C. difficile infection. Further studies are necessary, and underway, to determine whether the changes in the gut microbiota seen in C. difficile infection are predominately due to inhibition of NHE3 rather than C. difficile-bacterial interaction. Taken together, the results presented herein propose that ion transport plays a key role, not only in regulating the intestinal environment, but also in establishing bacterial niches. This can be clinically advantageous because a number of ion transporter drugs could be used in various disease states to alter the intestinal environment (regionally specific to transporter expression) in a manner that promotes or represses growth of certain bacterial groups. Such therapy could potentially be used to rebalance the intestinal microbiota after a shift with minimal effect on propagating antibiotic resistant bacterial strains.
GRANTS
This work is supported in part by NIH DK079979 to R. Worrell and DK050594 to G. Shull.
DISCLOSURES
No conflicts of interest, financial or otherwise, are declared by the authors.
AUTHOR CONTRIBUTIONS
Author contributions: M.A.E. and R.T.W. conception and design of research; M.A.E. and E.A. performed experiments; M.A.E. analyzed data; M.A.E., M.H.M., G.E.S., D.J.H., and R.T.W. interpreted results of experiments; M.A.E. and E.A. prepared figures; M.A.E. drafted manuscript; M.A.E., M.H.M., G.E.S., D.J.H., and R.T.W. edited and revised manuscript; R.T.W. approved final version of manuscript.
ACKNOWLEDGMENTS
We thank our undergraduate volunteers Khushboo Patel, Christine Ciriaco, Kristen Engevik, Robert Phan, Katie Anglin, and Fatma Rah for assistance. This work is in partial fulfillment of the Ph.D. degree for Melinda A. Engevik.
REFERENCES
- 1.Avetisyan AV, Bogachev AV, Murtasina RA, Skulachev VP. ATP-driven Na+ transport and Na(+)-dependent ATP synthesis in Escherichia coli grown at low delta mu H+. FEBS Lett 317: 267–270, 1993 [DOI] [PubMed] [Google Scholar]
- 2.Backhed F, Ding H, Wang T, Hooper LV, Koh GY, Nagy A, Semenkovich CF, Gordon JI. The gut microbiota as an environmental factor that regulates fat storage. Proc Natl Acad Sci USA 101: 15718–15723, 2004 [DOI] [PMC free article] [PubMed] [Google Scholar]
- 3.Backhed F, Manchester JK, Semenkovich CF, Gordon JI. Mechanisms underlying the resistance to diet-induced obesity in germ-free mice. Proc Natl Acad Sci USA 104: 979–984, 2007 [DOI] [PMC free article] [PubMed] [Google Scholar]
- 4.Barman M, Unold D, Shifley K, Amir E, Hung K, Bos N, Salzman N. Enteric salmonellosis disrupts the microbial ecology of the murine gastrointestinal tract. Infect Immun 76: 907–915, 2008 [DOI] [PMC free article] [PubMed] [Google Scholar]
- 5.Bergstrom KS, Kissoon-Singh V, Gibson DL, Ma C, Montero M, Sham HP, Ryz N, Huang T, Velcich A, Finlay BB, Chadee K, Vallance BA. Muc2 protects against lethal infectious colitis by disassociating pathogenic and commensal bacteria from the colonic mucosa. PLoS Pathog 6: e1000902, 2010 [DOI] [PMC free article] [PubMed] [Google Scholar]
- 6.Berkes J, Viswanathan VK, Savkovic SD, Hecht G. Intestinal epithelial responses to enteric pathogens: effects on the tight junction barrier, ion transport, and inflammation. Gut 52: 439–451, 2003 [DOI] [PMC free article] [PubMed] [Google Scholar]
- 7.Bjursell MK, Martens EC, Gordon JI. Functional genomic and metabolic studies of the adaptations of a prominent adult human gut symbiont, Bacteroides thetaiotaomicron, to the suckling period. J Biol Chem 281: 36269–36279, 2006 [DOI] [PubMed] [Google Scholar]
- 8.Borenshtein D, Schlieper KA, Rickman BH, Chapman JM, Schweinfest CW, Fox JG, Schauer DB. Decreased expression of colonic Slc26a3 and carbonic anhydrase iv as a cause of fatal infectious diarrhea in mice. Infect Immun 77: 3639–3650, 2009 [DOI] [PMC free article] [PubMed] [Google Scholar]
- 9.Brugman S, Klatter FA, Visser JT, Wildeboer-Veloo AC, Harmsen HJ, Rozing J, Bos NA. Antibiotic treatment partially protects against type 1 diabetes in the Bio-Breeding diabetes-prone rat. Is the gut flora involved in the development of type 1 diabetes? Diabetologia 49: 2105–2108, 2006 [DOI] [PubMed] [Google Scholar]
- 10.Bry L, Falk PG, Midtvedt T, Gordon JI. A model of host-microbial interactions in an open mammalian ecosystem. Science 273: 1380–1383, 1996 [DOI] [PubMed] [Google Scholar]
- 11.Caldwell DR, Arcand C. Inorganic and metal-organic growth requirements of the genus Bacteroides. J Bacteriol 120: 322–333, 1974 [DOI] [PMC free article] [PubMed] [Google Scholar]
- 12.Caldwell DR, Keeney M, Barton JS, Kelley JF. Sodium and other inorganic growth requirements of bacteroides amylophilus. J Bacteriol 114: 782–789, 1973 [DOI] [PMC free article] [PubMed] [Google Scholar]
- 13.Castillo M, Martin-Orue SM, Manzanilla EG, Badiola I, Martin M, Gasa J. Quantification of total bacteria, enterobacteria and lactobacilli populations in pig digesta by real-time PCR. Vet Microbiol 114: 165–170, 2006 [DOI] [PubMed] [Google Scholar]
- 14.Chang JY, Antonopoulos DA, Kalra A, Tonelli A, Khalife WT, Schmidt TM, Young VB. Decreased diversity of the fecal Microbiome in recurrent Clostridium difficile-associated diarrhea. J Infect Dis 197: 435–438, 2008 [DOI] [PubMed] [Google Scholar]
- 15.Comstock LE, Coyne MJ. Bacteroides thetaiotaomicron: a dynamic, niche-adapted human symbiont. Bioessays 25: 926–929, 2003 [DOI] [PubMed] [Google Scholar]
- 16.Coyne MJ, Reinap B, Lee MM, Comstock LE. Human symbionts use a host-like pathway for surface fucosylation. Science 307: 1778–1781, 2005 [DOI] [PubMed] [Google Scholar]
- 17.Cunningham SA, Worrell RT, Benos DJ, Frizzell RA. cAMP-stimulated ion currents in Xenopus oocytes expressing CFTR cRNA. Am J Physiol Cell Physiol 262: C783–C788, 1992 [DOI] [PubMed] [Google Scholar]
- 18.Dalwai F, Spratt DA, Pratten J. Use of quantitative PCR and culture methods to characterize ecological flux in bacterial biofilms. J Clin Microbiol 45: 3072–3076, 2007 [DOI] [PMC free article] [PubMed] [Google Scholar]
- 19.Deneve C, Janoir C, Poilane I, Fantinato C, Collignon A. New trends in Clostridium difficile virulence and pathogenesis. Int J Antimicrob Agents 33, Suppl 1: S24–S28, 2009 [DOI] [PubMed] [Google Scholar]
- 20.Deplancke B, Vidal O, Ganessunker D, Donovan SM, Mackie RI, Gaskins HR. Selective growth of mucolytic bacteria including Clostridium perfringens in a neonatal piglet model of total parenteral nutrition. Am J Clin Nutr 76: 1117–1125, 2002 [DOI] [PubMed] [Google Scholar]
- 21.Donnelly GA, Lu J, Takeda T, McKay DM. Colonic epithelial physiology is altered in response to the bacterial superantigen Yersinia pseudotuberculosis mitogen. J Infect Dis 180: 1590–1596, 1999 [DOI] [PubMed] [Google Scholar]
- 22.Drumm ML, Wilkinson DJ, Smit LS, Worrell RT, Strong TV, Frizzell RA, Dawson DC, Collins FS. Chloride conductance expressed by delta F508 and other mutant CFTRs in Xenopus oocytes. Science 254: 1797–1799, 1991 [DOI] [PubMed] [Google Scholar]
- 23.Endt K, Stecher B, Chaffron S, Slack E, Tchitchek N, Benecke A, Van Maele L, Sirard JC, Mueller AJ, Heikenwalder M, Macpherson AJ, Strugnell R, von Mering C, Hardt WD. The microbiota mediates pathogen clearance from the gut lumen after non-typhoidal Salmonella diarrhea. PLoS Pathog 6: e1001097, 2010 [DOI] [PMC free article] [PubMed] [Google Scholar]
- 24.Everard A, Lazarevic V, Derrien M, Girard M, Muccioli GG, Neyrinck AM, Possemiers S, Van Holle A, Francois P, de Vos WM, Delzenne NM, Schrenzel J, Cani PD. Responses of gut microbiota and glucose and lipid metabolism to prebiotics in genetic obese and diet-induced leptin-resistant mice. Diabetes 60: 2775–2786, 2011 [DOI] [PMC free article] [PubMed] [Google Scholar]
- 25.Ferreira RB, Gill N, Willing BP, Antunes LC, Russell SL, Croxen MA, Finlay BB. The intestinal microbiota plays a role in Salmonella-induced colitis independent of pathogen colonization. PLoS One 6: e20338, 2011 [DOI] [PMC free article] [PubMed] [Google Scholar]
- 26.Fierer N, Jackson JA, Vilgalys R, Jackson RB. Assessment of soil microbial community structure by use of taxon-specific quantitative PCR assays. Appl Environ Microbiol 71: 4117–4120, 2005 [DOI] [PMC free article] [PubMed] [Google Scholar]
- 27.Fite A, Macfarlane GT, Cummings JH, Hopkins MJ, Kong SC, Furrie E, Macfarlane S. Identification and quantitation of mucosal and faecal desulfovibrios using real time polymerase chain reaction. Gut 53: 523–529, 2004 [DOI] [PMC free article] [PubMed] [Google Scholar]
- 28.Frank DN, St Amand AL, Feldman RA, Boedeker EC, Harpaz N, Pace NR. Molecular-phylogenetic characterization of microbial community imbalances in human inflammatory bowel diseases. Proc Natl Acad Sci USA 104: 13780–13785, 2007 [DOI] [PMC free article] [PubMed] [Google Scholar]
- 29.Frantz AL, Rogier EW, Weber CR, Shen L, Cohen DA, Fenton LA, Bruno ME, Kaetzel CS. Targeted deletion of MyD88 in intestinal epithelial cells results in compromised antibacterial immunity associated with downregulation of polymeric immunoglobulin receptor, mucin-2, and antibacterial peptides. Mucosal Immunol 5: 501–512, 2012 [DOI] [PMC free article] [PubMed] [Google Scholar]
- 30.Garrett WS, Lord GM, Punit S, Lugo-Villarino G, Mazmanian SK, Ito S, Glickman JN, Glimcher LH. Communicable ulcerative colitis induced by T-bet deficiency in the innate immune system. Cell 131: 33–45, 2007 [DOI] [PMC free article] [PubMed] [Google Scholar]
- 31.Gawenis LR, Stien X, Shull GE, Schultheis PJ, Woo AL, Walker NM, Clarke LL. Intestinal NaCl transport in NHE2 and NHE3 knockout mice. Am J Physiol Gastrointest Liver Physiol 282: G776–G784, 2002 [DOI] [PubMed] [Google Scholar]
- 32.Goodman AL, McNulty NP, Zhao Y, Leip D, Mitra RD, Lozupone CA, Knight R, Gordon JI. Identifying genetic determinants needed to establish a human gut symbiont in its habitat. Cell Host Microbe 6: 279–289, 2009 [DOI] [PMC free article] [PubMed] [Google Scholar]
- 33.Gorkiewicz G, Thallinger GG, Trajanoski S, Lackner S, Stocker G, Hinterleitner T, Gully C, Hogenauer C. Alterations in the colonic microbiota in response to osmotic diarrhea. PLoS One 8: e55817, 2013 [DOI] [PMC free article] [PubMed] [Google Scholar]
- 34.Guo X, Xia X, Tang R, Zhou J, Zhao H, Wang K. Development of a real-time PCR method for Firmicutes and Bacteroidetes in faeces and its application to quantify intestinal population of obese and lean pigs. Lett Appl Microbiol 47: 367–373, 2008 [DOI] [PubMed] [Google Scholar]
- 35.Hansen JJ, Huang Y, Peterson DA, Goeser L, Fan TJ, Chang EB, Sartor RB. The colitis-associated transcriptional profile of commensal Bacteroides thetaiotaomicron enhances adaptive immune responses to a bacterial antigen. PLoS One 7: e42645, 2012 [DOI] [PMC free article] [PubMed] [Google Scholar]
- 36.Hayashi H, Szaszi K, Coady-Osberg N, Furuya W, Bretscher AP, Orlowski J, Grinstein S. Inhibition and redistribution of NHE3, the apical Na+/H+ exchanger, by Clostridium difficile toxin B. J Gen Physiol 123: 491–504, 2004 [DOI] [PMC free article] [PubMed] [Google Scholar]
- 37.Heimesaat MM, Bereswill S, Fischer A, Fuchs D, Struck D, Niebergall J, Jahn HK, Dunay IR, Moter A, Gescher DM, Schumann RR, Gobel UB, Liesenfeld O. Gram-negative bacteria aggravate murine small intestinal Th1-type immunopathology following oral infection with Toxoplasma gondii. J Immunol 177: 8785–8795, 2006 [DOI] [PubMed] [Google Scholar]
- 38.Hilpert W, Schink B, Dimroth P. Life by a new decarboxylation-dependent energy conservation mechanism with Na as coupling ion. EMBO J 3: 1665–1670, 1984 [DOI] [PMC free article] [PubMed] [Google Scholar]
- 39.Hitchcock MJ, Ginns EI, Marcus-Sekura CJ. Microinjection into Xenopus oocytes: equipment. Methods Enzymol 152: 276–284, 1987 [DOI] [PubMed] [Google Scholar]
- 40.Hooper LV, Falk PG, Gordon JI. Analyzing the molecular foundations of commensalism in the mouse intestine. Curr Opin Microbiol 3: 79–85, 2000 [DOI] [PubMed] [Google Scholar]
- 41.Hooper LV, Xu J, Falk PG, Midtvedt T, Gordon JI. A molecular sensor that allows a gut commensal to control its nutrient foundation in a competitive ecosystem. Proc Natl Acad Sci USA 96: 9833–9838, 1999 [DOI] [PMC free article] [PubMed] [Google Scholar]
- 42.IJssennagger N, Derrien M, van Doorn GM, Rijnierse A, van den Bogert B, Muller M, Dekker J, Kleerebezem M, van der Meer R. Dietary heme alters microbiota and mucosa of mouse colon without functional changes in host-microbe cross-talk. PLoS One 7: e49868, 2012 [DOI] [PMC free article] [PubMed] [Google Scholar]
- 43.Ikegami M, Kawano M, Takase K, Yamato I, Igarashi K, Kakinuma Y. Enterococcus hirae vacuolar ATPase is expressed in response to pH as well as sodium. FEBS Lett 454: 67–70, 1999 [DOI] [PubMed] [Google Scholar]
- 44.Jank T, Aktories K. Structure and mode of action of clostridial glucosylating toxins: the ABCD model. Trends Microbiol 16: 222–229, 2008 [DOI] [PubMed] [Google Scholar]
- 45.Kakinuma Y. Inorganic cation transport and energy transduction in Enterococcus hirae and other streptococci. Microbiol Mol Biol Rev 62: 1021–1045, 1998 [DOI] [PMC free article] [PubMed] [Google Scholar]
- 46.Kelly CP, LaMont JT. Clostridium difficile infection. Annu Rev Med 49: 375–390, 1998 [DOI] [PubMed] [Google Scholar]
- 47.Larsen N, Vogensen FK, van den Berg FW, Nielsen DS, Andreasen AS, Pedersen BK, Al-Soud WA, Sorensen SJ, Hansen LH, Jakobsen M. Gut microbiota in human adults with type 2 diabetes differs from non-diabetic adults. PLoS One 5: e9085, 2010 [DOI] [PMC free article] [PubMed] [Google Scholar]
- 48.Larsen RD, Ernst LK, Nair RP, Lowe JB. Molecular cloning, sequence, and expression of a human GDP-L-fucose:beta-D-galactoside 2-alpha-L-fucosyltransferase cDNA that can form the H blood group antigen. Proc Natl Acad Sci USA 87: 6674–6678, 1990 [DOI] [PMC free article] [PubMed] [Google Scholar]
- 49.Laubitz D, Larmonier CB, Bai A, Midura-Kiela MT, Lipko MA, Thurston RD, Kiela PR, Ghishan FK. Colonic gene expression profile in NHE3-deficient mice: evidence for spontaneous distal colitis. Am J Physiol Gastrointest Liver Physiol 295: G63–G77, 2008 [DOI] [PMC free article] [PubMed] [Google Scholar]
- 50.Lee J, Kim S, Jung J, Oh B, Kim I, Hong S. Analysis of total bacteria, enteric members of y-proteobacteria and microbial communities in seawater as indirect indicators for quantifying biofouling. Environ Eng Res 14: 19–25, 2009 [Google Scholar]
- 51.Ley RE, Backhed F, Turnbaugh P, Lozupone CA, Knight RD, Gordon JI. Obesity alters gut microbial ecology. Proc Natl Acad Sci USA 102: 11070–11075, 2005 [DOI] [PMC free article] [PubMed] [Google Scholar]
- 52.Ley RE, Turnbaugh PJ, Klein S, Gordon JI. Microbial ecology: human gut microbes associated with obesity. Nature 444: 1022–1023, 2006 [DOI] [PubMed] [Google Scholar]
- 53.Li HS, Doyle WJ, Swarts JD, Hebda PA. Suppression of epithelial ion transport transcripts during pneumococcal acute otitis media in the rat. Acta Otolaryngol (Stockh) 122: 488–494, 2002 [DOI] [PubMed] [Google Scholar]
- 54.Lu J, Wang A, Ansari S, Hershberg RM, McKay DM. Colonic bacterial superantigens evoke an inflammatory response and exaggerate disease in mice recovering from colitis. Gastroenterology 125: 1785–1795, 2003 [DOI] [PubMed] [Google Scholar]
- 55.Magalhaes A, Gomes J, Ismail MN, Haslam SM, Mendes N, Osorio H, David L, Le Pendu J, Haas R, Dell A, Boren T, Reis CA. Fut2-null mice display an altered glycosylation profile and impaired BabA-mediated Helicobacter pylori adhesion to gastric mucosa. Glycobiology 19: 1525–1536, 2009 [DOI] [PMC free article] [PubMed] [Google Scholar]
- 56.Manichanh C, Rigottier-Gois L, Bonnaud E, Gloux K, Pelletier E, Frangeul L, Nalin R, Jarrin C, Chardon P, Marteau P, Roca J, Dore J. Reduced diversity of faecal microbiota in Crohn's disease revealed by a metagenomic approach. Gut 55: 205–211, 2006 [DOI] [PMC free article] [PubMed] [Google Scholar]
- 57.Meng D, Newburg DS, Young C, Baker A, Tonkonogy SL, Sartor RB, Walker WA, Nanthakumar NN. Bacterial symbionts induce a FUT2-dependent fucosylated niche on colonic epithelium via ERK and JNK signaling. Am J Physiol Gastrointest Liver Physiol 293: G780–G787, 2007 [DOI] [PubMed] [Google Scholar]
- 58.Moore WE, Holdeman LV. Human fecal flora: the normal flora of 20 Japanese-Hawaiians. Appl Microbiol 27: 961–979, 1974 [DOI] [PMC free article] [PubMed] [Google Scholar]
- 59.Mylonakis E, Ryan ET, Calderwood SB. Clostridium difficile-Associated diarrhea: A review. Arch Intern Med 161: 525–533, 2001 [DOI] [PubMed] [Google Scholar]
- 60.Naaber P, Mikelsaar RH, Salminen S, Mikelsaar M. Bacterial translocation, intestinal microflora and morphological changes of intestinal mucosa in experimental models of Clostridium difficile infection. J Med Microbiol 47: 591–598, 1998 [DOI] [PubMed] [Google Scholar]
- 61.Norkina O, Burnett TG, De Lisle RC. Bacterial overgrowth in the cystic fibrosis transmembrane conductance regulator null mouse small intestine. Infect Immun 72: 6040–6049, 2004 [DOI] [PMC free article] [PubMed] [Google Scholar]
- 62.Ott SJ, Musfeldt M, Ullmann U, Hampe J, Schreiber S. Quantification of intestinal bacterial populations by real-time PCR with a universal primer set and minor groove binder probes: a global approach to the enteric flora. J Clin Microbiol 42: 2566–2572, 2004 [DOI] [PMC free article] [PubMed] [Google Scholar]
- 63.Padan E. The enlightening encounter between structure and function in the NhaA Na+-H+ antiporter. Trends Biochem Sci 33: 435–443, 2008 [DOI] [PubMed] [Google Scholar]
- 64.Padan E, Tzubery T, Herz K, Kozachkov L, Rimon A, Galili L. NhaA of Escherichia coli, as a model of a pH-regulated Na+/H+antiporter. Biochim Biophys Acta 1658: 2–13, 2004 [DOI] [PubMed] [Google Scholar]
- 65.Peterson DA, McNulty NP, Guruge JL, Gordon JI. IgA response to symbiotic bacteria as a mediator of gut homeostasis. Cell Host Microbe 2: 328–339, 2007 [DOI] [PubMed] [Google Scholar]
- 66.Pinner E, Kotler Y, Padan E, Schuldiner S. Physiological role of nhaB, a specific Na+/H+ antiporter in Escherichia coli. J Biol Chem 268: 1729–1734, 1993 [PubMed] [Google Scholar]
- 67.Salzman NH, Hung K, Haribhai D, Chu H, Karlsson-Sjoberg J, Amir E, Teggatz P, Barman M, Hayward M, Eastwood D, Stoel M, Zhou Y, Sodergren E, Weinstock GM, Bevins CL, Williams CB, Bos NA. Enteric defensins are essential regulators of intestinal microbial ecology. Nat Immunol 11: 76–83, 2010 [DOI] [PMC free article] [PubMed] [Google Scholar]
- 68.Sartor RB. Microbial influences in inflammatory bowel diseases. Gastroenterology 134: 577–594, 2008 [DOI] [PubMed] [Google Scholar]
- 69.Sato T, Vries RG, Snippert HJ, van de Wetering M, Barker N, Stange DE, van Es JH, Abo A, Kujala P, Peters PJ, Clevers H. Single Lgr5 stem cells build crypt-villus structures in vitro without a mesenchymal niche. Nature 459: 262–265, 2009 [DOI] [PubMed] [Google Scholar]
- 70.Scanlan PD, Shanahan F, O'Mahony C, Marchesi JR. Culture-independent analyses of temporal variation of the dominant fecal microbiota and targeted bacterial subgroups in Crohn's disease. J Clin Microbiol 44: 3980–3988, 2006 [DOI] [PMC free article] [PubMed] [Google Scholar]
- 71.Schjorring S, Krogfelt KA. Assessment of bacterial antibiotic resistance transfer in the gut. Int J Microbiol 2011: 312956, 2011 [DOI] [PMC free article] [PubMed] [Google Scholar]
- 72.Schultheis PJCL, Meneton P, Miller ML, Soleimani M, Gawenis LR, Riddle TM, Duffy JJ, Doetschman T, Wang T, Giebisch G, Aronson PS, Lorenz JN, Shull GE. Renal and intestinal absorptive defects in mice lacking the NHE3. Nat Genet 19: 282–285, 1998 [DOI] [PubMed] [Google Scholar]
- 73.Sekirov I, Tam NM, Jogova M, Robertson ML, Li Y, Lupp C, Finlay BB. Antibiotic-induced perturbations of the intestinal microbiota alter host susceptibility to enteric infection. Infect Immun 76: 4726–4736, 2008 [DOI] [PMC free article] [PubMed] [Google Scholar]
- 74.Serino M, Luche E, Gres S, Baylac A, Berge M, Cenac C, Waget A, Klopp P, Iacovoni J, Klopp C, Mariette J, Bouchez O, Lluch J, Ouarne F, Monsan P, Valet P, Roques C, Amar J, Bouloumie A, Theodorou V, Burcelin R. Metabolic adaptation to a high-fat diet is associated with a change in the gut microbiota. Gut 61: 543–553, 2012 [DOI] [PMC free article] [PubMed] [Google Scholar]
- 75.Skulachev VP. Chemiosmotic systems in bioenergetics: H(+)-cycles and Na(+)-cycles. Biosci Rep 11: 387–441; discussion 441–384, 1991 [DOI] [PubMed] [Google Scholar]
- 76.Skulachev VP. Membrane-linked energy transductions. Bioenergetic functions of sodium: H+ is not unique as a coupling ion. Eur J Biochem 151: 199–208, 1985 [DOI] [PubMed] [Google Scholar]
- 77.Skulachev VP. The sodium cycle: a novel type of bacterial energetics. J Bioenerg Biomembr 21: 635–647, 1989 [DOI] [PubMed] [Google Scholar]
- 78.Sonnenburg JL, Xu J, Leip DD, Chen CH, Westover BP, Weatherford J, Buhler JD, Gordon JI. Glycan foraging in vivo by an intestine-adapted bacterial symbiont. Science 307: 1955–1959, 2005 [DOI] [PubMed] [Google Scholar]
- 79.Speelmans G, Poolman B, Abee T, Konings WN. Energy transduction in the thermophilic anaerobic bacterium Clostridium fervidus is exclusively coupled to sodium ions. Proc Natl Acad Sci USA 90: 7975–7979, 1993 [DOI] [PMC free article] [PubMed] [Google Scholar]
- 80.Talbot C, Lytle C. Segregation of Na/H exchanger-3 and Cl/HCO3 exchanger SLC26A3 (DRA) in rodent cecum and colon. Am J Physiol Gastrointest Liver Physiol 299: G358–G367, 2010 [DOI] [PubMed] [Google Scholar]
- 81.Tasteyre A, Barc MC, Collignon A, Boureau H, Karjalainen T. Role of FliC and FliD flagellar proteins of Clostridium difficile in adherence and gut colonization. Infect Immun 69: 7937–7940, 2001 [DOI] [PMC free article] [PubMed] [Google Scholar]
- 82.Thiru S, Devereux G, King A. Abnormal fucosylation of ileal mucus in cystic fibrosis: I. A histochemical study using peroxidase labelled lectins. J Clin Pathol 43: 1014–1018, 1990 [DOI] [PMC free article] [PubMed] [Google Scholar]
- 83.Thomsson KA, Hinojosa-Kurtzberg M, Axelsson KA, Domino SE, Lowe JB, Gendler SJ, Hansson GC. Intestinal mucins from cystic fibrosis mice show increased fucosylation due to an induced Fucalpha1–2 glycosyltransferase. Biochem J 367: 609–616, 2002 [DOI] [PMC free article] [PubMed] [Google Scholar]
- 84.Turnbaugh PJ, Backhed F, Fulton L, Gordon JI. Diet-induced obesity is linked to marked but reversible alterations in the mouse distal gut microbiome. Cell Host Microbe 3: 213–223, 2008 [DOI] [PMC free article] [PubMed] [Google Scholar]
- 85.Turnbaugh PJ, Hamady M, Yatsunenko T, Cantarel BL, Duncan A, Ley RE, Sogin ML, Jones WJ, Roe BA, Affourtit JP, Egholm M, Henrissat B, Heath AC, Knight R, Gordon JI. A core gut microbiome in obese and lean twins. Nature 457: 480–484, 2009 [DOI] [PMC free article] [PubMed] [Google Scholar]
- 86.Turnbaugh PJ, Ley RE, Mahowald MA, Magrini V, Mardis ER, Gordon JI. An obesity-associated gut microbiome with increased capacity for energy harvest. Nature 444: 1027–1031, 2006 [DOI] [PubMed] [Google Scholar]
- 87.Van der Sluis M, De Koning BA, De Bruijn AC, Velcich A, Meijerink JP, Van Goudoever JB, Buller HA, Dekker J, Van Seuningen I, Renes IB, Einerhand AW. Muc2-deficient mice spontaneously develop colitis, indicating that MUC2 is critical for colonic protection. Gastroenterology 131: 117–129, 2006 [DOI] [PubMed] [Google Scholar]
- 88.Voth DE, Ballard JD. Clostridium difficile toxins: mechanism of action and role in disease. Clin Microbiol Rev 18: 247–263, 2005 [DOI] [PMC free article] [PubMed] [Google Scholar]
- 89.Wilson DM, Wilson TH. Cation specificity for sugar substrates of the melibiose carrier in Escherichia coli. Biochim Biophys Acta 904: 191–200, 1987 [DOI] [PubMed] [Google Scholar]
- 90.Woo AL, Gildea LA, Tack LM, Miller ML, Spicer Z, Millhorn DE, Finkelman FD, Hassett DJ, Shull GE. In vivo evidence for interferon-gamma-mediated homeostatic mechanisms in small intestine of the NHE3 Na+/H+ exchanger knockout model of congenital diarrhea. J Biol Chem 277: 49036–49046, 2002 [DOI] [PubMed] [Google Scholar]
- 91.Xu J, Bjursell MK, Himrod J, Deng S, Carmichael LK, Chiang HC, Hooper LV, Gordon JI. A genomic view of the human-Bacteroides thetaiotaomicron symbiosis. Science 299: 2074–2076, 2003 [DOI] [PubMed] [Google Scholar]
- 92.Young VB, Schmidt TM. Antibiotic-associated diarrhea accompanied by large-scale alterations in the composition of the fecal microbiota. J Clin Microbiol 42: 1203–1206, 2004 [DOI] [PMC free article] [PubMed] [Google Scholar]