Abstract
Thiazolidinediones (TZDs), which are synthetic peroxisome proliferator-activated receptor subtype-γ (PPARγ), agonists are highly effective for treatment of type 2 diabetes. However, the side effect of fluid retention has significantly limited their application. Most of the previous studies addressing TZD-induced fluid retention employed healthy animals. The underlying mechanism of this phenomenon is still incompletely understood, particularly in the setting of disease state. The present study was undertaken to examine rosiglitazone (RGZ)-induced fluid retention in db/db mice and to further investigate the underlying mechanism. In response to RGZ treatment, db/db mice exhibited an accelerated plasma volume expansion as assessed by hematocrit (Hct) and fluorescent nanoparticles, in parallel with a greater increase in body weight, compared with lean controls. In response to RGZ-induced fluid retention, urinary Na+ excretion and urine volume were significantly increased in lean mice. In contrast, the natriuretic and diuretic responses were significantly blunted in db/db mice. RGZ db/db mice exhibited a parallel decrease in plasma Na+ concentration and plasma osmolality, contrasting to unchanged levels in lean controls. Imunoblotting analysis showed downregulation of renal aquaporin (AQP) 2 expression in response to RGZ treatment in lean mice but not in db/db mice. Renal AQP3 protein expression was unaffected by RGZ treatment in lean mice but was elevated in db/db mice. In contrast, the expression of Na+/H+ exchanger-3 (NHE3) and NKCC2 was unchanged in either mouse strain. Together these results suggest that compared with the lean controls, db/db mice exhibited accelerated plasma volume expansion that was in part due to the inappropriate response of renal water transporters.
Keywords: db/db, nanoparticle, plasma volume, PPARγ, rosiglitazone
the peroxisome proliferator-activated receptor subtype-γ (PPARγ) ligands, the synthetic insulin-sensitizing thiazolidinediones (TZD) compounds, are used for glycemic control in patients with diabetes mellitus (13). Currently, two TZDs, rosiglitazone (RGZ) and pioglitazone, are available, since RGZ was withdrawn from the market in Europe and its use is restricted in the United States due to concerns about the increased risk of myocardial infarction in several clinical trials (18). TZDs lower blood glucose by increasing insulin sensitivity, improving lipid profile, attenuating microalbuminuria, decreasing blood pressure, and inhibiting inflammation in animal models and diabetic patients (6, 10, 14). Despite the favorable effect on glycemic control, these agents are associated with body weight gain and fluid retention, which is presented as edema in extremities in at least 5% of patients and can progress to pulmonary edema and congestive heart failure (4, 20, 29). TZD usually leads to a 6–7% increase in blood volume in healthy volunteers (1, 2). The blood volume expansion can cause blood cell dilution, resulting in reduction of hematocrit (Hct). The changes in Hct have been used as a surrogate marker for TZD-induced plasma volume expansion. Viswanathan et al. (27) recently showed that of 260 patients on RGZ, 70% had plasma volume expansion as reflected by a drop of Hct. The severity of the side effect increases in patients treated with TZD in combination with insulin therapy (15). The fluid retention is often resistant to loop diuretics until the TZD therapy is discontinued (12, 17, 28).
The mechanism of TZD-induced fluid retention has been extensively investigated. Abundant evidence supports increased renal tubular transport as a major contributor of TZD-induced fluid retention although extrarenal mechanisms also play a role. Within the kidney, PPARγ is predominantly expressed in the inner medulla and in inner medullary collecting duct (17, 18); an important site for the control of fluid metabolism. Collecting duct-specific deletion of PPARγ attenuates plasma volume expansion induced by RGZ or pioglitazone (9, 30). ENaC is composed of three subunits (α, β, and γ) and serves a major route for Na+ reabsorption across the apical membrane of the CD. There are conflicting reports on PPARγ regulation of ENaC. ENaCγ transcription was originally shown to be upregulated by PPARγ activation (9), but the expression of all three ENaC subunits was subsequently found to be suppressed by RGZ (5). Other reports showed that activation of other transporters, such as Na+/H+ exchanger-3 (NHE3), NCC, and aquaporin (AQP)-2 and -3, may also play a contributory role (24). However, most of these studies employed normal animals, which may have limited the relevance to the clinical setting of diabetic patients treated with a TZD. The goal of the present study was to systematically examine the RGZ-induced fluid retention response in db/db vs. lean control mice to further investigate the underlying mechanism.
METHODS
Animals.
Male leptin receptor-deficient obese-diabetic db/db [B6.BKS(D)-Leprdb/J] and nondiabetic db/m lean mice were purchased from Jackson Laboratories (Bar Harbor, ME). All animals were housed at the University of Utah Comparative Medicine Center, maintained on a 12-h light/dark cycle, and provided with food and water ad libitum. All animal procedures were approved by the University of Utah Institutional Animal Care and Use Committee.
RGZ treatment.
RGZ was incorporated into a chow-based diet (LabDiet Rodent Chow 5001; Purina) at a level of 80 mg/kg diet. RGZ maleate (BRL49653C) was obtained from GlaxoSmithKline (Harlow, UK). The gelled diets were made by melting agar (1% by weight) in water (60%), cooling, and adding the drug and ground chow (39%). The same gelled diets without the drug served as controls. The mice were fed ad libitum. The db/db and lean mice were acclimatized to the control diet for 7 days. After the 7-day acclimation period, animals were placed on the gelled diet with or without RGZ for 14 days. Based on a measured average food intake of 7 g·day−1·mouse−1 for lean mice and 14 g·day−1·mouse−1 for db/db mice, the average dose of RGZ administered in both strains approximated 20 mg·kg wt−1·day−1. Measurements of body weight and collection of 24-h urine was performed.
Hct measurement.
Hct was measured before and after RGZ treatment. The sphenous vein was punctured using a 23-gauge needle, and one drop of blood (≈5–10 μl) was collected by using a 10-μl capillary glass (Idaho Technology, Salt Lake City, UT). One side of the tube was sealed with Hemato-Seal and then centrifuged for 2 min in a Thermo IEC (Boston, MA) microcentrifuge machine.
Nanoparticle measurement of plasma volume.
Measurement of plasma volume is traditionally reliant on the use of a dye tracer such as indocyanine green and Evans blue, which suffer numerous drawbacks including binding plasma proteins. Eisner et al. (7) have recently developed a nanotechnology-based method for accurate measurement of plasma volume in mice. Briefly, conscious mice received the fluorescent nanoparticle atto647 via a single bolus injection of suspension (100 μg in 50 μl of saline) into the tail vein. Seven minutes after tail vein injection, ∼50 μl of whole blood samples were collected via puncturing of the submandibular vein. After centrifugation at 4,000 rpm for 5 min, plasma was collected and subjected to fluorescence measurements by using FluostarOptima (BMG Labtech). Plasma volume was determined based on the dilution factors.
Quantitative RT-PCR.
Total RNA was isolated from renal tissues using TRIzol. One microgram of total RNA was denatured at 65°C for 5 min, and cDNA synthesis was then performed at 42°C for 1 h using Superscript reverse transcriptase (BRL, Gaithersburg, MD). Oligonucleotides were designed using Primer3 software (available at http://frodo.wi.mit.edu). Quantitative (q)PCR amplification was performed using SYBR Green Master Mix (Applied Biosystems) and the Prism 7500 Real-Time PCR Detection System (Applied Biosystems). Cycling conditions were 95°C for 10 min, followed by 40 repeats of 95°C for 15 s and 60°C for 1 min. The sequences of the oligonucleotide primers for are as follows: AQP2, 5′-ggacctggctgtcaatgct-3′(sense) and 5′-atcggtggaggcaaagatg-3′ (antisense); GAPDH, 5′-gtcttcactaccatggagaagg-3′ (sense) and 5′-tcatggatgaccttggccag-3′(antisense); and PPARγ, 5′-ctttatggagcctaagtttgagttt-3′ (sense) and 5′cagcaggttgtcttggatgt-3′ (antisense).
Immunoblotting.
Lysate of the whole kidney was stored at −80°C until assayed. Protein concentrations were determined using a Coomassie reagent. An equal amount of the whole tissue protein was denatured at 100°C for 5 min, separated by SDS-PAGE, and transferred to nitrocellulose membranes. The blots were blocked overnight with 5% nonfat dry milk in TBS, followed by incubation for 1 h with rabbit polyclonal antibodies against AQP2 (gift from Dr. Mark A. Knepper). The blots were washed with TBS followed by incubation with goat anti-rabbit horseradish peroxidase-conjugated secondary antibody. Immune complexes were detected using enhanced chemiluminescence methods. The immunoreactive bands were quantified using the Gel and Graph Digitizing System (Silk Scientific, Orem, UT).
Blood glucose and plasma triglyceride measurement.
Blood glucose levels were measured by CONTOUR blood glucose monitoring system (Bayer Healthcare, Mishawaka, IN). Plasma triglyceride was determined using a LabAssay Triglyceride ELISA Kit (catalog no. 290-63701; Wako).
Data analysis.
Data are summarized as means ± SE. Statistical analysis was performed using two-way ANOVA with the Bonferroni correction or Student's t-test as appropriate. P < 0.05 was considered statistically significant.
RESULTS
Effect of RGZ on body weight gain.
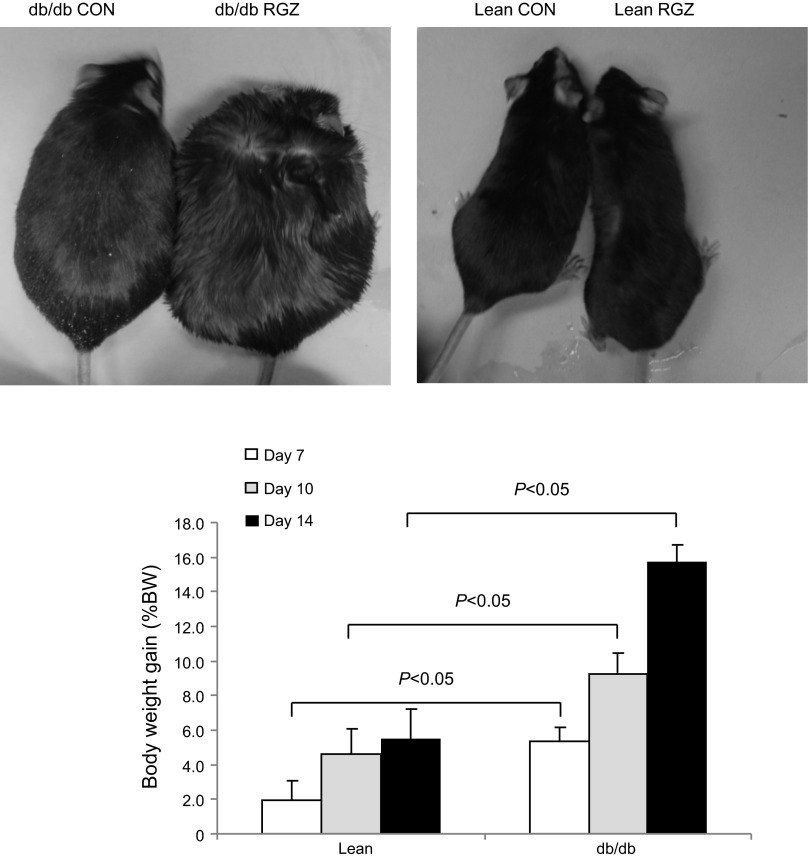
TZDs induce weight gain as a result of fluid retention, adipogenesis, or a combination of the two mechanisms (19). Starting from 4 mo of age, db/db and lean mice were administrated with RGZ (20 mg·kg body wt−1·day−1) for 14 days and body weight was monitored (Fig. 1). The body weight gain was 2.6 and 2.9 times greater in db/db mice than that in lean controls at days 7 and 14, respectively (day 7: 5.09 ± 2.2 vs. 1.95 ± 3%, P <0.05; day 14: 15.91 ± 3.01 vs. 5.51 ± 4.43%, P < 0.01).
Fig. 1.
Effect of rosiglitazone (RGZ) on body weight gain. Top: photograph of representative lean and db/db mice treated with vehicle or RGZ for 14 days. Bottom: body weight gain in lean and db/db mice over 14 days of RGZ treatment. CON, control (vehicle treatment). Data are means ± SE; n = 7 per group.
Effect of RGZ on plasma volume.
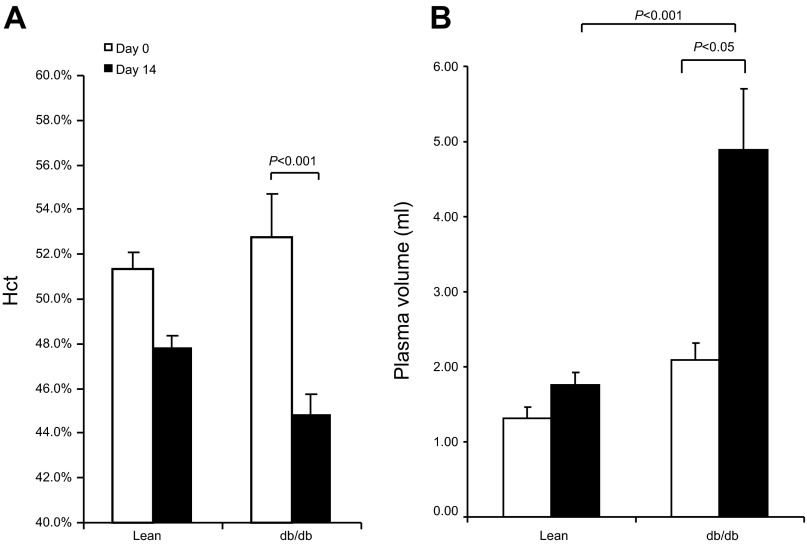
Since TZDs have no effect on erythropoiesis, the change in Hct has been used as a surrogate marker of TZD-induced fluid retention (11). We examined Hct before and after RGZ treatment and also employed a newly developed nanoparticle-based technology to directly evaluate the changes in plasma volume. At day 14, RGZ treatment consistently induced a fall of Hct in both strains of mice and the fall was greater in db/db than in lean group (db/db: 44.8 ± 2.6 vs. 54.7 ± 1.7%, P < 0.05; lean: 47.8 ± 1.3 vs. 51.4 ± 1.8%, P < 0.05; Fig. 2A). Subsequently, plasma volume was measured using a fluorescent nanoparticle. Consistent with the Hct data, RGZ treatment induced a 220% increase in plasma volume in db/db mice (4.67 ± 2.2 vs. 2.16 ± 0.65 ml, P < 0.05) contrasting to only 30% increase in lean mice (1.77 ± 0.41 vs. 1.22 ± 0.12 ml, P < 0.05; Fig. 2B).
Fig. 2.
Effect of RGZ on plasma volume. Lean and db/db mice were treated with RGZ for 14 days. Hematocrit (Hct; A) and nanoparticle measurement of plasma volume (B) were determined before and after 14-day RGZ treatment. Data are means ± SE. Lean mice: n = 6–7 per group.
Effect of RGZ on heart weight.
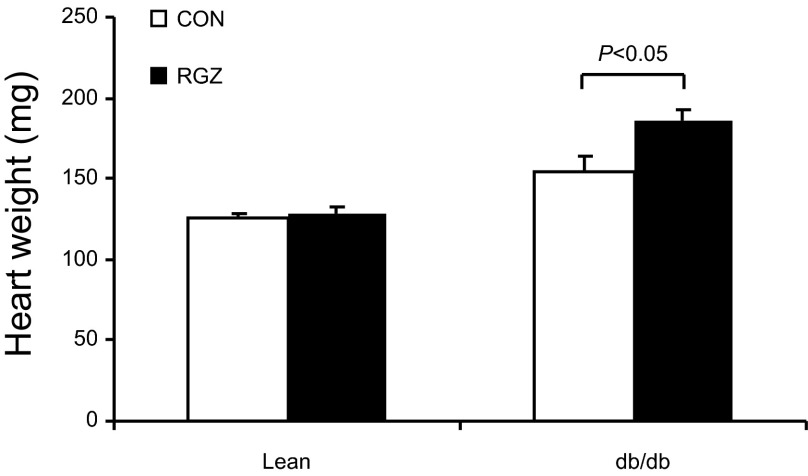
TZDs induce congestive heart failure in diabetic patients and cardiac hypertrophy in animals, possibly as a consequence of expanding plasma volume (3). Therefore, we evaluated heart weight in db/db and lean mice treated with RGZ. RGZ-treated db/db mice exhibited a significant increase in heart weight compared with vehicle control (185.6 ± 18.7 vs. 154.0 ± 17.6 mg, P <0.05). In contrast, no change in heart weight was found in lean controls (128.6 ± 12.0 vs. 125.7 ± 5.7 mg, P >0.05; Fig. 3). Histological analysis did not reveal obvious changes associated with RGZ treatment in db/db mice compared with vehicle control (data not shown).
Fig. 3.
Effect of RGZ on cardiac hypertrophy. Shown is heart weight in lean and db/db mice after 14-day treatment with vehicle or RGZ. Data are means ± SE. Lean CON: n = 3; lean RGZ: n = 6; db/db CON: n = 3; db/db RGZ: n = 6.
Effect of RGZ on blood glucose and plasma triglyceride levels.
At baseline, db/db mice exhibited significant hyperglycemia compared with lean mice (230 ± 40 vs. 142 ± 17 mg/dl, P < 0.01). The baseline values of plasma triglyceride in db/db mice were slightly higher than those in lean mice, but this difference did not reach a statistical significance (100 ± 45 vs. 60 ± 17 mg/dl). A 14-day treatment with RGZ decreased blood glucose and plasma triglyceride levels in db/db mice to a value comparable to the lean control.
Effect of RGZ on electrolyte and fluid metabolism.
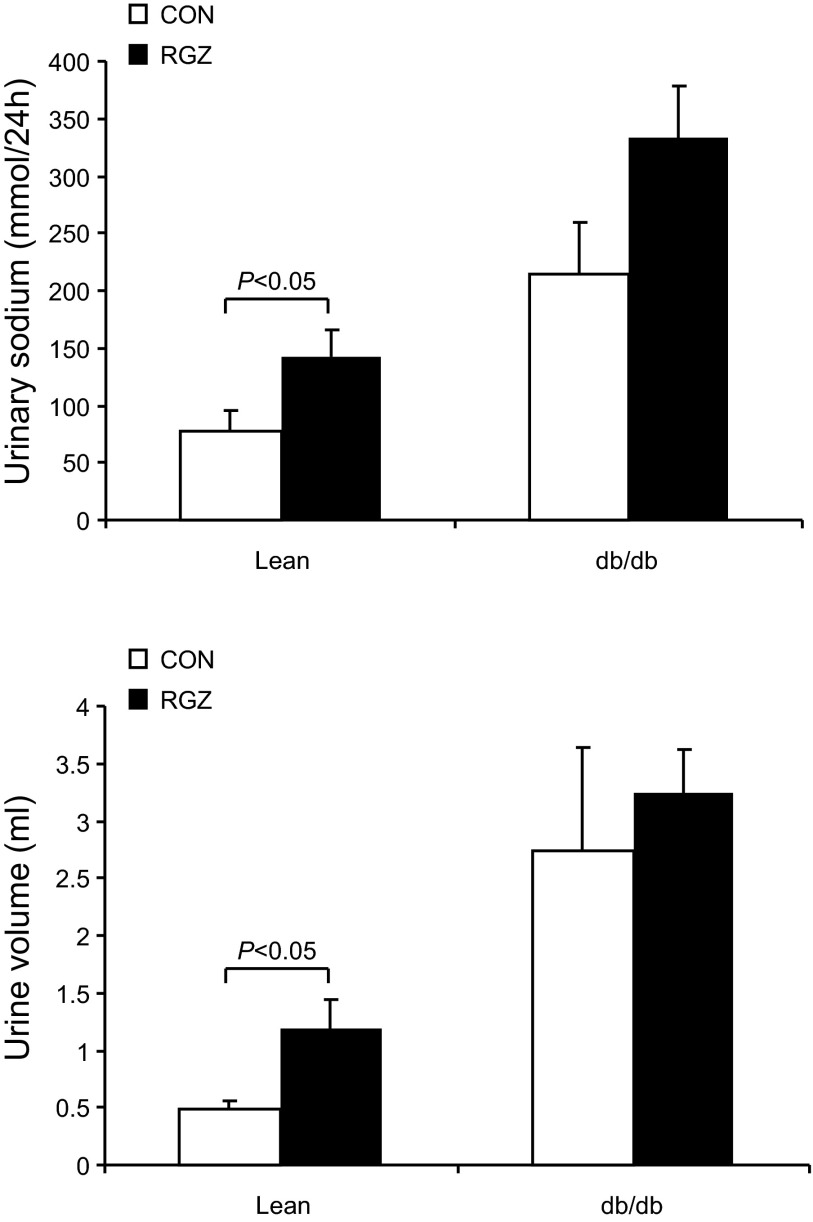
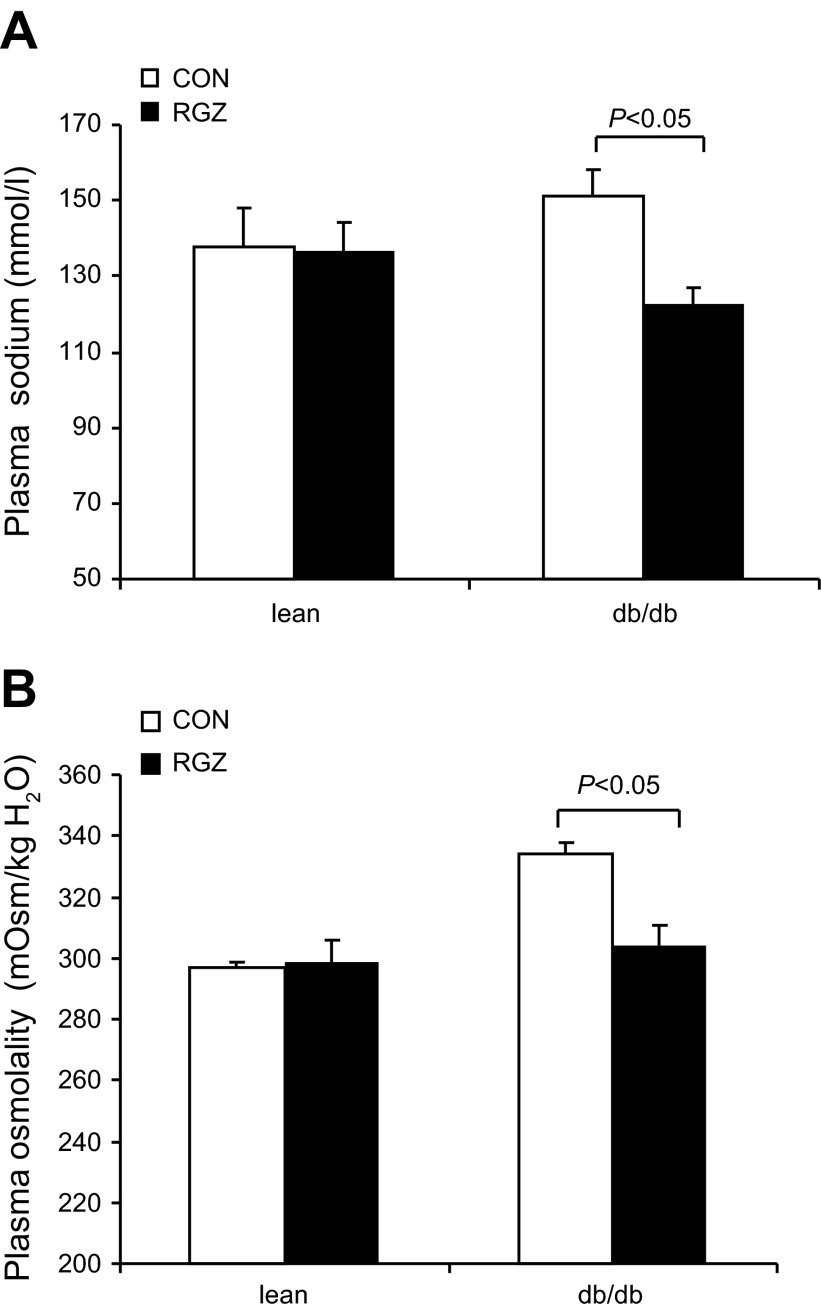
After a 14-day RGZ treatment, lean mice exhibited a significant increase in urinary Na+ excretion and urine volume. In contrast, in db/db mice, neither parameter was significantly affected by this treatment (Fig. 4). Plasma Na+ and plasma osmolality in lean mice remained unchanged after RGZ treatment (Fig. 5). However, in db/db mice, RGZ treatment induced parallel decreases in plasma Na+ concentration (122.9 ± 4.0 vs. 151.3 ± 7.1 mmol/l, P < 0.05) and plasma osmolality (304.2 ± 6.2 vs. 334 ± 3.5 mosmsol/kgH2O; Fig. 5), suggesting that the accumulation of water may have exceeded that of Na+.
Fig. 4.
Effect of RGZ on urinary Na+ excretion and urine volume. Top: urinary Na+ excretion of vehicle and RGZ-treated lean mice and db/db mice. bottom: urine volume of vehicle and RGZ-treated lean mice and db/db mice. Data are means ± SE; n = 4–5 per group.
Fig. 5.
Effect of RGZ on plasma Na+ concentration and osmolality. A: plasma Na+ concentration in vehicle and RGZ-treated lean mice and db/db mice. B: plasma osmolality. Data are means ± SE; n = 4–5 per group.
Effect of RGZ on renal expression of Na+ and water transporters.
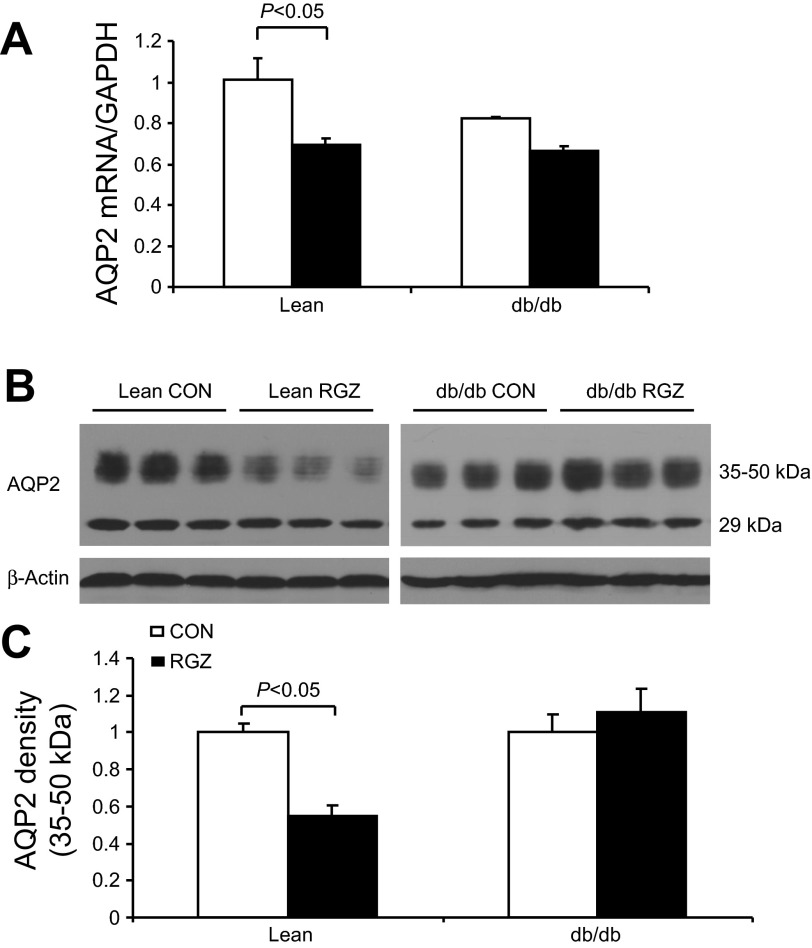
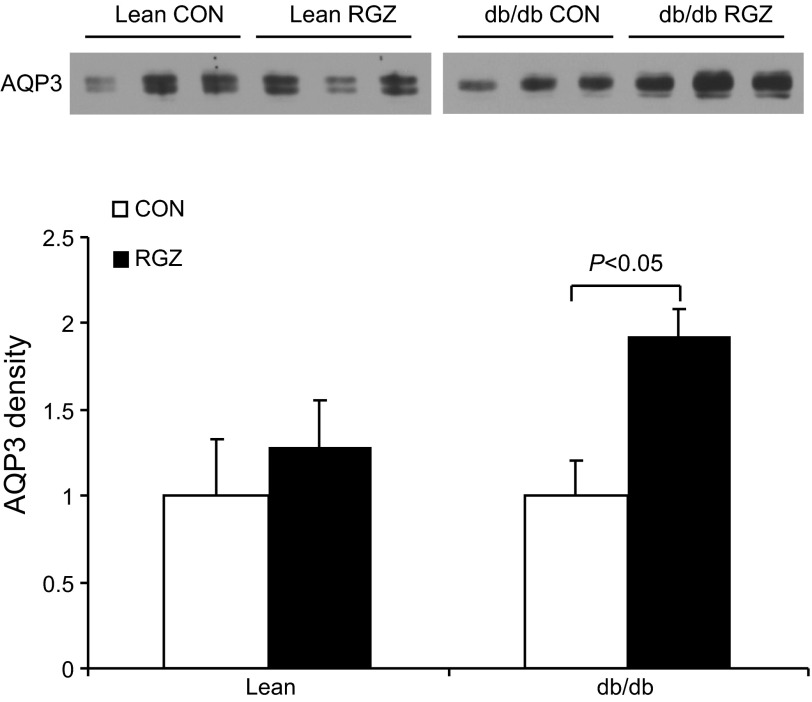
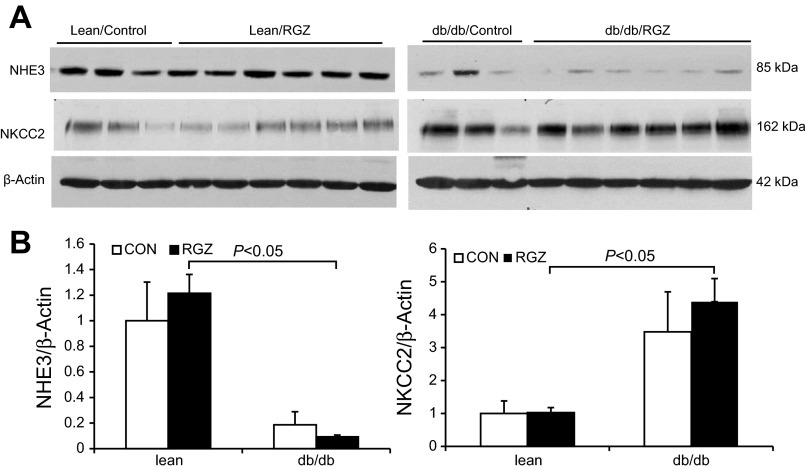
qRT-PCR detected a significant reduction of renal AQP2 mRNA in lean mice following 14-day RGZ treatment. In contrast, the AQP2 mRNA expression was unchanged in db/db mice (Fig. 6A). By immunoblotting, AQP2 protein was detected as 35- to 50-kDa bands as the glycosylated form and a 29-kDa band as the nonglycosylated form (Fig. 6B). In response to RGZ treatment, the glycosylated AQP2 exhibited a reduction in lean but not db/db mice. The nongycosylated AQP2 remained stable among different groups (Fig. 6, B and C). RGZ had no effect on renal AQP3 protein expression in lean controls but significantly increased it in db/db mice (Fig. 7). In contrast, we observed no change in renal protein expression of sodium transporters including NHE3 and NKCC2 in response to RGZ treatment irrespective of the mouse strain. Of note, db/db mice had decreased baseline protein expression of NHE3 but increased expression of NKCC2 compared with the lean controls (Fig. 8).
Fig. 6.
Effect of RGZ on aquaporin 2 (AQP2) expression. A: quantitative RT-PCR analysis of renal AQP2 mRNA expression in db/m and db/db mice treated with vehicle or RGZ. Value was normalized by GAPDH. B: immunoblots of AQP2 in the kidney. C: densitometric analysis of 35- to 50-kDa bands of AQP2. Expression levels were normalized to β-actin. Data are means ± SE; n = 4–5.
Fig. 7.
Effect of RGZ on AQP3 protein expression. A: immunoblots of AQP3 in the kidney of lean mice and db/db mice treated with vehicle or RGZ. B: densitometric analysis. Immunoblots for AQP2 was stripped and reprobed with anti-AQP3 antibody. Therefore, the same β-actin immunoblot shown in Fig. 6B was used to normalize the densitometry of AQP3 band. Data are means ± SE; n = 4–5.
Fig. 8.
Effect of RGZ on NHE3 and NKCC2 protein expression. A: immunoblots of NHE3 and NKCC2 in the kidney of lean mice and db/db mice treated with vehicle or RGZ. B: densitometric analysis. Expression levels were normalized to β-actin. Data are means ± SE; n = 4–5.
Effect of RGZ on renal expression of PPARγ.
To address the possibility that increased renal PPARγ expression may underlie the increased sensitivity of RGZ-induced fluid retention in db/db mice, we conducted qRT-PCR analysis of PPARγ mRNA expression in the kidneys of lean and db/db mice after vehicle or RGZ treatment. The results showed that renal PPARγ expression of db/db mice exhibited a tendency of a decrease rather than an increase and that the expression in either strain was unaffected by RGZ treatment (1.11 ± 0.1 in lean-RGZ vs. 1.03 ± 0.24 lean-control, P > 0.05; 0.857 ± 0.11 in db/db-RGZ vs. 0.7 ± 0.1 in db/db-control, n = 3–7, P > 0.05). The data suggest that the renal expression level of PPARγ may not be a major determinant of the differential response to RGZ treatment.
DISCUSSION
Despite intensive investigation, the mechanism of TZD-induced fluid retention remains incompletely understood. In particular, most of the previous studies employed healthy animals, which may have limited relevance to clinical practice involving all diabetic patients. Here, we investigated the difference in TZD-induced plasma volume expansion in db/db vs. lean control mice and further explored the underlying mechanism. Using Hct and nanoparticle-based method, we documented accelerated plasma volume expansion in response to 2-wk RGZ treatment in db/db mice vs. lean controls. Similar to a compensatory response to volume expansion, RGZ-treated lean mice exhibited increased urinary Na+ excretion and urine volume. In contrast, the natriuretic and diuretic responses were also almost absent in db/db mice. Downregulation of renal AQP2 expression in response to RGZ treatment was seen in lean mice but not in db/db mice. Renal AQP3 protein expression was unaffected by RGZ treatment in lean mice but was elevated in db/db mice.
Several previous studies reported that obese Zucker rats gained more weight than the lean controls (22). This accelerated body weight gain is suggested to be solely accountable by the increased fat mass through apolipoprotein E/very low-density lipoprotein receptor signaling in the adipocytes (25). However, there are no reports in the literature on differences of TZD-induced fluid retention in obese vs. lean animals. It remains uncertain as to whether obese animals exhibited increased susceptibility to TZD-induced plasma volume expansion compared with their lean controls; if so, what is the mechanism? To address this issue, we evaluated RGZ-induced plasma volume expansion in db/db and lean mice by the determination of Hct and the use of fluorescent nanoparticles. Of note, measurement of plasma volume is traditionally reliant on the use of a dye tracer such as indocyanine green and Evans blue, which suffer numerous drawbacks including binding plasma proteins. Eisner et al. (7) have recently developed a nanotechnology-based method for accurate measurement of plasma volume in mice. RGZ treatment induced a small but significant drop in Hct in lean mice, and this drop was greater in db/db mice. In line with this finding, the nanoparticle method detected a 220% increase in plasma volume in db/db mice contrasting to a 30% increase in the lean controls. The two independent methods consistently demonstrated the increased susceptibility of db/db mice to RGZ-induced plasma volume expansion. Further support of this notion comes from the observation that RGZ induced cardiac hypertrophy in db/db but not in lean mice. TZDs increase the incidence of congestive heart failure in clinical trials (16) and induce cardiac hypertrophy in experimental animals including mice, rats, and dogs (1, 3, 8, 21). TZD-inducing cardiac hypertrophy is likely secondary to expanding plasma volume although the direct cardiac action of the compounds is possible (23). To our knowledge, our study is the first to vigorously evaluate the volume status in TZD-treated diabetic animals.
It has been reported that a short term TZD treatment induces Na+ and water retention. Song et al. (24) have demonstrated that RGZ treatment in Sprague-Dawley rats at 94 mg/kg for 3 days decreased urine output and urinary Na+ excretion by 22 and 44%, respectively. This treatment increased whole kidney expression of several Na+ transporters including α1-subunit of Na+-K+-ATPase, NHE3, Na-Pi2, AQP1–3, and NKCC2 but not NCC, AQP4, α-, β-, or γ-ENaC. These findings suggest that increased Na+ and water reabsorption in multiple nephron segments may contribute to TZD-induced fluid retention. However, when TZDs were administered for longer than 5 days, renal expression of nonglycosylated form of AQP2 (26) and all three subunits of ENaC (5) was significantly downregulated, coinciding with normal urine volume. Therefore, the later reduction of AQP2 and ENaC is considered as adaptive response to reestablish Na+ and water balance. Unlike the wild-type animals in the previous study (26), db/m mice exhibited increased urine volume and urinary Na+ excretion after RGZ treatment. This may suggest that the heterozygous mutation of leptin receptor already accelerated TZD-induced fluid retention, leading to enhanced diuresis and natriuresis at later time points.
As discussed above the normal diuretic response seen in lean mice is necessary for reestablishment of Na+ and water balance. In contrast, this response was significantly blunted in db/db mice, which developed severe fluid retention in response to RGZ treatment. It seems reasonable to speculate that impairment of natriuretic and natriuresis may account for the accelerated fluid retention in db/db mice. We further found that db/db mice exhibited blunted downregulation of renal AQP2 expression and elevated AQP3 expression after RGZ treatment. The dysregulation of these water transporter proteins likely underlies the abnormal diuretic response in db/db mice.
In summary, the present study examined RGZ-induced fluid retention in db/db mice. These animals exhibited accelerated plasma volume expansion after 2-wk RGZ treatment compared with their lean controls. In response to plasma volume expansion, lean mice exhibited increased urine volume, accompanied with downregulation of AQP2. In contrast, these renal responses to RGZ treatment were blunted in db/db mice. These results suggest that impaired diuresis as a result of defective response of renal water transporters may in part account for the increased susceptibility of db/db mice to TZD-induced fluid retention.
GRANTS
This work was supported by National Basic Research Program of China 973 Program 2012CB517600 (No. 2012CB517602), National Institute of Diabetes and Digestive and Kidney Diseases Grant DK-079162, Merit Review from Department of Veterans Affairs, and Established Investigator Award from American Heart Association. T. Yang is an Established Investigator from American Heart Association and Research Career Scientist from Department of Veterans Affairs.
DISCLOSURES
No conflicts of interest, financial or otherwise, are declared by the author(s).
AUTHOR CONTRIBUTIONS
Author contributions: L.Z., G.L., Z.J., K.T.Y., and Y.K. performed experiments; L.Z., G.L., Z.J., Y.S., Y.K., B.Y., and T.Y. analyzed data; L.Z. and T.Y. prepared figures; L.Z. and T.Y. drafted manuscript; K.T.Y., Y.S., M.L., S.Z., R.C., B.Y., and T.Y. edited and revised manuscript; Y.S., S.Z., R.C., B.Y., and T.Y. interpreted results of experiments; B.Y. and T.Y. conception and design of research; B.Y. and T.Y. approved final version of manuscript.
REFERENCES
- 1.Anonymous. Pioglitazone PIA. Osaka, Japan: Takeda Pharmaceuticals [Google Scholar]
- 2.Anonymous. Rosiglitazone PIA. Mumbai, India: GlaxoSmithKline Pharmaceuticals [Google Scholar]
- 3.Arakawa K, Ishihara T, Aoto M, Inamasu M, Kitamura K, Saito A. An antidiabetic thiazolidinedione induces eccentric cardiac hypertrophy by cardiac volume overload in rats. Clin Exp Pharmacol Physiol 31: 8–13, 2004 [DOI] [PubMed] [Google Scholar]
- 4.Beltowski J, Rachanczyk J, Wlodarczyk M. Thiazolidinedione-induced fluid retention: recent insights into the molecular mechanisms. PPAR Res 2013: 628628, 2013 [DOI] [PMC free article] [PubMed] [Google Scholar]
- 5.Borsting E, Cheng VP, Glass CK, Vallon V, Cunard R. Peroxisome proliferator-activated receptor-γ agonists repress epithelial sodium channel expression in the kidney. Am J Physiol Renal Physiol 302: F540–F551, 2012 [DOI] [PMC free article] [PubMed] [Google Scholar]
- 6.Cariou B, Charbonnel B, Staels B. Thiazolidinediones and PPARgamma agonists: time for a reassessment. Trends Endocrinol Metab 23: 205–215, 2012 [DOI] [PubMed] [Google Scholar]
- 7.Eisner C, Espey M, Ow H, Wang K, Wesner U, Schnermann J. Measurement of plasma volume using nanoparticles in mice. FASEB J 23: 804–819., 2009 [Google Scholar]
- 8.GlaxoSmithKline Pharmaceuticals Advandia (Rosiglitazone Maleate). Research Triangle Park, NC: NGPPI [Google Scholar]
- 9.Guan Y, Hao C, Cha DR, Rao R, Lu W, Kohan DE, Magnuson MA, Redha R, Zhang Y, Breyer MD. Thiazolidinediones expand body fluid volume through PPARgamma stimulation of ENaC-mediated renal salt absorption. Nat Med 11: 861–866, 2005 [DOI] [PubMed] [Google Scholar]
- 10.Jain AK, Vaidya A, Ravichandran V, Kashaw SK, Agrawal RK. Recent developments and biological activities of thiazolidinone derivatives: a review. Bioorg Med Chem 20: 3378–3395, 2012 [DOI] [PubMed] [Google Scholar]
- 11.Jia Z, Aoyagi T, Kohan DE, Yang T. mPGES-1 deletion impairs aldosterone escape and enhances sodium appetite. Am J Physiol Renal Physiol 299: F155–F166, 2010 [DOI] [PMC free article] [PubMed] [Google Scholar]
- 12.Kermani A, Garg A. Thiazolidinedione-associated congestive heart failure and pulmonary edema. Mayo Clin Proc 78: 1088–1091, 2003 [DOI] [PubMed] [Google Scholar]
- 13.Kliewer SA, Lenhard JM, Willson TM, Patel I, Morris DC, Lehmann JM. A prostaglandin J2 metabolite binds peroxisome proliferator-activated receptor gamma and promotes adipocyte differentiation. Cell 83: 813–819, 1995 [DOI] [PubMed] [Google Scholar]
- 14.Kung J, Henry RR. Thiazolidinedione safety. Expert Opin Drug Saf 11: 565–579, 2012 [DOI] [PubMed] [Google Scholar]
- 15.Mudaliar S, Chang AR, Aroda VR, Chao E, Burke P, Baxi S, Griver KA, O'Connor DT, Henry RR. Effects of intensive insulin therapy alone and with added pioglitazone on renal salt/water balance and fluid compartment shifts in type 2 diabetes. Diabetes Obes Metab 12: 133–138, 2010 [DOI] [PubMed] [Google Scholar]
- 16.Nesto RW, Bell D, Bonow RO, Fonseca V, Grundy SM, Horton ES, Le Winter M, Porte D, Semenkovich CF, Smith S, Young LH, Kahn R. Thiazolidinedione use, fluid retention, and congestive heart failure: a consensus statement from the American Heart Association and American Diabetes Association. Circulation 108: 2941–2948, 2003 [DOI] [PubMed] [Google Scholar]
- 17.Niemeyer NV, Janney LM. Thiazolidinedione-induced edema. Pharmacotherapy 22: 924–929, 2002 [DOI] [PubMed] [Google Scholar]
- 18.Nissen SE, Wolski K. Effect of rosiglitazone on the risk of myocardial infarction and death from cardiovascular causes. N Engl J Med 356: 2457–2471, 2007 [DOI] [PubMed] [Google Scholar]
- 19.Parulkar AA, Pendergrass ML, Granda-Ayala R, Lee TR, Fonseca VA. Nonhypoglycemic effects of thiazolidinediones. Ann Intern Med 134: 61–71, 2001 [DOI] [PubMed] [Google Scholar]
- 20.Patel C, Wyne KL, McGuire DK. Thiazolidinediones, peripheral oedema and congestive heart failure: what is the evidence? Diab Vasc Dis Res 2: 61–66, 2005 [DOI] [PubMed] [Google Scholar]
- 21.Pickavance LC, Tadayyon M, Widdowson PS, Buckingham RE, Wilding JP. Therapeutic index for rosiglitazone in dietary obese rats: separation of efficacy and haemodilution. Br J Pharmacol 128: 1570–1576, 1999 [DOI] [PMC free article] [PubMed] [Google Scholar]
- 22.Riazi S, Khan O, Tiwari S, Hu X, Ecelbarger CA. Rosiglitazone regulates ENaC and Na-K-2Cl cotransporter (NKCC2) abundance in the obese Zucker rat. Am J Nephrol 26: 245–257, 2006 [DOI] [PubMed] [Google Scholar]
- 23.Son NH, Park TS, Yamashita H, Yokoyama M, Huggins LA, Okajima K, Homma S, Szabolcs MJ, Huang LS, Goldberg IJ. Cardiomyocyte expression of PPARgamma leads to cardiac dysfunction in mice. J Clin Invest 117: 2791–2801, 2007 [DOI] [PMC free article] [PubMed] [Google Scholar]
- 24.Song J, Knepper MA, Hu X, Verbalis JG, Ecelbarger CA. Rosiglitazone activates renal sodium- and water-reabsorptive pathways and lowers blood pressure in normal rats. J Pharmacol Exp Ther 308: 426–433, 2004 [DOI] [PubMed] [Google Scholar]
- 25.Takazawa T, Yamauchi T, Tsuchida A, Takata M, Hada Y, Iwabu M, Okada-Iwabu M, Ueki K, Kadowaki T. Peroxisome proliferator-activated receptor gamma agonist rosiglitazone increases expression of very low density lipoprotein receptor gene in adipocytes. J Biol Chem 284: 30049–30057, 2009 [DOI] [PMC free article] [PubMed] [Google Scholar]
- 26.Tiwari S, Blasi ER, Heyen JR, McHarg AD, Ecelbarger CM. Time course of AQP-2 and ENaC regulation in the kidney in response to PPAR agonists associated with marked edema in rats. Pharmacol Res 57: 383–392, 2008 [DOI] [PubMed] [Google Scholar]
- 27.Viswanathan V, Mohan V, Subramani P, Parthasarathy N, Subramaniyam G, Manoharan D, Sundaramoorthy C, Gnudi L, Karalliedde J, Viberti G. Effect of spironolactone and amiloride on thiazolidinedione-induced fluid retention in South Indian patients with type 2 diabetes. Clin J Am Soc Nephrol 8: 225–232, 2012 [DOI] [PMC free article] [PubMed] [Google Scholar]
- 28.Wang F, Aleksunes LM, Reagan LA, Vergara CM. Management of rosiglitazone-induced edema: two case reports and a review of the literature. Diabetes Tech Therap 4: 505–514, 2002 [DOI] [PubMed] [Google Scholar]
- 29.Yang T. Kidney-specific gene targeting: insight into thiazolidinedione-induced fluid retention. Nephrology (Carlton) 11: 201–206, 2006 [DOI] [PubMed] [Google Scholar]
- 30.Zhang H, Zhang A, Kohan DE, Nelson RD, Gonzalez FJ, Yang T. Collecting duct-specific deletion of peroxisome proliferator-activated receptor gamma blocks thiazolidinedione-induced fluid retention. Proc Natl Acad Sci USA 102: 9406–9411, 2005 [DOI] [PMC free article] [PubMed] [Google Scholar]


