Abstract
K+-Cl− cotransporter (KCC) isoforms 3 (KCC3) and 4 (KCC4) are expressed at the basolateral membrane of proximal convoluted tubule cells, and KCC4 is present in the basolateral membrane of the thick ascending loop of Henle's limb and α-intercalated cells of the collecting duct. Little is known, however, about the physiological roles of these transporters in the kidney. We evaluated KCC3 and KCC4 mRNA and protein expression levels and intrarenal distribution in male Wistar rats or C57 mice under five experimental conditions: hyperglycemia after a single dose of streptozotocin, a low-salt diet, metabolic acidosis induced by ammonium chloride in drinking water, and low- or high-K+ diets. Both KCC3 mRNA and protein expression were increased during hyperglycemia in the renal cortex and at the basolateral membrane of proximal tubule cells but not with a low-salt diet or acidosis. In contrast, KCC4 protein expression was increased by a low-sodium diet in the whole kidney and by metabolic acidosis in the renal outer medulla, specifically at the basolateral membrane of α-intercalated cells. The increased protein expression of KCC4 by a low-salt diet was also observed in WNK4 knockout mice, suggesting that upregulation of KCC4 in these circumstances is not WNK4 dependent. No change in KCC3 or KCC4 protein expression was observed under low- or high-K+ diets. Our data are consistent with a role for KCC3 in the proximal tubule glucose reabsorption mechanism and for KCC4 in salt reabsorption of the thick ascending loop of Henle's loop and acid secretion of the collecting duct.
Keywords: K+-Cl− cotransporter, acidosis, diabetes, low-salt diet
the electroneutral movement of K+ and Cl− across the plasma membrane is accomplished by a group of secondary active transport proteins known as K+-Cl− cotransporters (KCCs). This transport system was originally described in red blood cells as a swelling- and N-ethylmaleimide-activated, Cl−-dependent, K+ efflux mechanism (11, 16, 30, 31), with a particular role in the regulation of cell volume. When cells swell, the activation of KCCs help to eliminate ions and return the cell to its original volume, a process known as regulatory volume decrease (RVD). Later on, it was observed that KCCs are present in many tissues, in which they play important roles beyond cell volume regulation. One outstanding example is the critical role that KCC2 plays in modulating the intraneuronal Cl− concentration, which, in turn, is critical to define the response (hyperpolarizing or depolarizing) of ionotropic neurotransmitter receptor, ligand-gated Cl− channels in the postsynaptic membrane (5).
KCCs are members of the SLC12 family of solute transporters, in which four different genes, SLC12A4 to SLC12A7, encode for KCC1–KCC4 isoforms. Three of these transporters, KCC1, KCC3, and KCC4, are expressed in several tissues, including the kidney, whereas KCC2 is neuron specific (17). The presence of KCC1 in the kidney has been suggested only a demonstration of the presence of its mRNA transcripts (20), whereas the presence of KCC3 and KCC4 have been identified at both mRNA and protein levels (6, 38, 40). The expression of KCC3 protein is located in the basolateral membrane of proximal convoluted tubule (PCT) cells (38), whereas KCC4 protein is present in the basolateral membrane of the PCT as well as in the basolateral membrane of the thick ascending limb (TAL) of Henle's loop and α-intercalated cells of the collecting ducts (6, 49).
While much information regarding the role of KCCs in central nervous system physiology has been reported (5, 27, 36), little is known about their role in renal physiology. Avison et al. (4) presented evidence for a Ba2+-insensitive but furosemide-sensitive K+ transport mechanism compatible with a KCC system in the basolateral membrane of PCT cells that is stimulated by increased Na+-glucose transport in the apical membrane, suggesting that transcellular glucose transport requires high rates of K+ recycling in the basolateral membrane. Greger and Schlatter's (21) data supported the presence of an electroneutral K+-Cl− cotransport system in the basolateral membrane of TAL cells. Amorim et al. (2) observed the existence of an apical K+-Cl− cotransport system in distal convoluted tubule (DCT) cells that was particularly active in the presence of a low luminal Cl− concentration, suggesting that such a role could provide a K+ secretory pathway with a low-salt diet. Finally, the development of KCC4 knockout mice revealed that the absence of KCC4 is associated with renal tubular acidosis (6). However, until now, none of these potential roles have been explored in animal models using molecular tools. Thus, the goal of the present work was to determine the behavior of KCC3 and KCC4 mRNA and protein expression during hyperglycemia, salt restriction, metabolic acidosis, and K+ diet. Our data are consistent with an important role of KCCs as cotransporters in the renal handling of glucose, salt, and protons.
METHODS
Animal models.
Male Wistar rats weighing 250–300 g or male C57 mice weighing 20–25 g were provided by our animal facility. All animal procedures were performed in accordance with the Mexican Federal Regulation for Animal Experimentation and Care (NOM-062-ZOO-2001) and were approved by our Institutional Animal Care Committees. All rodents were housed in regular polypropylene cages with 3 animals/cage with 12:12-h light-dark cycles and at a constant temperature and humidity of 20°C and 65%, respectively. On the first and last days of the experiment, animals were placed in metabolic cages (Nalgene) to determine 24-h water intake and urinary electrolyte excretion and osmolarity. After animals were euthanasized, serum electrolytes, creatinine, and osmolarity were determined.
Experimental procedures.
We studied five experimental groups. Group 1 consisted of rats given a single intraperitoneal injection of streptozotocin (STZ; 60 mg/kg body wt, Sigma) (29, 42). Seventy-two hours after STZ administration, the blood glucose concentration was determined (Accu-Chek sensor comfort, Roche Diagnostics), and only rats with a postprandial blood glucose level of >20.0 mmol/l were considered diabetic and were followed for the next 4 wk. Animals were fed with regular NaCl rat chow (0.4% NaCl chow, no. 5001, Harlan) and tap water. As a control, we used rats treated with a single intraperitoneal injection of citrate buffer solution (0.1 M, pH 4.4) and were fed with regular chow and tap water. Group 2 was given a low NaCl intake for 8 days. This model was performed in wild-type mice and WNK4−/− knockout mice, which have been previously described (8). These animals were fed with low-NaCl chow (0.01–0.02% NaCl chow, TD.90228, Harlan) and tap water (8, 39). Group 3, which consisted of both rats and mice, was given free access to a drinking solution with 280 mM NH4Cl for 8 days (1, 41). Control animals for groups 2 and 3 consisted of rats or mice that were simultaneously carried through all procedures and fed similar amount of regular chow diet and tap water. Groups 4 and 5 consisted of mice given either a low- or high-K+ diet for 8 days, respectively. Control (1.2% K+), low-K+ (0% K+), and high-K+ (5% K+) diets were obtained from TestDiet (St. Louis, MO) and were prepared by modifying the AIN-93M semipurified diet. The low-K+ diet was used as a base, and tribasic potassium citrate was added to generate the control and high-K+ diets (8). After a 2-day period of adaption to the control powder diet, the diet was changed to a low- or high-K+ diet for some animals, whereas the control group continued to receive the control diet. At the end of day 4, mice were killed, and kidneys were removed.
After each experimental treatment period, animals were anesthetized with pentobarbital sodium (50 mg/kg), and kidneys were perfused with saline solution and rapidly removed. The cortex and medulla from one kidney were isolated and frozen in liquid nitrogen, whereas the other kidney was placed in 4% paraformaldehyde to carry on the immunohistochemical assays.
Preparation of renal tissue.
The cortex, medulla, or whole kidney was homogenized (0.1 g tissue/ml) in buffer solution containing 250 mM sucrose, 1 mM EDTA, 10 mM Tris·HCl buffer (pH 7.6), and a protease cocktail inhibitor complete 1 tablet per 10 ml (Roche Diagnostics). Homogenates were centrifuged at 10,000 g for 30 min at 4°C, and supernatants were used to measure the total protein expression. The protein concentration was measured with the Bradford method using BSA, as is standard with the Bio-Rad DC protein assay (Bio-Rad, Hercules, CA).
Immunoblot analysis.
Western blot analysis of KCC3 and KCC4 proteins was performed using previously characterized affinity-purified rabbit polyclonal antibodies specific for the 19-residue peptides KCC3-KKARNAYLNNSNYEEGDEY (38) and KCC4-AERTEEPESPESVDQTSPT (28) encoded within exon 3 of the SLC12A6 gene and exon 1 of the SLC12A7 gene, respectively.
Crude membrane protein was isolated from the renal cortex and medulla, and samples of 100 μg were separated by 7.5% SDS-PAGE and transferred onto polyvinylidene difluoride membranes (Amersham Pharmacia Biotech). Membranes were blocked for 2 h at room temperature with 10% nonfat dry milk (Bio-Rad) in 150 mM NaCl, 10 mM Tris·HCl, and 0.5% Tween 20 (pH 7.6) (TBST). Membranes were then incubated overnight with rabbit polyclonal antibodies against either KCC3 (1:1,000) or KCC4 antibodies (1:750) in TBST and 5% milk at 4°C. After being washed three times in TBST, membranes were incubated for 1 h at room temperature with horseradish peroxidase-conjugated secondary antibody in blocking solution (1:7,000, GE Healthcare Bioscience). Antigen-antibody complexes on the immunoblots were visualized after an extensive wash using enhanced chemiluminescence (Amersham ECL-Plus systems, GE Healthcare Bioscience).
Immunohistochemistry.
Tissues were retrograde perfused via the mesenteric vein with ice-cold PBS and then kept in a vial containing 4% paraformaldehyde until use. Kidneys were removed and embedded in paraffin, and sagittal sections were cut to 1.5 μm thickness. Antigen retrieval was performed by incubating the slides in 0.01 mM sodium citrate buffer (pH 6) for 15 min at 80°C. Samples were preincubated for 1 h at room temperature with 0.3% H2O2 in PBS and permeabilized with 0.05% Triton X-100 in PBS for 2 min. Blockade was performed with 1% BSA, 5% FBS, and 0.1% Triton X-100 in PBS for 5 min at room temperature. Samples were then incubated with rabbit anti-KCC4 antibodies (1:200) in the same solution for 45 min at room temperature. Incubation without anti-KCC antibodies served as a negative control. After being washed with 0.1% Triton X-100 in PBS, sections were incubated with the secondary antibody coupled to horseradish peroxidase (donkey anti-rabbit, 1:1,000, Amersham) for 40 min at room temperature. Samples were then washed with 0.1% Triton X-100 in PBS for 10 min and incubated with 0.03% diaminobenzidine tetrahydrochloride as chromogen (Sigma) for 10 min followed by a counterstain with Meyer hematoxylin. Samples were washed in PBS, dehydrated in an ethanol-xylol train, and mounted on coverslips with Permount mounting media (Electron Microscopy Sciences). Slides were observed under ×10 and ×40 objectives with a bright-light Nikon Eclipse 80i microscope, and images were captured with a Coolpix-4300 Nikon digital camera with four megapixels of resolution.
Immunofluorescence.
Rat or mice kidneys were processed for immunofluorescence as described above. Tissue sections (10 μm thickness) were incubated for 20 min in PBS with 1% BSA and 4% normal goat serum (NGS) and then incubated with primary antibodies diluted in PBS, BSA, and NGS. An antigen retrieval step was included that required 10 min of incubation in 0.1% SDS diluted in PBS, BSA, and NGS. Sections were rinsed with PBS and NaCl and then with standard PBS. They were then incubated with the KCC4 affinity-purified antibody and diluted in 1% BSA and PBS (1:200) overnight at 4°C. After incubation, sections were washed, incubated with secondary antibodies [FITC-conjugated goat anti-rabbit IgG (1:250, Zymed) or Cy5-labeled anti-rabbit antibody (1:1,000, Molecular Probes)] at room temperature for 1 h, then washed again. To identify acid-secreting α-intercalated cells, anti-B1 subunit of H+-ATPase was used as a marker [1:80, gift of Dr. Luna-Arias (34)]. Tissues were mounted on coverslips with Vectashield (Vector Labs). Slides were examined, and images were obtained with a ×40 oil-immersion objective mounted on a confocal inverted microscope (Olympus FluoView FV1000). Image analysis was performed using ImageJ software (version 1.36b, National Institutes of Health).
Real-time RT-PCR.
Total RNA was extracted from frozen renal cortex and medulla tissue using TRIzol reagent (Invitrogen). Reverse transcription was carried out with 1.0 μg of total RNA using 200 units of Moloney murine leukemia virus reverse transcriptase (Invitrogen) and random primers. RNA integrity was analyzed by electrophoresis. KCC3 and KCC4 mRNA were quantified by real-time RT-PCR with the ABI Prism 7300 Sequence Detection System (TaqMan, ABI, Foster City, CA). The ABI TaqMan probes used were KCC3R-XR (5′-GCCTCTCTATCTCGTTCTGTTTTGG-3′) and Rn01537520_m1 (5′-CCATGTGCTGCACCTGTACAATGCT-3′) for KCC3 and KCC4, respectively. As an endogenous control, eukaryotic 18S rRNA was used. Relative quantification of KCC3 and KCC4 gene expression was performed with the comparative threshold cycle (CT) method (32).
Functional expression of KCC4 in Xenopus laevis oocytes.
We assessed the activity of KCC4 under different extracellular pH conditions using the heterologous expression system of Xenopus laevis oocytes following our previously detailed procedures (9, 35, 37, 38). In brief, stage V–VI oocytes extracted from anesthetized female frogs were injected with KCC cRNA at 10 ng/oocyte, and, 2 days later, the activity of the cotransporter was determined by assessing Cl−-dependent 86Rb+ uptake under hypotonic conditions using similar preuptake and uptake solutions that were pH titrated from 6.0 to 8.0. cRNA for injection was transcribed in vitro from KCC4 cDNA linearized at the 3′-end using the T7 RNA polymerase mMESSAGE kit (Ambion).
Statistical analysis.
Statistical significance was defined as two-tailed P values of <0.05, and results are presented as means ± SE. The significance of differences between two groups was tested using the Student t-test's; the significance of differences among three or more groups was tested using one-way ANOVA with multiple comparisons using the Bonferroni correction.
RESULTS
Group 1: animals with STZ-induced diabetes mellitus developed hyperglycemia.
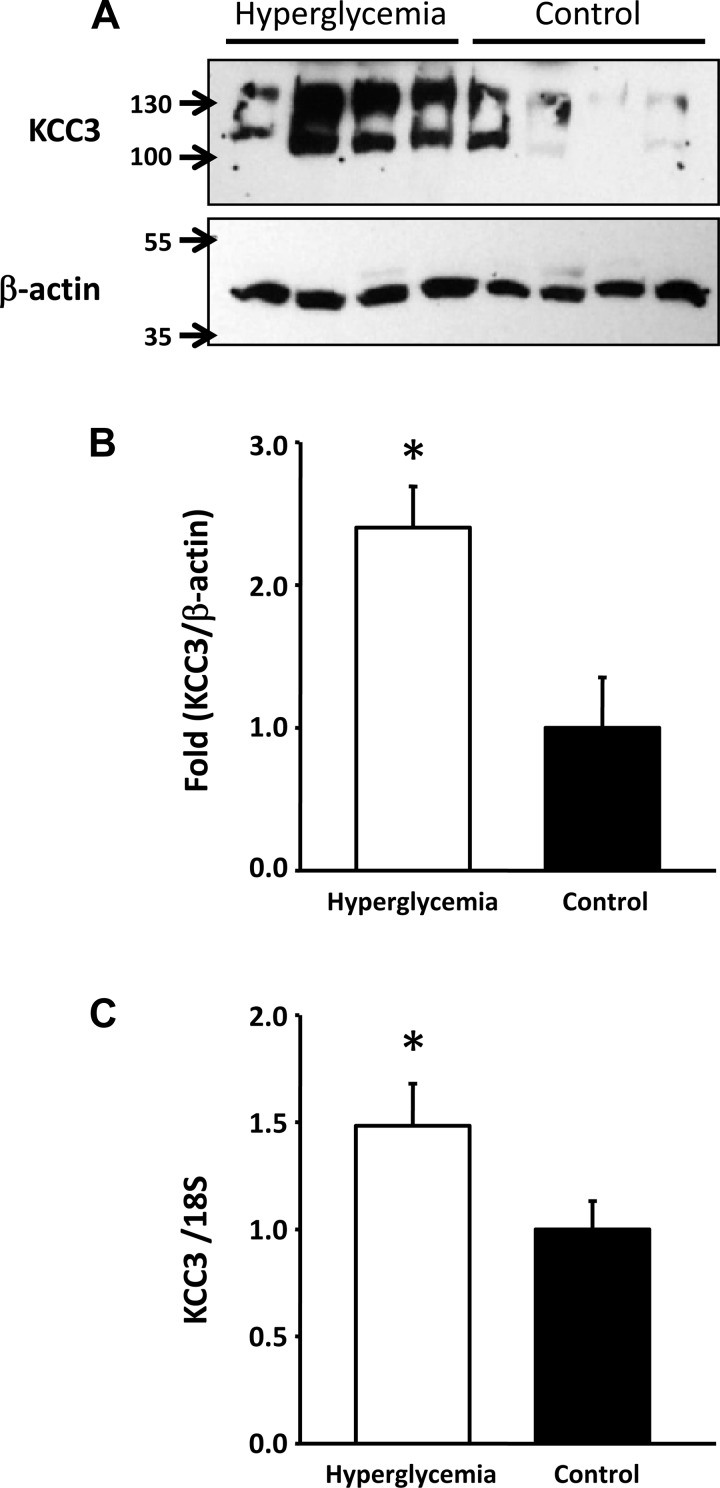
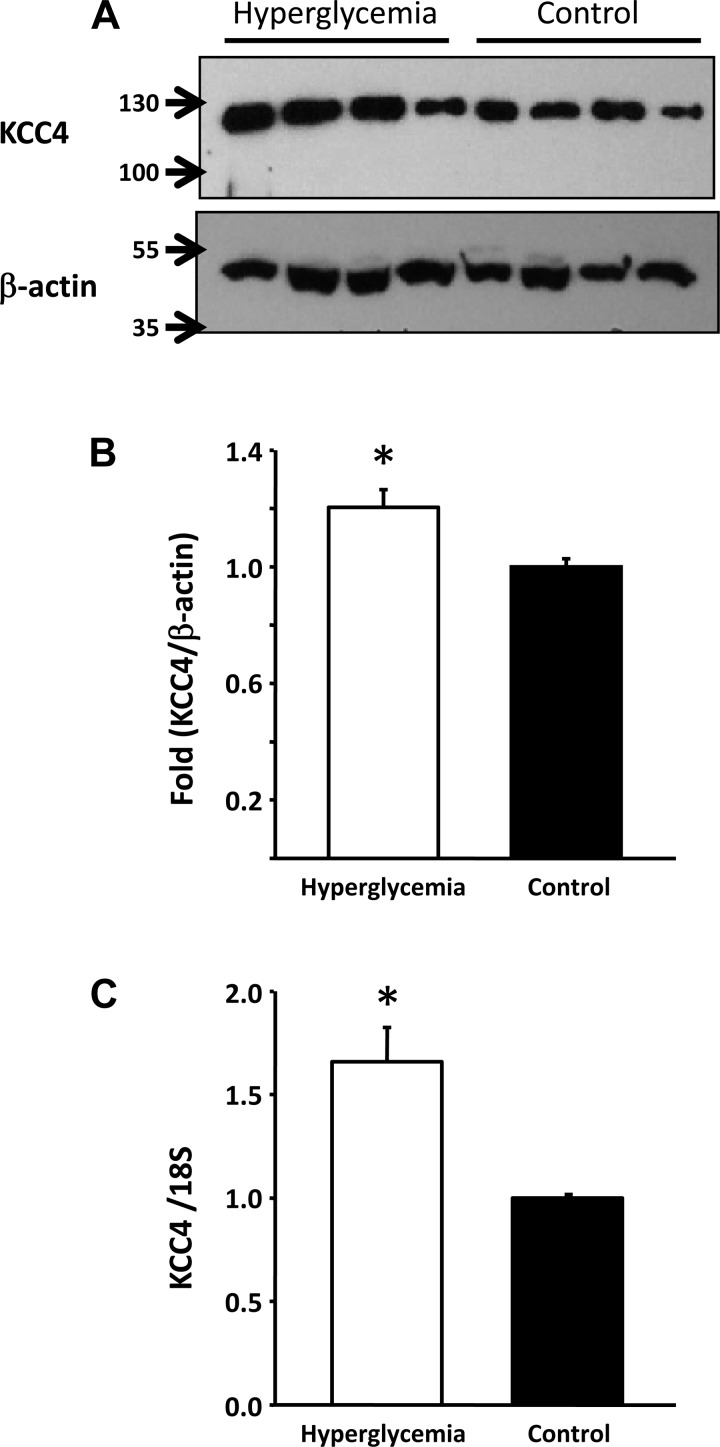
As shown in Table 1, on the day of euthanization, serum glucose levels were 304 ± 72 mg/dl in the STZ-treated group and 48 ± 9 mg/dl in the control group (P < 0.001). This was reflected by an increased level of glucose in the urine. Although no differences were observed in serum creatinine or urinary salt excretion between diabetic and control groups, a significant increase in acid and K+ secretion was observed in the diabetic group. Hyperglycemic rats exhibited a significant increase in KCC3 expression in the renal cortex at both mRNA and protein levels. As shown in Fig. 1, expression of KCC3 in the renal cortex was ∼2.4 ± 0.28-fold higher in hyperglycemic rats than in control rats. This was accompanied by increased expression at the mRNA level. RT-PCR analysis revealed a 1.5 ± 0.19-fold higher level of KCC3 transcripts in the hyperglycemic group than in the control group (P < 0.05). In contrast, no significant differences in KCC4 protein and mRNA expression were detected in the renal cortex between control and hyperglycemic animals (data not shown). In the renal medulla, however, hyperglycemic animals exhibited a small but nevertheless significant increase in KCC4 protein of 1.2 ± 0.06-fold (P < 0.05), which was associated with increased expression at the mRNA level of 1.7 ± 0.16-fold (P < 0.05; Fig. 2).
Table 1.
Body weight and plasma and urine values of hyperglycemic rats followed for 30 days after streptozotocin injection
| Control Rats | Hyperglycemic Rats | P Value | |
|---|---|---|---|
| Final body weight, g | 373.4 ± 19.5 | 232.8 ± 14.46 | <0.05* |
| Plasma | |||
| Na+, meq/l | 146.32 ± 0.53 | 142.42 ± 1.41 | <0.05* |
| K+, meq/l | 4.26 ± 0.15 | 4.81 ± 0.17 | <0.05* |
| Cl−, meq/l | 111.18 ± 2.45 | 108.58 ± 1.27 | NS |
| Glucose, mg/dl | 48.2 ± 8.98 | 304.4 ± 72.18 | <0.05* |
| CO2, mmol/l | 17.34 ± 1.85 | 21.20 ± 0.39 | NS |
| Creatinine, mg/dl | 0.48 ± 0.03 | 0.45 ± 0.02 | <0.05* |
| Urine | |||
| Glucose, mg/dl | 12.8 ± 3.12 | 3242 ± 523.46 | <0.05* |
| Creatinine, mg/dl | 41.82 ± 10.54 | 33.51 ± 5.08 | NS |
| Na+/UCr, meq/mg | 0.55 ± 0.04 | 0.68 ± 0.19 | NS |
| K+/UCr, meq/mg | 1.41 ± 0.04 | 2.18 ± 0.21 | <0.05* |
| Cl−/UCr, meq/mg | 0.72 ± 0.08 | 0.91 ± 0.24 | NS |
| pH | 6.54 ± 0.10 | 5.66 ± 0.19 | <0.05* |
Values are means ± SE; n = 6 rats/group. UCr, Urinary creatinine; NS, not significant.
Significant difference.
Fig. 1.
K+-Cl− cotransporter (KCC)3 expression is increased in the renal cortex of hyperglycemic rats. A: Western blot analysis of renal cortex protein lysates from streptozotocin (STZ)-treated (n = 4) or vehicle-treated (n = 4) rats. Blots were exposed to anti-KCC3 affinity-purified antibody, as previously described (38), or commercially available anti-β-actin (Santa Cruz Biotechnology). B: densitometric analysis of the blot shown in A. C: mRNA level expression measured through real-time PCR with specific primers for KCC3 (KCC3R-XR: 5′-GCCTCTCTATCTCGTTCTGTTTTGG-3′). *P < 0.05 vs. control rats.
Fig. 2.
Effect of hyperglycemia on KCC4 expression in the renal medulla. A: Western blot analysis of renal medulla protein lysates from STZ-treated (n = 4) or vehicle-treated (n = 4) rats. Blots were exposed to anti-KCC4 affinity-purified antibodies, as previously described (28), or anti-β-actin (Santa Cruz Biotechnology). B: densitometric analysis of the blot shown in A. C: mRNA level expression measured through real-time PCR with specific primers for KCC4 (Rn01537520_m1: 5′-CCATGTGCTGCACCTGTACAATGCT-3′). *P < 0.05 vs. control rats.
Group 2: effect of a low-salt diet in mice.
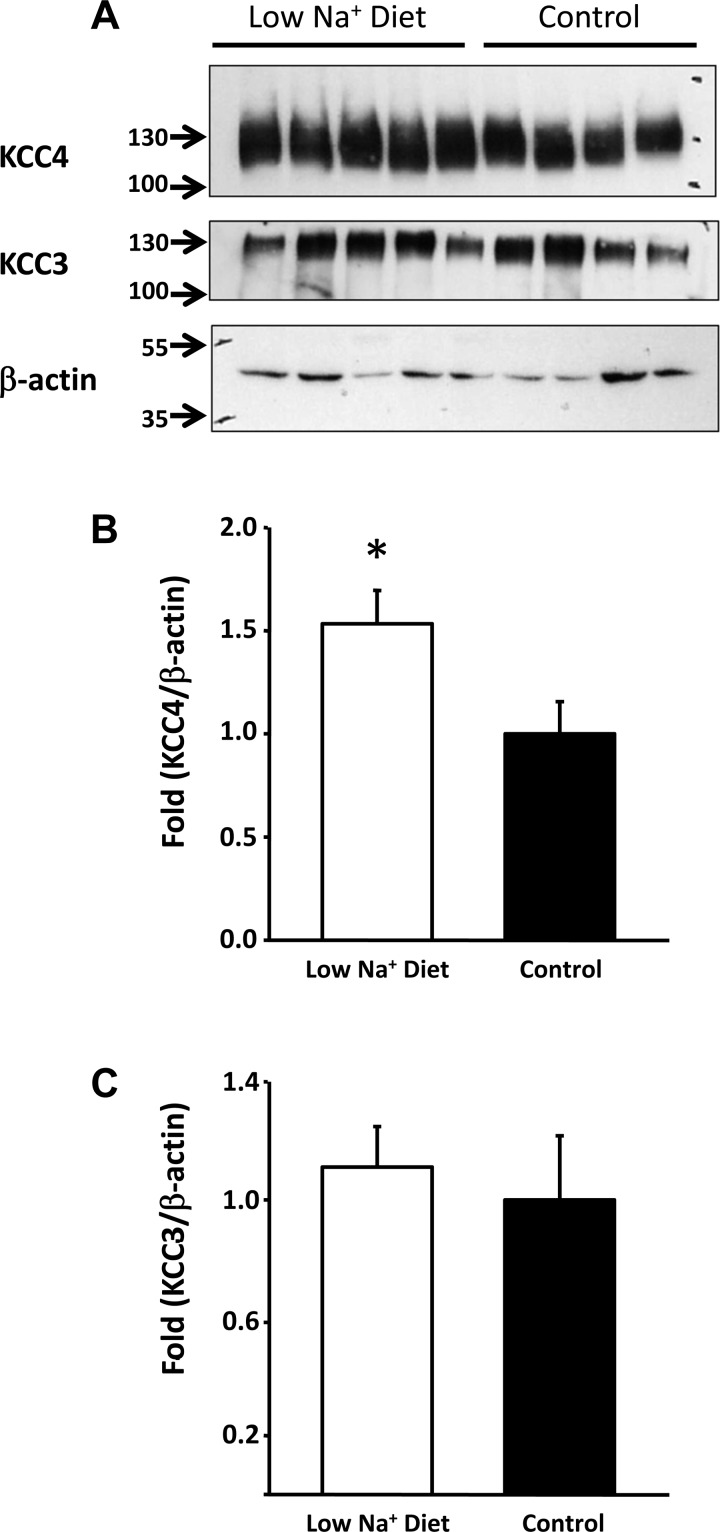
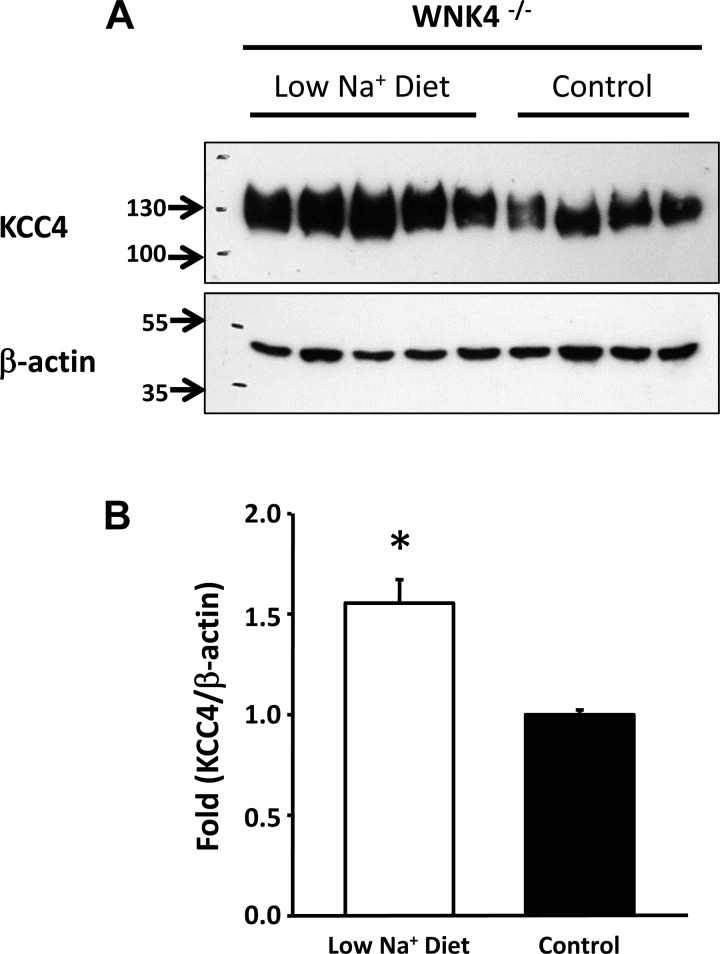
As shown in Fig. 3, Western blot analysis revealed that in whole kidneys from control mice, KCC3 and KCC4 protein expression were very robust. KCC4 was increased by 1.53 ± 0.16-fold (P < 0.05) in the kidneys of mice fed a low-salt diet, whereas KCC3 expression was not affected. We also assessed the effect of a low-salt diet on KCC3 and KCC4 expression from total kidney proteins in WNK4−/− mice. This enabled us to take advantage of tissue from animals that were already studied under these experimental conditions in our laboratory and for which the physiological data for exposure to a low-salt diet have already been gathered (8). Because WNK4 is required for the modulation of renal Na+-Cl− cotransporter expression by a low-salt diet (8), we analyzed the effect of this experimental maneuver on KCC4 expression in WNK4−/− mice. As shown in Fig. 4, however, increased expression of KCC4 during salt restriction remained evident in WNK4−/− mice at 1.55 ± 0.11-fold over the control group, suggesting that upregulation of this cotransporter is not dependent on WNK4 activity.
Fig. 3.
Effect of a low-salt diet in mice. A: Western blot analysis of KCC4 and KCC3 in kidneys from mice exposed to a low-salt (n = 5) or normal salt (control; n = 4) diet. Blots were exposed to anti-KCC4, anti-KCC3, or anti-β-actin antibodies. B: densitometric analysis of the KCC4 blot shown in A. *P < 0.05 vs. control mice. C: densitometric analysis of the KCC3 blot shown in A.
Fig. 4.
Upregulation of KCC4 by a low-salt diet does not require WNK4 expression. A and B: Western blot analysis (A) and densitometric analysis (B) of KCC4 from kidney proteins of WNK4−/− mice exposed to a low-salt (n = 5) or normal salt (control; n = 4) diet. Blots were exposed to anti-KCC4 or anti-β-actin antibodies. *P < 0.05 vs. control mice.
Group 3: metabolic acidosis.
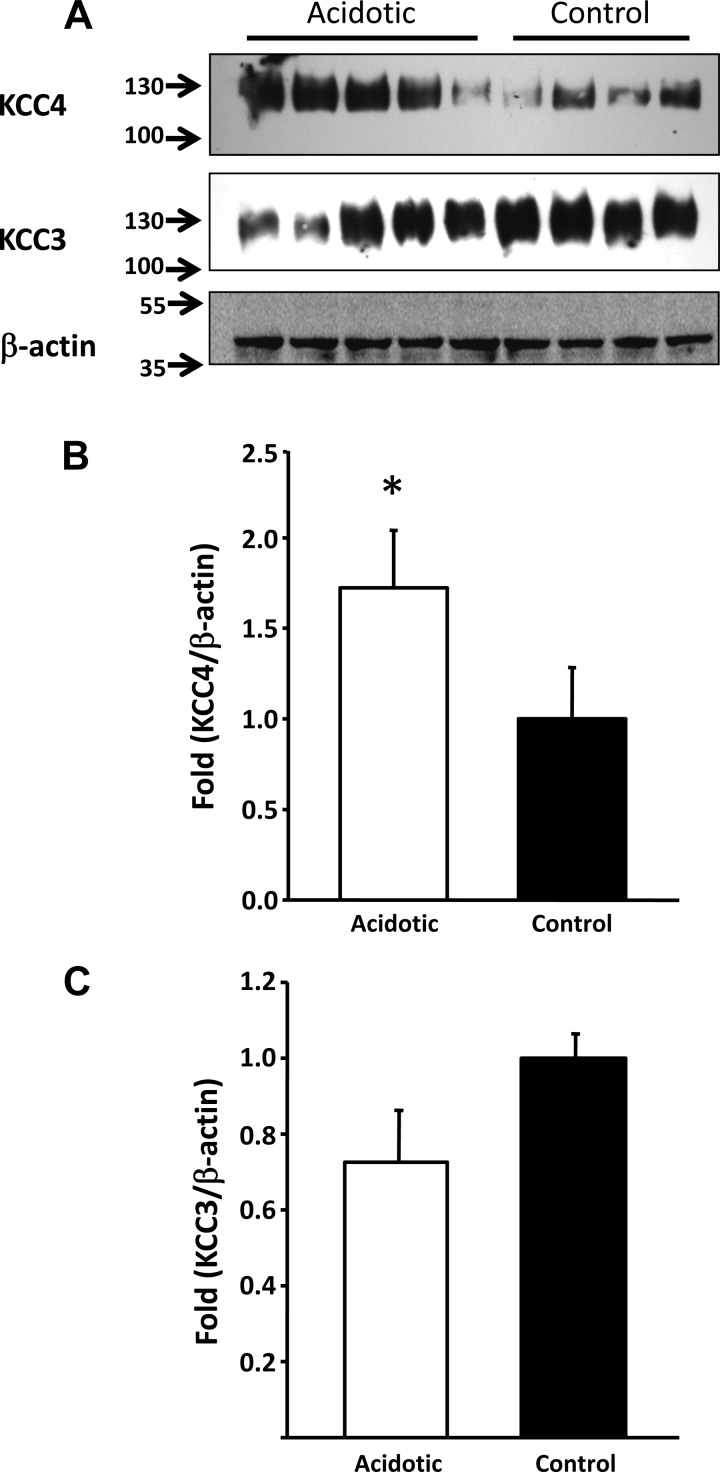
To induce metabolic acidosis, male Wistar rats or C57 mice were exposed to NH4Cl at a concentration of 280 mM in drinking water for 8 days, which is a known method for inducing this metabolic disturbance (1, 41). As consistent with previous reports for this model, after 8 days, blood pH, Pco2, and HCO3− concentration remained similar between acidotic and control rats (Table 2). However, animals exposed to NH4Cl revealed significantly higher urinary Cl− excretion and lower urinary pH, indicating the active secretion of protons in the kidney. Mice showed similar differences between control and acidotic animals in urinary pH (acidotic animals: 5.25 ± 0.17 vs. control animals: 6.44 ± 0.36, P < 0.01). Because our KCC3 and KCC4 antibodies were raised against mouse sequences, cleaner Western blots from total kidney proteins were observed using mouse rather than rat proteins. Thus, Western blot analyses from acidotic mice and their respective control mice are shown in Fig. 5. The expression of KCC4 was significantly higher in acidotic mice versus their respective control mice. In contrast, no significant changes were observed for KCC3 expression.
Table 2.
Blood gasometry and plasma and urine values of rats exposed to 280 mM NH4Cl solution for 8 days
| Control Rats | Acidotic Rats | P Value | |
|---|---|---|---|
| Blood | |||
| pH | 7.29 ± 0.02 | 7.27 ± 0.03 | NS |
| Po2, mmHg | 40.52 ± 1.93 | 43.01 ± 1.80 | NS |
| HCO3−, mmol/l | 18.85 ± 0.17 | 19.75 ± 0.98 | NS |
| Hematocrit, % | 48.6 ± 1.0 | 53.56 ± 1.21 | <0.05* |
| Plasma | |||
| Na+, meq/l | 149.24 ± 1.33 | 149.30 ± 2.12 | NS |
| K+, meq/l | 3.47 ± 0.20 | 3.23 ± 0.18 | NS |
| Cl−, meq/l | 113.54 ± 1.16 | 126.25 ± 5.69 | <0.05* |
| CO2, mmol/l | 21.22 ± 0.60 | 14.33 ± 3.86 | NS |
| Creatinine, mg/dl | 0.31 ± 0.02 | 0.30 ± 0.02 | NS |
| Urine | |||
| Creatinine, mg/dl | 69.52 ± 5.27 | 55.33 ± 6.54 | NS |
| pH (8 days) | 6.624 ± 0.12 | 5.38 ± 0.03 | <0.05* |
Values are means ± SE; n = 5 rats/group.
Significant difference.
Fig. 5.
Metabolic acidosis induced upregulation of KCC4 in the mouse kidney. A: Western blot analysis of whole kidney protein lysates of mice treated with NH4Cl (n = 5) or vehicle (n = 4) for 8 days. Blots were exposed to anti-KCC4, anti-KCC3, or anti-β-actin antibodies. B: densitometric analysis of the KCC4 blot shown in A. *P < 0.05 vs. control mice. C: densitometric analysis of the KCC3 blot shown in A.
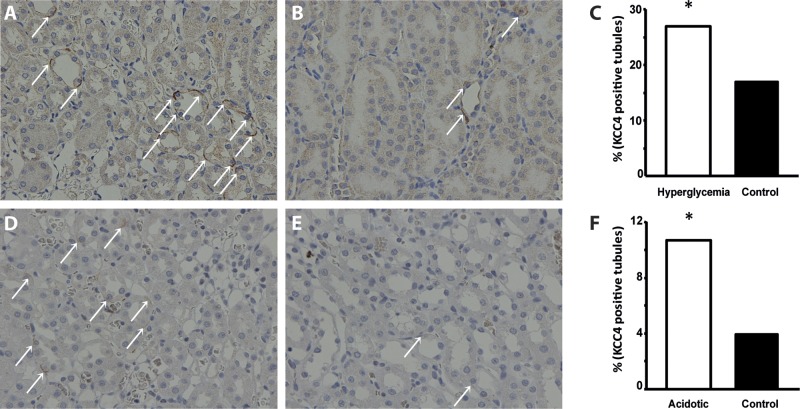
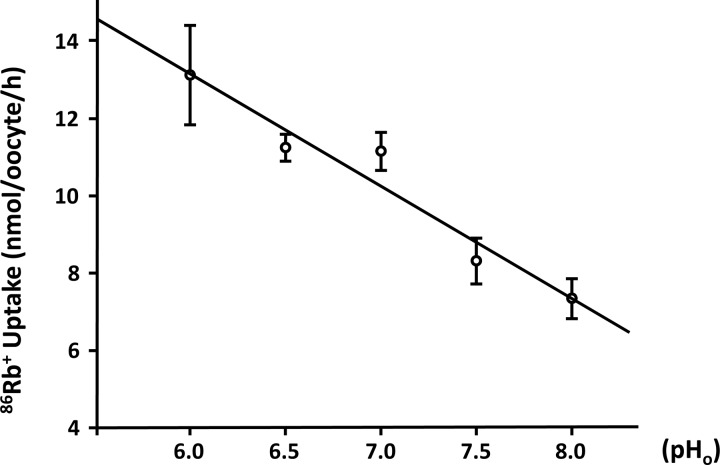
Because it has been previously shown that α-intercalated cells express KCC4 in the basolateral membrane and that the elimination of this cotransporter in KCC4 knockout mice results in renal tubular acidosis (6, 49), we reasoned that the increased expression of KCC4 in both acidotic and hyperglycemic rats must be in intercalated cells of the collecting duct. To assess this possibility, we first needed to demonstrate that our antibody indeed localized KCC4 in these cells in the rat kidney. Figure 6A shows a collecting duct. Some cells in this duct were positive at the basolateral membrane using the anti-KCC4 antibody and are shown in green. Figure 6B shows that the same cells were positive in the apical membrane (shown in red) using antibodies against the proton pump (34). For KCC4, there was basolateral staining with some intracellular staining. Merge analysis clearly showed that both signals overlapped in the same cell but not in the same membrane, indicating that indeed KCC4 antibodies recognized KCC4 expression in the basolateral membrane of α-intercalated cells (Fig. 6C). As shown in Fig. 7, immunohistochemical analysis of sections from the renal outer medulla from animals with hyperglycemia or exposed to NH4Cl revealed a similar pattern of increased expression of KCC4 in the basolateral membranes of α-intercalated cells compared with control animals. Thus, metabolic acidosis is associated with increased expression of KCC4. Hyperglycemia also resulted in a similar observation. However, this result was unlikely to be due to increased glucose transport because no apical glucose transport occurs in this nephron region. Because hyperglycemia is often associated with metabolic acidosis, we believe that this could be secondary to acidosis, as observed in rats exposed to NH4Cl. Finally, the role of KCC4 in the acid secretion capacity of the collecting duct is also supported by the modulation of KCC4 activity by external pH. As shown in Fig. 8, oocytes injected with KCC4 cRNA, in which 2 days later we assessed Cl−-dependent 86Rb+ uptake during cell swelling, revealed that the higher the external pH, the lower the KCC4 activity.
Fig. 6.

Immunolocalization of KCC4 protein expression in rat kidneys. A: KCC4 antibody detected KCC4 protein (green) at the basolateral membrane of collecting duct cells. B: proton pump antibody labeled (red) the apical membrane of α-intercalated cells from the collecting duct. C: dual labeling with KCC4 (FITC secondary) and VATPase-β antibody (Cy5 secondary) indicated that KCC4 is expressed in rat α-intercalated cells from the collecting duct at the basolateral membrane, whereas the proton pump has an apical localization. Scale bars = 5 μm.
Fig. 7.
Immunohistochemical analysis of renal outer medulla sections from hyperglycemic and acidotic rats. A and B: kidney slices from STZ-treated (A) and vehicle-treated (B) rats exposed to anti-KCC4 antibody and detection solutions. Magnification: ×40. C: semiquantification of KCC4-positive tubules between KCC4 in hyperglycemic compared with control rats. *P < 0.001 vs. control rats. D and E: kidney slices from acidotic (D) and control (E) rats exposed to anti-KCC4 antibody and detection solutions. Magnification: ×40. F: semiquantification of KCC4-positive tubules between KCC4 in NH4Cl-treated compared with control rats. *P < 0.001 vs. control rats. KCC4 positive tubules are shown by the white arrows.
Fig. 8.
KCC4 activity is modulated by external pH (pH0). Xenopus laevis oocytes were injected with 10 ng KCC4 cRNA to assess the effect of pH0 on Cl−-dependent 86Rb+ uptake during hypotonic conditions. Preuptake and uptake solutions were pH titrated from 6.0 to 8.0. A negative correlation between KCC4-mediated 86Rb+ uptake and pH0 was found (R2 = 0.94, P < 0.05).
Groups 4 and 5: low- and high-K+ diets.
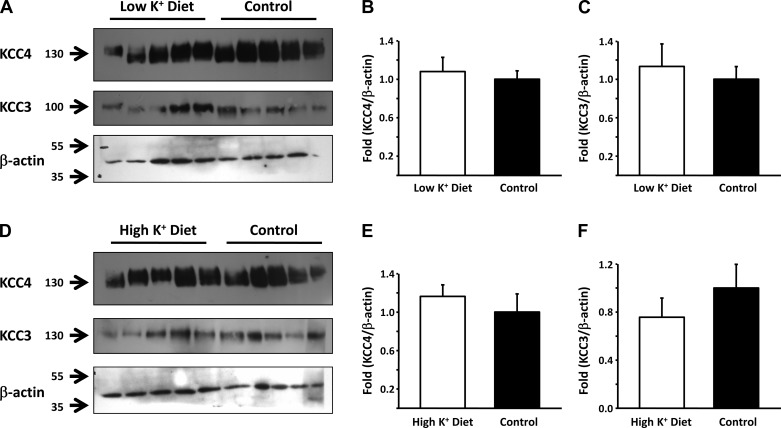
Figure 9 shows representative Western blots and the corresponding densitometric analysis of total renal proteins from mice fed with either low- or high K+-diets for 4 days. Proteins were blotted with anti-KCC4 or anti-KCC3 antibodies, with β-actin as a loading and transfer control. No effect of changes in K+ diet was observed for either KCC4 or KCC3 expression.
Fig. 9.
Effect of low- and high-K+ diets in KCC3 and KCC4 expression in the mouse kidney. A: Western blot analysis of KCC3 and KCC4 in whole kidneys of mice fed a control (n = 5) or low-K+ (n = 5) diet. Blots were exposed to anti-KCC3 or anti-KCC4 antibodies, and anti-β-actin used as a loading control. B and C: densitometric analyses of the KCC4 (B) and KCC3 (C) blots shown in A. D: Western blot analysis of KCC3 and KCC4 in whole kidneys of mice fed a control (n = 5) or high-K+ (n = 5) diet. Blots were exposed to anti-KCC3 or anti-KCC4 antibodies, and anti-β-actin used as a loading control. E and F: densitometric analysis of the KCC4 (E) and KCC3 (F) blots shown in D.
DISCUSSION
KCCs play important roles in cell volume regulation because they provide a pathway for ion efflux during RVDs in swollen cells (24). They are also critical for the modulation of the intracellular Cl− concentration, which is particularly important in neurons because the response to neurotransmitters acting on the postsynaptic ligand-gated Cl− channel depends on the potential equilibrium of this anion. Additionally, inactivation mutations of KCC3 result in Anderman's syndrome, a severe inherited neurological disease with peripheral neuropathy associated with agenesis of the corpus callosum (12, 25, 45). Because of this, a tremendous amount of information (10, 14, 22, 36, 45) has been produced in this area since the molecular identification of KCCs (5, 27). A third fundamental role for KCCs is transepithelial K+ and Cl− transport. The expression of these transporters has been documented in several epithelial cells either at the apical or basolateral membranes (17). Recent work has suggested an important role for KCC3 and KCC4 in acid secretion in the stomach (13–15). KCC3 knockout mice develop arterial hypertension (44), and KCC4 knockout mice exhibit renal tubular acidosis (6). Despite these and the known expression of these transporters along the nephron, little is known about their physiological role in the kidney.
In the present study, we analyzed the effect of five different experimental models on the expression of KCC3 and KCC4 because the localization of these transporters along the nephron has already been described (6, 38, 49) and physiological studies (4, 21, 26, 48) have suggested the presence of KCCs in nephron regions and proposed potential roles for these membrane proteins.
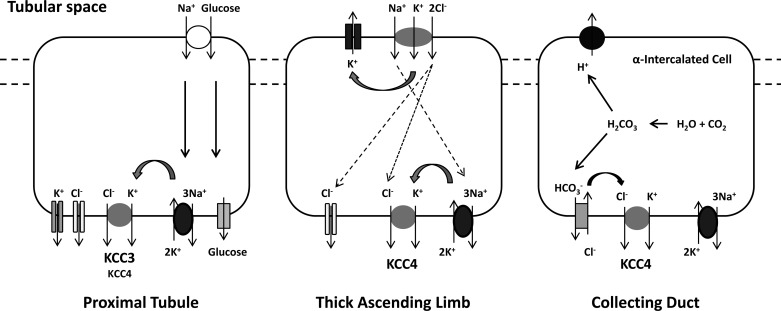
We (38) have previously shown that KCC3 is heavily expressed along the basolateral membrane of the PCT and no other region of the nephron exhibits expression of this transporter. In contrast, KCC4, in addition to being expressed in PCT cells, is also present in the basolateral membrane of the TAL and α-intercalated cells of the collecting duct (6, 49). Avison et al. (4) observed that in rabbit proximal tubule cells, the addition of glucose to the tubule suspension resulted in a significant increase of intracellular Na+ by 30% and a decrease of intracellular K+ by a similar percentage. They defined the basolateral K+ efflux pathways that could explain this decrease and showed that at least part of the K+ efflux was Ba2+ insensitive and significantly reduced by furosemide or bumetanide at 1 mM concentration but not at 10 μM. By that time, Sasaki et al. (48) demonstrated the presence of a K+-Cl− cotransport system in the basolateral membrane of the proximal tubules. In addition, from our characterization of KCCs, we know that K+ transport by KCC3 (38) and KCC4 (37) is Ba2+ insensitive and is inhibited by loop diuretics at 1 mM but not at 10 μM. We thus reasoned that KCC3 and/or KCC4 could serve as the basolateral KCC system, as both are known to be activated by cell swelling. This provides a pathway to increase the rate of glucose transport, as proposed by the diagrams shown in Fig. 10. In this scenario, the active entrance of Na+ and glucose through the apical membrane, which occurs together with water (33), would be expected to increase the cell volume. This, in turn, activates, probably among others, the basolateral K+-Cl− pathway that extrudes K+, which help to decrease the intracellular K+ concentration. This is done to keep Na+-K+-ATPase activity at maximum because the pump activity is highly sensitive to intracellular K+ (3). In a more chronic scenario, it could be possible that in the steady state of chronic hyperglycemia, the swelling effect of apical Na+-glucose cotransport is offset by a loss of water basolaterally due to the 3 Na+ out/2 K+ in stoichiometry of the pump (the so-called “dehydrating effect of the pump”), an equimolar efflux of glucose, and K+-Cl− loss via KCC3/KCC4. In this regard, we observed a significant increase in KCC3 but not KCC4 expression at both the mRNA and protein levels in hyperglycemic rats. Thus, our data suggest that it is predominantly KCC3, rather than KCC4, that is the cotransporter providing this regulatory effect in this portion of the kidney nephron. This is supported by the observations of Boettger et al. (7) in a study in which the RVD in isolated perfused proximal straight tubules from wild-type, KCC3−/−, and KCC4−/− mice was compared. After exposure to hypotonicity, wild-type mice increased their cell volume by ∼10%. RVD was significantly impaired in KCC3−/− mice, whereas it was only marginally affected in KCC4−/− mice. The antibody used in this study recognized both KCC3a and KCC3b variants of KCC3. Therefore, it is not known which one is increased. However, we (38) have previously observed that KCC3b is the predominantly expressed isoform in the kidney. We also showed in that study that there were basically no differences in the functional properties of these isoforms.
Fig. 10.
Proposed roles for KCC3 and/or KCC4 in the kidney. See text for an explanation.
Data from in vitro perfused cortical TALs from rabbits allowed Greger and Schlatter (21) to propose the presence of a K+-Cl− cotransport mechanism in the basolateral membrane. According to the results of immunofluorescence in the kidney, this seems to be KCC4 (6, 49). In the TAL, virtually all K+ enters the cell through the apical Na+-K+-2Cl− cotransporter (NKCC2) and is recycled to the luminal fluid by apical K+ channels, such as the renal outer medullary K+ channel (ROMK) (18). Thus, KCC4 in the basolateral membrane is unlikely to be there for the purpose of transepithelial K+ transport. Reasonable possibilities for this are that KCC4 constitutes another pathway for Cl− extrusion of the cell or that it provides a mechanism for the basolateral extrusion of K+ that enters the cell through Na+-K+-ATPase. This would prevent an increase in the intracellular K+ concentration that inhibits the activity of the pump. In any case, KCC4 activity would be particularly required when salt reabsorption of the TAL is increased, as during a low-salt diet. Our data revealed a significant upregulation of KCC4 expression in total protein lysates of mice exposed to a low-salt diet. This observation suggests that KCC4 could be the cotransporter responsible for the previous proposal (21), that under activation of TAL salt transport capacity, a KCC plays a role in the cell's K+ and Cl− extrusion (Fig. 10).
Based on our data suggesting that KCC4 plays a role in salt reabsorption of the TAL, KCC4 could be a potential explanation for the difference in the age of onset of Bartter's syndrome type I or II, which begins at birth or before as polyhydramnios. This is in contrast to type III, which usually becomes apparent in the first year of life or later (22). Types I and II are due to inactivating mutations of NKCC2 and ROMK, respectively, which completely prevent salt reabsorption in the TAL. Type III is due to mutations in the basolateral Cl− channel CLC-KB, which prevents Cl− extrusion from the cell and eventually reduces the activity of NKCC2 because this transporter is highly sensitive to the intracellular Cl− concentration (43). Hence, it is possible that KCC4 activity is able to maintain the intracellular Cl− concentration at a level that allows some activity of NKCC2 for some time after birth in children with Barrett's syndrome type III.
Regulation of the thiazide-sensitive Na+-Cl− cotransporter during a low-salt diet and/or angiotensin II infusion is dependent on the presence of WNK4 kinase (8). The WNK4-induced inhibitory effect on the Na+-Cl− cotransporter is switched to stimulatory in the presence of angiotensin II (46). Because KCC4 activity is also inhibited by WNK4 (19), we took advantage of our WNK4 total knockout mouse model to explore whether the observed upregulation in a low-salt diet could also be dependent on WNK4. However, we observed that upregulation of KCC4 expression occurred in WNK4−/− mice similar to that in wild-type mice, indicating that this kinase is not required.
Our data support the proposal that KCC4 plays an important role in acid-base metabolism in the kidney. This was originally suggested by the fact that KCC4 knockout mice develop renal tubular acidosis (6). The expression of KCC4 at the basolateral membrane of α-intercalated cells was increased in rats exposed to NH4Cl in drinking water and in hyperglycemic rats, which are known to be associated with a certain degree of metabolic acidosis. Additionally, the activity of KCC4 strongly negatively correlates with higher extracellular pH. Lower pH correlates with higher KCC activity (Fig. 8). Thus, our data are consistent with the model proposed by Boettger et al. (6): that KCC4 in the basolateral membrane of α-intercalated cells of the collecting duct could be critical for keeping the intracellular concentration of Cl− low so that basolateral Cl−/HCO3− exchanger remains active. This serves to extrude HCO3− from the cell, allowing the continuous production of H+ to be secreted in the apical membrane (Fig. 10).
A previous study (47) has shown that KCC1 expression at the basolateral membrane of the colonic epithelium is increased during a low-K+ diet, suggesting that KCC1 might play a role in K+ absorption in this circumstance. We found, however, no change in KCC3 or KCC4 expression in the kidney after exposing mice to both low- and high-K+ diets, suggesting that these cotransporters probably are not involved in the renal response to changes in dietary K+, in which the roles of K+ channels have been extensively demonstrated (23). Finally, a potential role for a KCC transporter in the DCT remains to be elucidated. Amorim et al. (2) obtained evidence for a K+-Cl− cotransport mechanism in the apical membrane of the DCT that could be of particular importance to K+ secretion during low Cl− concentration states. However, expression of neither KCC3 nor KCC4 was observed in the apical membrane of the DCT. One possibility is that KCC1 could be the transporter responsible for this observation, but no detailed analysis using an anti-KCC1 antibody has been performed in renal tissue.
In summary, our data are consistent with proposals stating that specific KCCs play a role in glucose, salt, and acid-base metabolism in the kidney.
GRANTS
This work was supported by Mexican Council of Science and Technology (CONACYT) Grants 132503 (to A. Mercado) and 165815 (to G. Gamba) and by National Institute of Diabetes and Digestive and Kidney Diseases Grant P01-DK-070756 (to D. B. Mount). Z. Melo was supported by a scholarship from CONACYT-Mexico and is a graduate student in the Biochemical Science PhD program of the Universidad Nacional Autónoma de México.
DISCLOSURES
No conflicts of interest, financial or otherwise, are declared by the author(s).
AUTHOR CONTRIBUTIONS
Author contributions: Z.M., R.B., D.B.M., H.P.-M., A.M., and G.G. conception and design of research; Z.M., S.C.-R., R.B., N.V., M.C.-B., A.M., and G.G. performed experiments; Z.M., S.C.-R., R.B., N.V., M.C.-B., D.B.M., A.M., and G.G. analyzed data; Z.M., S.C.-R., R.B., N.V., M.C.-B., D.B.M., H.P.-M., A.M., and G.G. interpreted results of experiments; Z.M., S.C.-R., M.C.-B., A.M., and G.G. prepared figures; Z.M., A.M., and G.G. drafted manuscript; Z.M., S.C.-R., A.M., and G.G. edited and revised manuscript; Z.M., S.C.-R., R.B., N.V., M.C.-B., D.B.M., H.P.-M., A.M., and G.G. approved final version of manuscript.
ACKNOWLEDGMENTS
The authors thank Dr. Norma Uribe, Ricardo Aguilar, and Sandra Rodriguez for the technical help with the histopathological preparations, Gabriel Orozco-Hoyuela for confocal microscopy, and Jonathan Barrera-Chimal for real-time PCR. The anti-VATPase-B and acid-secreting α-intercalated cell antibodies were gifts from Mayra Melendez.
This work was presented in part at Experimental Biology Meetings in San Diego, CA, in 2012 and in Boston, MA in 2013.
REFERENCES
- 1.Ambuhl PM, Amemiya M, Danczkay M, Lotscher M, Kaissling B, Moe OW, Preisig PA, Alpern RJ. Chronic metabolic acidosis increases NHE3 protein abundance in rat kidney. Am J Physiol Renal Fluid Electrolyte Physiol 271: F917–F925, 1996 [DOI] [PubMed] [Google Scholar]
- 2.Amorim JB, Bailey MA, Musa-Aziz R, Giebisch G, Malnic G. Role of luminal anion and pH in distal tubule potassium secretion. Am J Physiol Renal Physiol 284: F381–F388, 2003 [DOI] [PubMed] [Google Scholar]
- 3.Aperia A. 2011 Homer Smith Award: to serve and protect: classic and novel roles for Na+, K+–adenosine triphosphatase. J Am Soc Nephrol 23: 1283–1290, 2012 [DOI] [PubMed] [Google Scholar]
- 4.Avison MJ, Gullans SR, Ogino T, Giebisch G. Na+ and K+ fluxes stimulated by Na+-coupled glucose transport: evidence for a Ba2+-insensitive K+ efflux pathway in rabbit proximal tubules. J Membr Biol 105: 197–205, 1988 [DOI] [PubMed] [Google Scholar]
- 5.Blaesse P, Airaksinen MS, Rivera C, Kaila K. Cation-chloride cotransporters and neuronal function. Neuron 61: 820–838, 2009 [DOI] [PubMed] [Google Scholar]
- 6.Boettger T, Hubner CA, Maier H, Rust MB, Beck FX, Jentsch TJ. Deafness and renal tubular acidosis in mice lacking the K-Cl co-transporter Kcc4. Nature 416: 874–878, 2002 [DOI] [PubMed] [Google Scholar]
- 7.Boettger T, Rust MB, Maier H, Seidenbecher T, Schweizer M, Keating DJ, Faulhaber J, Ehmke H, Pfeffer C, Scheel O, Lemcke B, Horst J, Leuwer R, Pape HC, Volkl H, Hubner CA, Jentsch TJ. Loss of K-Cl co-transporter KCC3 causes deafness, neurodegeneration and reduced seizure threshold. EMBO J 22: 5422–5434, 2003 [DOI] [PMC free article] [PubMed] [Google Scholar]
- 8.Castañeda-Bueno M, Cervantes-Perez LG, Vazquez N, Uribe N, Kantesaria S, Morla L, Bobadilla NA, Doucet A, Alessi DR, Gamba G. Activation of the renal Na+:Cl- cotransporter by angiotensin II is a WNK4-dependent process. Proc Nat Acad Sci USA 109: 7929–7934, 2012 [DOI] [PMC free article] [PubMed] [Google Scholar]
- 9.De Los Heros P, Kahle KT, Rinehart J, Bobadilla NA, Vazquez N, San Cristobal P, Mount DB, Lifton RP, Hebert SC, Gamba G. WNK3 bypasses the tonicity requirement for K-Cl cotransporter activation via a phosphatase-dependent pathway. Proc Natl Acad Sci USA 103: 1976–1981, 2006 [DOI] [PMC free article] [PubMed] [Google Scholar]
- 10.Delpire E, Mount DB. Human and murine phenotypes associated with defects in cation-chloride cotransport. Annu Rev Physiol 64: 803–843, 2002 [DOI] [PubMed] [Google Scholar]
- 11.Dunham PB, Ellory JC. Passive potassium transport in low potassium sheep red cells: dependence upon cell volume and chloride. J Physiol 318: 511–530, 1981 [DOI] [PMC free article] [PubMed] [Google Scholar]
- 12.Dupre N, Howard HC, Mathieu J, Karpati G, Vanasse M, Bouchard JP, Carpenter S, Rouleau GA. Hereditary motor and sensory neuropathy with agenesis of the corpus callosum. Ann Neurol 54: 9–18, 2003 [DOI] [PubMed] [Google Scholar]
- 13.Fujii T, Fujita K, Takeguchi N, Sakai H. Function of K-Cl cotransporters in the acid secretory mechanism of gastric parietal cells. Biol Pharm Bull 34: 810–812, 2011 [DOI] [PubMed] [Google Scholar]
- 14.Fujii T, Takahashi Y, Ikari A, Morii M, Tabuchi Y, Tsukada K, Takeguchi N, Sakai H. Functional association between K+:Cl− cotransporter-4 and H+,K+-ATPase in the apical canalicular membrane of gastric parietal cells. J Biol Chem 284: 619–629, 2009 [DOI] [PubMed] [Google Scholar]
- 15.Fujii T, Takahashi Y, Itomi Y, Fujita K, Morii M, Tabuchi Y, Asano S, Tsukada K, Takeguchi N, Sakai H. K+:Cl− cotransporter-3a up-regulates Na+,K+-ATPase in lipid rafts of gastric luminal parietal cells. J Biol Chem 283: 6869–6877, 2008 [DOI] [PubMed] [Google Scholar]
- 16.Gagnon KB, Delpire E. Physiology of SLC12 transporters: lessons from inherited human genetic mutations and genetically engineered mouse knockouts. Am J Physiol Cell Physiol 304: C693–C714, 2013 [DOI] [PMC free article] [PubMed] [Google Scholar]
- 17.Gamba G. Molecular physiology and pathophysiology of the electroneutral cation-chloride cotransporters. Physiol Rev 85: 423–493, 2005 [DOI] [PubMed] [Google Scholar]
- 18.Gamba G, Friedman PA. Thick ascending limb: the Na+:K+:2Cl− co-transporter, NKCC2, and the calcium-sensing receptor, CaSR. Pflugers Arch 458: 61–76, 2009 [DOI] [PMC free article] [PubMed] [Google Scholar]
- 19.Garzon-Muvdi T, Pacheco-Alvarez D, Gagnon KB, Vazquez N, Ponce-Coria J, Moreno E, Delpire E, Gamba G. WNK4 kinase is a negative regulator of K+:Cl− cotransporters. Am J Physiol Renal Physiol 292: F1197–F1207, 2007 [DOI] [PubMed] [Google Scholar]
- 20.Gillen CM, Brill S, Payne JA, Forbush IB. Molecular cloning and functional expression of the K-Cl cotransporter from rabbit, rat and human. A new member of the cation-chloride cotransporter family. J Biol Chem 271: 16237–16244, 1996 [DOI] [PubMed] [Google Scholar]
- 21.Greger R, Schlatter E. Porpierties of the basolateral membrane on the cortical thick ascending limb of Henle's loop of rabbit kidney. A model for secondary active chloride transport. Pflugers Arch 396: 325–334, 1983 [DOI] [PubMed] [Google Scholar]
- 22.Hebert SC. Bartter syndrome. Curr Opin Nephrol Hypertens 12: 527–532, 2003 [DOI] [PubMed] [Google Scholar]
- 23.Hebert SC, Desir G, Giebisch G, Wang W. Molecular diversity and regulation of renal potassium channels. Physiol Rev 85: 319–371, 2005 [DOI] [PMC free article] [PubMed] [Google Scholar]
- 24.Hoffmann EK, Lambert IH, Pedersen SF. Physiology of cell volume regulation in vertebrates. Physiol Rev 89: 193–277, 2009 [DOI] [PubMed] [Google Scholar]
- 25.Howard HC, Mount DB, Rochefort D, Byun N, Dupre N, Lu J, Fan X, Song L, Riviere JB, Prevost C, Horst J, Simonati A, Lemcke B, Welch R, England R, Zhan FQ, Mercado A, Siesser WB, George AL, Jr, McDonald MP, Bouchard JP, Mathieu J, Delpire E, Rouleau GA. The K-Cl cotransporter KCC3 is mutant in a severe peripheral neuropathy associated with agenesis of the corpus callosum. Nat Genet 32: 384–392, 2002 [DOI] [PubMed] [Google Scholar]
- 26.Ishibashi K, Rector FC, Jr, Berry CA. Chloride transport across the basolateral membrane of rabbit proximal convoluted tubules. Am J Physiol Renal Fluid Electrolyte Physiol 258: F1569–F1578, 1990 [DOI] [PubMed] [Google Scholar]
- 27.Kahle KT, Staley KJ, Nahed BV, Gamba G, Hebert SC, Lifton RP, Mount DB. Roles of the cation-chloride cotransporters in neurological disease. Nat Clin Pract Neurol 4: 490–503, 2008 [DOI] [PubMed] [Google Scholar]
- 28.Karadsheh MF, Byun N, Mount DB, Delpire E. Localization of the KCC4 potassium-chloride cotransporter in the nervous system. Neuroscience 123: 381–391, 2004 [DOI] [PubMed] [Google Scholar]
- 29.Karunanayake EH, Hearse DJ, Mellows G. The synthesis of [14C]streptozotocin and its distribution and excretion in the rat. Biochem J 142: 673–683, 1974 [DOI] [PMC free article] [PubMed] [Google Scholar]
- 30.Kregenow FM. The response of duck erythrocytes to hypertonic media. Further evidence for a volume-controlling mechanism. J Gen Physiol 58: 396–412, 1971 [DOI] [PMC free article] [PubMed] [Google Scholar]
- 31.Lauf PK, Theg BE. A chloride dependent K+ flux induced by N-ethylmaleimide in genetically low K+ sheep and goat erythrocytes. Biochem Biophy Res Commu 92: 1422–1428, 1980 [DOI] [PubMed] [Google Scholar]
- 32.Livak KJ, Schmittgen TD. Analysis of relative gene expression data using real-time quantitative PCR and the 2−ΔΔCT method. Methods 25: 402–408, 2001 [DOI] [PubMed] [Google Scholar]
- 33.Loike JD, Hickman S, Kuang K, Xu M, Cao L, Vera JC, Silverstein SC, Fischbarg J. Sodium-glucose cotransporters display sodium- and phlorizin-dependent water permeability. Am J Physiol Cell Physiol 271: C1774–C1779, 1996 [DOI] [PubMed] [Google Scholar]
- 34.Melendez-Hernandez MG, Barrios ML, Orozco E, Luna-Arias JP. The vacuolar ATPase from Entamoeba histolytica: molecular cloning of the gene encoding for the B subunit and subcellular localization of the protein. BMC Microbiol 8: 235, 2008 [DOI] [PMC free article] [PubMed] [Google Scholar]
- 35.Mercado A, de Los Heros P, Vazquez N, Meade P, Mount DB, Gamba G. Functional and molecular characterization of the K-Cl cotransporter of Xenopus laevis oocytes. Am J Physiol Cell Physiol 281: C670–C680, 2001 [DOI] [PubMed] [Google Scholar]
- 36.Mercado A, Mount DB, Gamba G. Electroneutral cation-chloride cotransporters in the central nervous system. Neurochem Res 29: 17–25, 2004 [DOI] [PubMed] [Google Scholar]
- 37.Mercado A, Song L, Vazquez N, Mount DB, Gamba G. Functional comparison of the K+:Cl− cotransporters KCC1 and KCC4. J Biol Chem 275: 30326–30334, 2000 [DOI] [PubMed] [Google Scholar]
- 38.Mercado A, Vazquez N, Song L, Cortes R, Enck AH, Welch R, Delpire E, Gamba G, Mount DB. Amino-terminal heterogeneity in the KCC3 K+:Cl− cotransporter. Am J Physiol Renal Physiol 289: F1246–F1261, 2005 [DOI] [PubMed] [Google Scholar]
- 39.Moreno G, Merino A, Mercado A, Herrera JP, Gonz lez-Salazar J, Correa-Rotter R, Hebert SC, Gamba G. Electronuetral Na-coupled cotransporter expression in the kidney during variations of NaCl and water metabolism. Hypertension 31: 1002–1006, 1998 [DOI] [PubMed] [Google Scholar]
- 40.Mount DB, Mercado A, Song L, Xu J, George Delpire E, Jr, Gamba G. Cloning and characterization of KCC3 and KCC4, new members of the cation-chloride cotransporter gene family. J Biol Chem 274: 16355–16362, 1999 [DOI] [PubMed] [Google Scholar]
- 41.Nowik M, Kampik NB, Mihailova M, Eladari D, Wagner CA. Induction of metabolic acidosis with ammonium chloride (NH4Cl) in mice and rats–species differences and technical considerations. Cel Physiol Biochem 26: 1059–1072, 2010 [DOI] [PubMed] [Google Scholar]
- 42.Osorio H, Coronel I, Arellano A, Franco M, Escalante B, Bautista R. Ursodeoxycholic acid decreases sodium-glucose cotransporter (SGLT2) expression and oxidative stress in the kidney of diabetic rats. Diab Res Clin Prac 97: 276–282, 2012 [DOI] [PubMed] [Google Scholar]
- 43.Ponce-Coria J, San Cristobal P, Kahle KT, Vazquez N, Pacheco-Alvarez D, De Los Heros P, Juarez P, Munoz E, Michel G, Bobadilla NA, Gimenez I, Lifton RP, Hebert SC, Gamba G. Regulation of NKCC2 by a chloride-sensing mechanism involving the WNK3 and SPAK kinases. Proc Natl Acad Sci USA 105: 8458–8463, 2008 [DOI] [PMC free article] [PubMed] [Google Scholar]
- 44.Rust MB, Faulhaber J, Budack MK, Pfeffer C, Maritzen T, Didie M, Beck FX, Boettger T, Schubert R, Ehmke H, Jentsch TJ, Hubner CA. Neurogenic mechanisms contribute to hypertension in mice with disruption of the K-Cl cotransporter KCC3. Circ Res 98: 549–556, 2006 [DOI] [PubMed] [Google Scholar]
- 45.Salin-Cantegrel A, Riviere JB, Shekarabi M, Rasheed S, Dacal S, Laganiere J, Gaudet R, Rochefort D, Lesca G, Gaspar C, Dion PA, Lapointe JY, Rouleau GA. Transit defect of potassium-chloride co-transporter 3 is a major pathogenic mechanism in hereditary motor and sensory neuropathy with agenesis of the corpus callosum. J Biol Chem 286: 28456–28465, 2011 [DOI] [PMC free article] [PubMed] [Google Scholar]
- 46.San Cristobal P, Pacheco-Alvarez D, Richardson C, Ring AM, Vazquez N, Rafiqi FH, Chari D, Kahle KT, Leng Q, Bobadilla NA, Hebert SC, Alessi DR, Lifton RP, Gamba G. Angiotensin II signaling increases activity of the renal Na-Cl cotransporter through a WNK4-SPAK-dependent pathway. Proc Natl Acad Sci USA 106: 4384–4389, 2009 [DOI] [PMC free article] [PubMed] [Google Scholar]
- 47.Sangan P, Brill SR, Sangan S, Forbush B, III, Binder HJ. Basolateral K-Cl cotransporter regulates colonic potassium absorption in potassium depletion. J Biol Chem 275: 30813–30816, 2000 [DOI] [PubMed] [Google Scholar]
- 48.Sasaki S, Ishibashi K, Yoshiyama N, Shiigai T. KCl co-transport across the basolateral membrane of rabbit renal proximal straight tubules. J Clin Invest 81: 194–199, 1988 [DOI] [PMC free article] [PubMed] [Google Scholar]
- 49.Velazquez H, Silva T. Cloning and localization of KCC4 in rabbit kidney: expression in distal convoluted tubule. Am J Physiol Renal Physiol 285: F49–F58, 2003 [DOI] [PubMed] [Google Scholar]


