

Abstract
In microbial populations, growth initiation and proliferation rates are major components of fitness and therefore likely targets of selection. We used a high-throughput microscopy assay, which enables simultaneous analysis of tens of thousands of microcolonies, to determine the sources and extent of growth rate variation in the budding yeast (Saccharomyces cerevisiae) in different glucose environments. We find that cell growth rates are regulated by the extracellular concentration of glucose as proposed by Monod (1949), but that significant heterogeneity in growth rates is observed among genetically identical individuals within an environment. Yeast strains isolated from different geographic locations and habitats differ in their growth rate responses to different glucose concentrations. Inheritance patterns suggest that the genetic determinants of growth rates in different glucose concentrations are distinct. In addition, we identified genotypes that differ in the extent of variation in growth rate within an environment despite nearly identical mean growth rates, providing evidence that alleles controlling phenotypic variability segregate in yeast populations. We find that the time to reinitiation of growth (lag) is negatively correlated with growth rate, yet this relationship is strain-dependent. Between environments, the respirative activity of individual cells negatively correlates with glucose abundance and growth rate, but within an environment respirative activity and growth rate show a positive correlation, which we propose reflects differences in protein expression capacity. Our study quantifies the sources of genetic and nongenetic variation in cell growth rates in different glucose environments with unprecedented precision, facilitating their molecular genetic dissection.
Keywords: growth rate, lag duration, single cell, glucose deprivation, natural variation, Saccharomyces cerevisiae, clonal heterogeneity, respiro-fermentative growth
Introduction
The rate at which a population of cells proliferates (i.e., the population growth rate) depends on both the rate of cell growth (increase in mass and volume) and the rate of cell division (increase in number). Understanding the physiological principles and molecular determinants governing cell proliferation rates is of broad importance in biology. Despite many decades of research, major questions remain regarding how cells regulate their rate of growth and how cell division, cell growth, and diverse cellular processes including metabolism and macromolecular synthesis are coordinated. At the same time, new questions are emerging, including the identities of naturally occurring genetic variants that underlie heritable variation in proliferation rates (Cubillos et al. 2011), the extent to which environmental conditions impact this variation (Liti and Louis 2012), and the molecular basis of heterogeneous growth strategies among genetically identical cells in the same environment (Levy et al. 2012).
In all organisms, the rate of cell proliferation is sensitive to the status of environmental nutrients required for biomass accumulation and energy metabolism. In the single-celled microbe Saccharomyces cerevisiae (budding yeast), the molecular form and abundance of environmental carbon is a major determinant of proliferation rates. The addition of glucose to glucose-deprived cultures of S. cerevisiae results in dramatic changes in cell physiology and metabolism, as well as alterations in the expression of more than 40% of genes (Zaman et al. 2008). The major transcriptional changes include increased expression of genes involved in ribosome biogenesis and repression of genes required for respiration, and the metabolism of alternative carbon sources (Zaman et al. 2008), consistent with glucose lying upstream of a regulatory network that coordinates cell growth with metabolism. Although the study of glucose regulation has typically entailed comparison of cells deprived of glucose with those provided with an abundance of glucose (2% w/v or 111 mM glucose in standard formulations), evidence suggests that cells modulate their responses to environmental glucose across a wide range of concentrations (Reifenberger et al. 1997; Yin et al. 2003; Kaniak et al. 2004).
In single-celled microbes, variation in cell growth rates has important implications for evolution (Blomberg 2011). A fast-growing lineage will rapidly outcompete even slightly slower growing lineages when nutritional resources are abundant. However, microorganisms often face nutritionally poor environments (Smets et al. 2010). How they respond to suboptimal nutrient availability and starvation and, conversely, the kinetics with which they respond to nutrient replenishment are also major components of fitness. Moreover, it is not just the average response that matters, but the variance matters as well. If two lineages have identical arithmetic mean growth rates, the lineage with the least individual-to-individual variation around that mean will outcompete the other during growth (Frank 2011). However, population heterogeneity might provide an advantage in fluctuating environments (Kussell and Leibler 2005; Frank 2011; Levy et al. 2012). To date, most studies of microbial fitness have focused on the population growth rate in nutrient-rich conditions (Giaever et al. 2002; Hillenmeyer et al. 2008). However, this laboratory condition is of unknown relationship to environments encountered by natural isolates of yeast and analyses restricted to nutrient-rich conditions are likely to miss important, and potentially adaptive, variation. At the same time, variation in proliferation rates among diverse natural isolates of yeast in suboptimal conditions may provide unique insight into the regulation of cell growth and how this variation has been shaped by ecological and geographic histories.
A more complete understanding of environmental and genetic determinants of cell proliferation rates requires surmounting two technical challenges: 1) accurate measurement of proliferation rates across a wide range of conditions including near-starvation conditions and 2) quantification of variation among genetically identical individuals. We recently developed a growth assay that measures individual cells growing into microcolonies comprising up to ∼100 cells that solves both of these problems (Levy et al. 2012). An important advantage of this approach over other high-throughput methods of growth rate analysis is the capability of determining distributions of growth rates derived from thousands of individual microcolony growth rate measurements.
In this study, we have used this approach to investigate cell growth, in a range of glucose concentrations, of natural isolates of S. cerevisiae with different ecological histories. We extended our high-throughput microcolony assay to enable measurement of both growth rate and lag time in single cells. We find that cell growth rates vary with glucose concentrations in accordance with a deterministic model of substrate-limited growth (Monod 1949). We surveyed a panel of wild yeast isolates across these conditions and find prevalent genotype-by-environment interactions, suggesting that different genetic factors underlie growth rate variation at different glucose concentrations. Isolates also differ in growth rate variance independently of differences in mean growth rate. Using a fluorescent reporter of respirative metabolism, we find that although increased respiration is anti-correlated with growth rate between environments, within an environment increased respirative enzyme expression is correlated with increased proliferation rates, perhaps reflecting nongenetic variation in protein production capacity. By quantitatively analyzing variation in growth reinitiation, proliferation, and metabolism in a spectrum of glucose-containing environments, we reveal a continuum of growth strategies among yeast populations that is amenable to genetic dissection.
Results
High-Throughput Analysis of Environmental Determinants of Cell Growth Variation
The rate of proliferation of yeast cells is regulated in response to both the form and abundance of environmental nutrients. Using chemostat cultures it has been shown that populations of yeast cells can modulate their rates of growth across at least a 10-fold range (Brauer et al. 2007). In batch cultures, growth in environments containing low nutrient concentrations that are equivalent to the steady-state concentrations in chemostats cannot be easily measured using conventional methods (i.e., optical density or particle counting).
We hypothesized that our recently developed high-throughput microcolony growth rate assay would provide sufficient resolution to measure cell proliferation rates in low-nutrient environments. Our assay uses time-lapse microscopy to monitor individual cells undergoing a small number of divisions to form microcolonies in 96-well glass bottom plates (Levy et al. 2012) (fig. 1A). Previously, we showed that the rate of change in microcolony area is highly correlated with the rate of change in cell number and thus provides an accurate estimate of microcolony growth rate (Levy et al. 2012). To study the effect of environmental glucose concentration on cell growth rates, we used minimal, chemically defined media (Saldanha et al. 2004). Prior to each experiment, cultures were grown to stationary phase in carbon-limiting media to ensure cell cycle arrest due to carbon starvation. Starting from growth-arrested cells, rather than exponentially growing cells, allowed us to observe the time to reinitiation of growth (i.e., lag) in each environment. Each microcolony growth profile is defined by two phases, a lag phase and a growth phase (fig. 1B). We used a sliding window regression method to locate the maximal rate of proliferation (increase in log area) for each microcolony (see Materials and Methods). Lag duration was defined by the intersection of this maximal proliferation line with a horizontal line defined by the initial cell size (see Materials and Methods). Using 96-well plates our assay enables us to measure the lag times and growth rates of as many as 80,000 individual microcolonies in a single 24-h experiment.
Fig. 1.
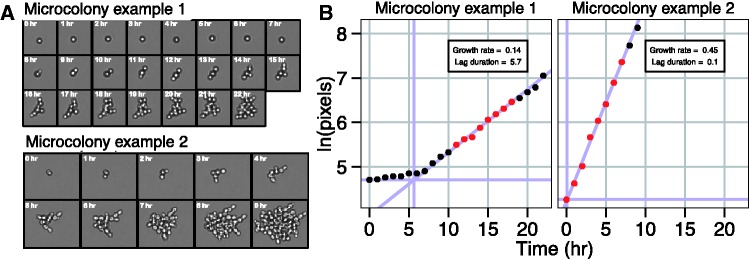
Calculation of growth parameters from microcolony growth profiles. Images (A) and growth profiles (B) for two representative microcolonies. Growth of microcolonies follows a simple two-phase log-linear model. The exponential growth phase for each microcolony is determined by a sliding window regression. The window of eight consecutive time points with the log-linear fit of greatest slope (and R2 > 0.9) defines the maximal growth rate (red points). Lag duration is defined by the intersection of the line defining the growth phase with a horizontal line defined by the initial cell size.
Microcolony Growth Rate is Determined by Glucose Concentration in Agreement with the Monod Model for Substrate-Limited Growth
We sought to determine 1) the relationship between population growth rate and glucose concentration and 2) whether the response to glucose concentration varies among natural isolates of S. cerevisiae. In preliminary studies, we found that mean growth rate was not affected in media containing ∼25-fold less glucose than standard media. Therefore, we analyzed microcolony growth rates in seven different glucose concentrations, ranging from 0.05 to 4.44 mM glucose, for four different prototrophic diploid strains. The strains derive from the laboratory (FY4/5, isogenic to the reference yeast strain S288c; hereafter lab), a North American oak tree (BC248; hereafter oak), a Californian vineyard (BC241; hereafter vineyard), and a cross between the oak and vineyard strains (BC252, hereafter oak/vineyard F1) (Gerke et al. 2006). The lab, oak, and vineyard strains are homozygous throughout the genome. Each strain was grown in each glucose environment in three wells per plate and each plate was replicated four times, resulting in more than 150,000 microcolony growth rate measurements (see Materials and Methods). We confirmed that microcolony area is highly correlated with cell number for different strains growing in 0.22 mM glucose (supplementary fig. S1, Supplementary Material online).
To differentiate variation due to the factors of interest (i.e., genetic background and environment) from variation unique to individual wells and plates (which likely result from variation in illumination, focus, and media preparation), we used mixed-effect linear modeling in which we included strain identity, glucose concentration, and their interaction as fixed effects and the plate and well as random effects (see supplementary note, Supplementary Material online). Estimates for each genotype–environment combination clearly showed growth rate to be a function of both genetic background and environment (supplementary fig. S2, Supplementary Material online). In order to combine growth rate measurements for a given genotype from different wells and plates, we normalized the data by subtracting plate and well conditional means estimated from the mixed model from each microcolony growth rate (see supplementary note, Supplementary Material online). The normalized data were used for further analysis.
We aimed to model the growth rate response to glucose concentration as a continuous function. Monod (1949) proposed that cell growth rate is related to the concentration of a limiting nutrient with saturating kinetics that resemble the Michaelis–Menten function. Using nonlinear least-squares regression, the normalized data for each strain were fit to the Monod model (fig. 2A and B; supplementary fig. S3 and table S1, Supplementary Material online). This model requires two parameters: the maximum growth rate (μmax) and the glucose concentration at which growth rate is half-maximal (Ks). Our estimates of μmax (0.43–0.52 h−1) and Ks (0.1–0.2 mM) are similar to values estimated for S. cerevisiae strains using bulk population growth rates in batch cultures and chemostats (Snoep et al. 2009), respectively. As our estimates are generated from a large number of measurements (28,000–42,000 growth rates per strain), these parameters are estimated extremely accurately with standard errors on the order of 10−4 (i.e., three orders of magnitude smaller than the parameters).
Fig. 2.

Growth rate is determined by glucose concentration in agreement with the Monod model for substrate-limited growth and varies between natural isolates of Saccharomyces cerevisiae. (A) Growth rate distributions for the lab strain in a range of glucose conditions. The line depicts the best fit of the Monod equation (inset) to the normalized data. Glucose concentration is shown on a logarithmic scale for clarity. (B) Fits to the Monod equation, showing growth rate as a function of glucose concentration for four strains. (C) Ks and μmax estimates for four strains. (D) Growth rates at 0.22 mM and 4.44 mM glucose are proxies for Ks and μmax, respectively. (E) Competitive growth rate assays between oak and vineyard strains at two dilution rates in chemostats (lower dilution rates correspond to lower glucose concentrations). Replicate experiments were centered by mean subtraction; lines depict linear regressions of log-transformed ratios against generations.
Alternatives to the Monod model have been proposed (Kovárová-Kovar and Egli 1998). Several of the alternatives are slight variations on the Monod model, containing an additional maintenance term representing the need for substrate even when cells are not growing (Kovárová-Kovar and Egli 1998). A conceptually different model is that of Westerhoff et al. (1982), which is based on nonequilibrium thermodynamics and proposes a linear dependence of growth rate on the logarithm of the substrate concentration (Westerhoff et al. 1982). We fit the data on each of the four strains to various alternative models (supplementary fig. S3 and table S1, Supplementary Material online). We compared model fits by Akaike information criterion (AIC), Bayesian information criterion (BIC), and, when appropriate, likelihood ratio tests (supplementary table S1, Supplementary Material online). With the exception of the lab strain, variants of the Monod model with an additional parameter slightly improved fit relative to the Monod model (supplementary fig. S3 and table S1, Supplementary Material online). Moreover, for all four strains, the Monod model fit substantially better than the Westerhoff model (supplementary fig. S3 and table S1, Supplementary Material online). The data therefore support the Monod model, or slight variations of it, over the most prominent competing model of substrate-limited growth.
The Growth Rate Response to Different Glucose Concentrations Varies among Yeast Strains
Each of the four strains is defined by a unique combination of μmax and Ks parameters (fig. 2C). The oak strain grows faster than both the vineyard and lab strains at all glucose concentrations; however, the data also display genotype-by-environment interactions. The oak/vineyard F1 has an intermediate value for Ks compared with the parental strains, whereas its μmax is identical to the oak parental strain (fig. 2C). This suggests distinct genetic effects underlying variation in these two parameters, which we estimated using the mid-parent heterosis (MPH) metric (Zorgo et al. 2012) (see Materials and Methods). In the case of Ks the net genetic effect is largely additive (MPH = 0.25), whereas in the case of μmax the net genetic effect is primarily dominant (MPH = 1). Genetic variation in μmax and Ks is reflected in growth rate in high and intermediate glucose concentrations, respectively: the growth rate of the oak/vineyard F1 at 0.22 mM glucose yields a MPH = 0.22, whereas at 4.44 mM the MPH = 0.9 (fig. 2D).
We sought to independently confirm the effect of environmental glucose concentration on the growth rates of the oak and vineyard strains. Therefore, we measured the relative growth rate differences between the oak and vineyard strains using competitive growth rate assays in chemostats (see Materials and Methods). Because the steady-state residual glucose concentration increases with increased dilution rate, we performed competition assays in glucose-limiting media at a low (D = 0.18–0.2 h−1) and a high (D = 0.35–0.39 h−1) dilution rate. Consistent with our microcolony growth rate results, the growth advantage of the oak strain at a low dilution rate is greater than at a high dilution rate (9.6 ± 0.28% vs. 0.6 ± 0.2%) (fig. 2E). Thus, both competition assays in chemostats and our microcolony growth rate assay reveal that growth rate differences between these two strains are conditional upon environmental glucose concentration.
To more broadly survey genetic variation in the response of growth rate to glucose concentrations, we used the microcolony assay to analyze additional strains (see Materials and Methods) covering a range of genetic backgrounds and ecologies (Liti et al. 2009). Each strain was measured in 0.22 and 4.44 mM glucose, resulting in more than 300,000 microcolony growth rates. These diverse strains exhibit a range of growth rates in both glucose concentrations (fig. 3), which is delimited by the fastest growing oak strains and the slowest growing lab strain. The majority of strains have similar, intermediate growth rates in 4.44 mM glucose, but show more pronounced differences in growth rates in 0.22 mM glucose. Similarity in growth rates does not appear to be determined solely by common ecologies or genetic relatedness (as defined by Liti et al. [2009]).
Fig. 3.
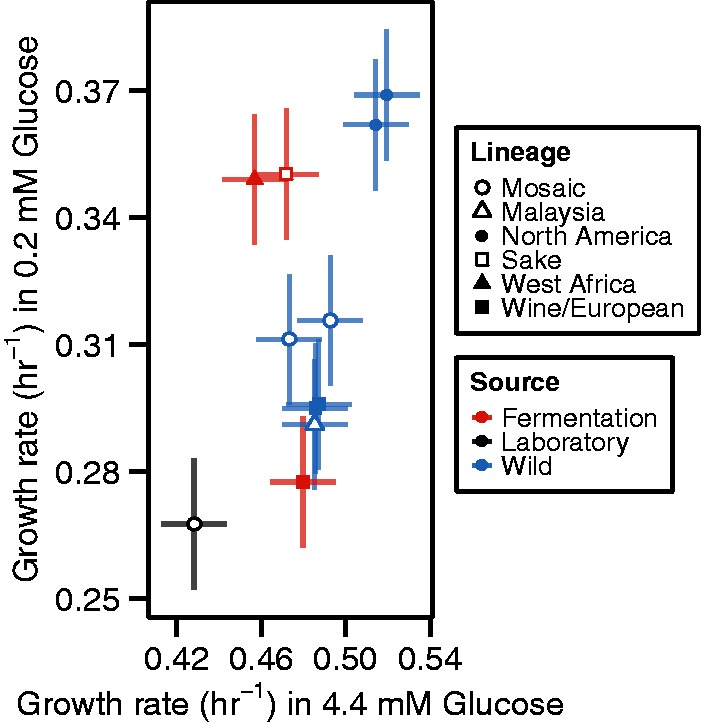
Natural variation in growth rates at two different glucose concentrations. Growth rates at 0.22 and 4.44 mM glucose for 11 diverse strains. Shapes and colors correspond to genetic lineage and source (as defined by Liti et al. [2009]), respectively. Error bars represent 95% confidence intervals.
Natural Variation Exists in the Distributions of Growth Rates within an Environment
In addition to variation in the average growth rate response to different glucose concentrations between genotypes, we observed substantial variation in growth rates within each environment for a given genotype. In contrast to our previous study in which we observed left-skewed distributions (Levy et al. 2012), growth rate distributions among diverse strains and glucose concentrations are largely symmetric. Therefore, we studied the effect on the shape of the growth rate distribution of ploidy, growth condition, and the recent history of the cells. We find that diploid strains have fewer slow-growing cells than haploid strains, growth in minimal medium yields fewer slow-growing cells than growth in rich media, and these effects of ploidy and nutrient conditions are particularly strong in the lab strain genetic background (supplementary fig. S4, Supplementary Material online).
We aimed to determine whether the variance of growth rate distributions differs among the different strains and glucose concentrations. We used log-transformed absolute values of the residuals from the mixed model as a measure of growth rate deviation (see supplementary note, Supplementary Material online). These deviations were then used as random variables in a new linear mixed model with the same structure as the original model. By using mixed modeling, we control for confounding technical effects of wells and plates on our estimates of average growth rate deviations for each strain at each nutrient concentration.
We find significant differences in the variability of growth rates among strains (fig. 4A) that are independent of the mean growth rate. Consistent with a lack of correlation between growth rate means and variances (supplementary fig. S5, Supplementary Material online), there is no clear relationship between the variances in growth rates in the two glucose concentrations (fig. 4A). Notably, two European soil strains, which have nearly identical mean growth rates, show significantly different deviations from the mean in both glucose concentrations (Wilcoxon test on normalized data, P value < 2.2e−16). Comparison of their growth rate distributions shows that the Dutch soil strain has a broader distribution than the Finnish soil strain, including both slower and faster growing cells (fig. 4B). These observations provide evidence that variability in growth rates within environments is genetically determined and may be affected by genetic factors that are independent of those factors that affect the mean growth rate response.
Fig. 4.
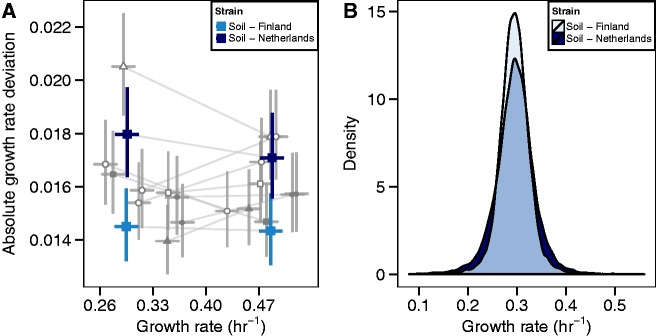
Variation in the extent of growth rate variability. (A) Absolute growth rate deviations are plotted against growth rate for 11 strains at 0.22 and 4.44 mM glucose. Lines connect estimates for the same strain at the two concentrations. Shapes indicate genetic lineage as defined in figure 3. The two European soil strains that exhibit the same mean but different absolute growth-rate deviations are highlighted. Error bars represent 95% confidence intervals. (B) Growth-rate distributions for the two soil strains at 0.22 mM glucose.
Natural Variation in Time to Reinitiation of Growth
Our assay enables estimation of the time each cell takes to reinitiate growth in a defined environment (fig. 1). The fraction of cells that undergo a detectable lag decreases as glucose concentration increases (fig. 5A). In 4.44 mM glucose, few cells lag, whereas in lower glucose concentrations the majority of cells display a delay before initiating growth. The fraction of cells that lag also displays genetic variation, as a greater proportion of vineyard and lab cells lag than oak cells in almost all environments. The percentage of lagging cells (at 0.11 and 0.22 mM glucose) correlates with estimates of Ks across strains (Pearson correlation coefficient >0.969, P value < 0.03). Although 30% of oak strain cells do not have a detectable lag time (in 0.05 mM glucose), the unimodal distribution of lag times for all strains suggests that a nutrient concentration threshold exists at which all cells exhibit a lag regardless of genotype.
Fig. 5.
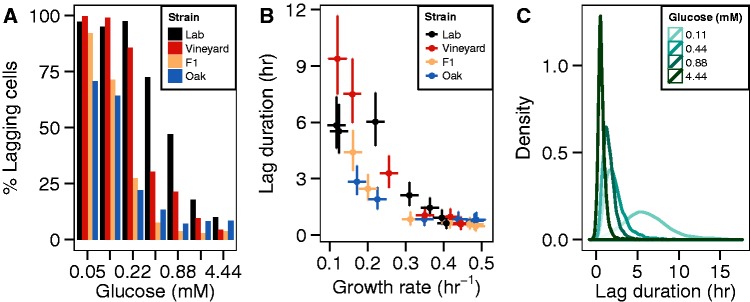
Variation in single-cell lag duration distributions. (A) Percentage of cells with estimated lag durations >1 h for four strains grown in seven different glucose concentrations. (B) Estimates of lag duration versus growth rate. Error bars represent 95% confidence intervals. (C) Distributions of lag times for the lab strain at four glucose concentrations.
To quantify the difference in lag duration between strains, we used mixed-effect modeling (see Materials and Methods and supplementary note, Supplementary Material online). We find that the average duration of lag is inversely correlated with mean growth rate, yet this relationship is variable between strains (fig. 5B). Strikingly, the lab and vineyard strains have longer average lag durations than the oak strain even when the subsequent growth rate is similar. This observation suggests that reinitiation and proliferation rates are under distinct genetic control.
We wanted to determine whether strains differ in the variability of lag time in addition to their differences in average lag duration. In contrast to growth rate, there is a strong relationship between average duration of lag and the associated variance within environments (fig 5C and supplementary fig. S6A, Supplementary Material online). In low-glucose environments, cells exhibit extremely heterogeneous behaviors with some cells initiating growth immediately, whereas others lag for more than 10 h before initiating growth. To control for this inherent relationship, we used smoothed local regression to estimate and control for the relationship between mean and variance. Specifically, median absolute deviations were regressed on medians and the residuals were compared between strains (supplementary fig. S6, Supplementary Material online). No significant difference was found between strains (F = 1.618, P = 0.185).
A Marker of Respiration Correlates with Growth Rate Negatively across Conditions and Positively within Conditions
As environmental glucose concentrations are known to affect whether yeast cells ferment or respire, we sought to determine the metabolic states of microcolonies growing at different glucose concentrations. CIT1 encodes a citrate synthase that catalyzes the first step in the TCA cycle. CIT1-GFP expression has been shown to correlate with the degree of respiration on different carbon sources (Fendt and Sauer 2010), and the relative abundance of CIT1 mRNA is negatively correlated with growth rate in glucose-limited chemostats (Brauer et al. 2007). Therefore, we used the average expression of a CIT1-GFP fusion protein (in the lab strain genetic background) as a marker of respiratory activity in growing microcolonies (see Materials and Methods).
To define the range of CIT1 expression, we measured protein fluorescence and growth rates in the lab strain growing in 1) a nonfermentable carbon source (acetate); 2) a high concentration of glucose (2%, 111 mM), in which respiration is minimal; and 3) galactose, in which cells simultaneously respire and ferment (Fendt and Sauer 2010). We then measured CIT1 expression and growth rate simultaneously in the range of glucose concentrations over which all strains exhibit glucose-dependent growth rate variation. Across all conditions CIT1 expression is negatively correlated with growth rate (fig. 6A). These data are consistent with a near-complete absence of respiratory activity in cells growing in concentrations as low as 4.44 mM glucose and a systematic increase in respiration as environmental glucose concentration decreases.
Fig. 6.

Respiration and growth rate are negatively correlated between environments but positively correlated within environments. (A) Estimates of CIT1 expression versus growth rate. Colors depict different environments. Error bars represent 95% confidence intervals. (B) Microcolony growth rates and CIT1 expression with glucose, galactose, and acetate as carbon sources. Lines depict major axis type II regressions for the central 98% of growth-rate variation in each condition. Nonparametric correlation coefficients (Spearman ρ) were calculated for each condition. Bootstrapped standard errors range between 0.012 and 0.014. (C) Same as (B) for four different glucose concentrations.
By contrast, within environments there is a positive correlation between CIT1 expression and growth rate in different carbon sources (fig. 6B) and different glucose concentrations (fig. 6C). The strength of this relationship increases as average growth rate decreases. That is, although the average growth rate in conditions that promote increased respiration (low glucose concentrations or alternative carbon sources) is lower, within these conditions cells that have higher expression of CIT1 tend to grow faster than cells with lower levels of CIT1 expression.
Discussion
The quantitative analysis of microbial growth was initiated by Jacques Monod and colleagues in the middle of the 20th century (Monod 1949). The advent of genomics and systems biology has stimulated renewed interest in understanding cell growth as recent advances make it clear that the rate of cell growth is a major determinant of the transcriptional (Regenberg et al. 2006; Brauer et al. 2007; Gutteridge et al. 2010) and metabolic state (Boer et al. 2009; Gutteridge et al. 2010) of the cell. Moreover, modeling cell behavior requires incorporation of cell growth rate as a parameter (Scott and Hwa 2011). Here, we have extended and enhanced our recently reported microcolony growth assay (Levy et al. 2012), which combines the advantages of accurate measurement of variation in growth rates between individual cells with high-throughput capacity enabling investigation of growth rate distributions across genetic backgrounds and environments.
We have used this assay to study growth rate variation in response to changes in extracellular glucose concentrations. We have shown that the growth rate response of S. cerevisiae to glucose concentration agrees with the Monod model of nutrient-regulated growth. The growth rate of yeast cells is continuously adjusted in response to the concentration of environmental glucose, and maximal growth rates are achieved at low millimolar concentrations of glucose. Although it has been suggested that differences in genotype can influence the parameters of the Monod model (Ferenci 1999), these parameters had not been compared between different natural isolates in any organism. We found that the growth rate response to glucose shows natural variation among yeast strains. Comparisons of two homozygous parental strains and their F1 hybrid as well as a number of wild strains suggest that Ks and μmax are under distinct genetic control. As fluctuating nutrient availability and nutrient limitation are probably important aspects of the natural habitats of microbes, we expect that identifying the genetic factors underlying variation in growth rates at different glucose concentrations would prove informative about both the genetic control of cell growth and the evolutionary histories of diverse yeast strains.
Although functional genomic studies have shown that deletion of many genes can affect cell growth rates in rich media conditions (Giaever et al. 2002; Hillenmeyer et al. 2008), there are few examples of natural alleles that underlie variation in cell growth rate. Natural variation in components of the RAS/cAMP pathway (IRA1 and IRA2) has been implicated in regulating quantitative growth at high temperature (Parts et al. 2011) and expression of growth-related transcripts in glucose and ethanol (Smith and Kruglyak 2008). The Monod constant (Ks) relates to the affinity of the cell for the nutrient, but its biological interpretation is a subject of debate (Liu 2007). Ks may be related to the Km of the relevant transporter, but the relationship between Ks and Km depends on assumptions about the kinetics of the transport system, and the extent of control that the transport step has on the growth rate can change between different substrate concentrations (Snoep et al. 2009). Increased expression of the high-affinity glucose transporters HXT6 and HXT7 has been shown to confer increased fitness in experimental evolution in glucose-limited conditions (Brown et al. 1998; Gresham et al. 2008), suggesting that growth rates at submaximal glucose concentrations may be largely determined by substrate transport rates.
A unique aspect of our assay is the ability to monitor lag in individual cells. Lag duration in bulk populations is usually poorly defined and the accuracy of its estimation is limited by the power to detect growth at low cell density. In population growth curves, the transition between lag and growth phases is typically smooth, due to variability between individual cells (Buchanan et al. 1997), making the determination of a single lag time somewhat arbitrary. When measuring single cells, our data are best described by a distinct transition between lag and the exponential growth phase. Our results support previous observations (Peleg and Corradini 2011) that these different phases of growth can vary independently. We observe significant heterogeneity in the duration of lag particularly as environments become increasingly poor in glucose. Understanding the molecular basis of heterogeneity in lag will provide insight into the processes that underlie exit from quiescence and reinitiation of cell growth and may have practical applications; for example, in the food industry (Swinnen et al. 2004), where outgrowth of a small number of individual cells is a major concern.
We observed phenotypic variability in both lag and growth phases. The advantage of increased cellular variability in the face of novel and fluctuating environments is relevant to the evolutionary rates of cancer progression and drug resistance (Frank and Rosner 2012). Although the extent of nongenetic phenotypic variation has important implications for evolutionary dynamics, it has been understudied in part because of the difficulties of accurately assessing phenotypes of individual cells. Consequently, the mechanisms regulating nongenetic phenotypic variability remain poorly understood (Pelkmans 2012; Geiler-Samerotte et al. 2013). One possible source of phenotypic variability is differences in gene expression between individual cells. Possible mechanisms by which these differences can be enhanced or reduced include regulation of chromatin modification (Levy and Siegal 2008), promoter structure (Ferguson et al. 2012), and variability in the inheritance and functionality of mitochondria (Johnston et al. 2012). Furthermore, variation in protein translation capacity between cells (possibly as a result of variation in ribosomal content), may contribute to variation in growth rates (Scott and Hwa 2011). For cell growth in particular, variability in the lengths of different cell cycle stages had been observed (Talia et al. 2007; Son et al. 2012), but the impact of natural variation on mechanisms controlling variability of cell cycle timing has not been explored. Our identification of strains that differ substantially in their growth rate variances, despite nearly identical means, presents an ideal scenario for identifying the genetic and molecular basis of natural variation in growth rate variability.
We find that a decrease in cell growth rate corresponds with increased respirative activity, as measured by CIT1 expression, consistent with previous studies of the diauxic shift and yeast metabolic cycle (Brauer et al. 2005; Silverman et al. 2010). Because cells increase their respiratory activity at low glucose concentrations, differences in the efficiency of respiration between the oak and vineyard strains (Gerke et al. 2006) may underlie variation in Ks. Intriguingly, in contrast to the negative correlation between CIT1 expression and growth rate between glucose environments, we find that within a glucose environment, increased expression of CIT1 is correlated with increased growth rate. We suggest that this correlation may represent global differences in rates of protein production between cells that are not necessarily specific to CIT1. The fastest growing cells within the same environmental conditions may have greater translational capacity. In this scenario, the environmental conditions specify the metabolic state of the cell, but inter-individual variation in protein production capacity underlies heterogeneity in growth rates. As a result, different combinations of metabolic and translational capacity can specify the same growth rate. Continued investigation of variation both within and between environments will provide a deeper understanding of the genetic and nongenetic sources of this variation and how cells optimize their growth potential in a particular environment.
Materials and Methods
Yeast Strains and Media
All strains used in this study are prototrophic diploids, with the exception of two prototropic haploids used to investigate the effect of ploidy on the shape of the growth rate distribution (supplementary fig. S4, Supplementary Material online). All wild strains were obtained from the lab of Barak Cohen (Washington University). The strains used in this study are the oak (BC248), vineyard (BC241), the F1 hybrid (BC252), an additional North American oak strain (YPS126), two European strains isolated from soil samples (DBVPG1373 and DBVPG1788), three genetically diverse strains isolated from plants/fruit in Malaysia, Hawaii, and the Bahamas (UWOPS03-461.4, UWOPS87-2421, and UWOPS83-787.3), an African palm wine isolate (Y12), and a West African Bili wine isolate (DBVPG0644). Strains shown in supplementary fig. S4, Supplementary Material online, are the prototrophic diploid laboratory strain FY4/5; its haploid parent of mating-type a, FY4; the oak strain from which BC248 was derived, YPS606; and its MATa haploid spore (after HO was knocked out), YPS2056.
For competitive growth rate assays, the HO locus was replaced with the mCherry fluorescent protein and a nourseothricin resistance marker (natMX4) in both the oak and vineyard strains using high-efficiency transformation as in Gerke et al. (2006). A haploid CIT1-GFP strain (from the yeast-GFP collection [Huh et al. 2003]) was purchased from Invitrogen and mated to FY5 (a prototropic alpha haploid), creating a functionally prototrophic diploid. All media used in this study were chemically defined carbon-limiting media (Saldanha et al. 2004; Brauer et al. 2005) without amino acid or nucleotide supplements.
Inoculation of Microcolonies
For all growth rate experiments, frozen cell stocks were streaked out on YPD plates and single colonies were used for inoculation. Cells were cultured in 4.44 mM glucose media for ∼24 h, diluted 1:300 into fresh 4.44 mM glucose media, and cultured for ∼48 h. This procedure reduced variability in culture density at the initiation of growth rate experiments and ensured that cells were starved for carbon. Cells were then diluted to a concentration of 1–2 × 10⁴ cells/ml in fresh media containing defined glucose concentrations and plated in 96-well glass bottom plates coated with concanavalin A. Each well was loaded with 400 μl of diluted cells (i.e., ∼6000 cells). The glucose concentration is assumed to remain approximately constant throughout the experiment due to the low cell density and large media volume within each well.
Microscopy and Automated Image Analysis
Experiments were conducted as described in Levy et al. (2012), including all equipment and software for computing and tracking microcolony areas over time. The focusing routine was updated to a manual assignment for each well based on a single field (which took ∼10 min per 96-well plate). Images were taken every hour for 2,880 fields (30 fields per well) for 20–24 h. CIT1-GFP fluorescence was captured for 2 s at 10× gain; due to the long exposure time, these experiments contained only 32 wells per plate and 20 fields per well (640 fields total).
Growth Profiles and CIT1 Expression Analysis
Microcolony growth profiles were analyzed according to a two-phase log-linear model. The use of a simple model is preferred (Buchanan et al. 1997; Peleg and Corradini 2011), particularly as microcolony growth profiles do not exhibit the smooth transition between phases caused by variability among cells in population growth curves (Buchanan et al. 1997). For each microcolony, a sliding window approach was used to determine the phase of maximal growth. The natural log of microcolony area was regressed against time for each set of eight time points and growth rate was calculated as the greatest slope of a regression with R2 >0.9. Subsequently, lag duration was estimated as the intersection of this regression with a horizontal line determined by the area of the microcolony at the first time point. Lag duration was not calculated for colonies that were not tracked in the first time point. A small proportion of microcolonies with aberrant growth parameters (growth rate < 0.075 h−1, lag duration >15 h, or initial size >250 pixels) were omitted from further analysis. All calculations and analysis were conducted in R.
CIT1 fluorescence was averaged over area and time. First, total fluorescence intensity was measured for each microcolony and divided by the area of the microcolony, resulting in a measurement of fluorescence per pixel for each microcolony at each time point. Measurements were then averaged across four time points, during the period of maximal growth rate. Values were also log-transformed to reduce heteroscedasticity.
MPH Metric
MPH was calculated as:
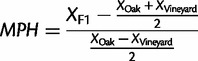 |
where X is either the estimate of Ks and μmax or the combined fixed-effect parameters (see supplementary note, Supplementary Material online) for growth at 0.22 or 4.44 mM glucose.
Competitive Growth Rate Assays
Competitive growth rate assays were performed in chemostats as described (Gresham et al. 2008). Each strain was competed against a mCherry-labeled strain in reciprocal experiments. Competitions were initiated with equal proportions of each strain and samples were obtained every 3–6 h over 20 generations. The proportion of each strain at each time point was measured using flow cytometry and the relative growth rate difference was determined by linear regression of ln(strain1/strain2) against time (measured in generations). The slope of the regression is the proportional difference in growth rate (i.e., the fitness advantage) of one strain relative to the other. Each competition was performed in replicate and data from replicate and reciprocal competitions were normalized by mean subtraction and pooled. Competitions were performed in chemostats at two different dilution rates, approximately 0.2 h−1 (low) and 0.4 h−1 (high).
Statistical Analysis
All statistical analyses used R (R Core 2013). Mixed-effect modeling was performed using the package lme4 (Bates et al. 2011) to analyze all measurements obtained from the microcolony growth assay, including distributions of growth rates, lag durations, and fluorescent measurements. We use mixed-effect modeling to estimate parameters and eliminate various aspects of technical variation on cell growth measurements. A discussion on the use of mixed-effect models including determination of terms and evaluation of parameters is contained in a supplementary note, Supplementary Material online. Reproducibility of the analysis presented in this article is also discussed in the supplementary note, Supplementary Material online. Estimation of the nonlinear regression parameters for the Monod growth model was performed using the nls function in R. These parameters’ standard errors were estimated both by linearization and by bootstrapping, which yielded similar estimates. Correlation between growth rates and CIT1-GFP fluorescence was visualized by type II ranged major axis regression (Legendre 2011), as both measurements are dependent variables, using the lmodel2 package.
Supplementary Material
Supplementary note, file, figures S1–S9, and table S1 are available at Molecular Biology and Evolution online (http://www.mbe.oxfordjournals.org/).
Acknowledgments
The authors thank members of the Siegal and Gresham labs for valuable discussions and two anonymous reviewers for helpful comments. They also thank Barak Cohen for providing strains used in this study. This work was supported by the National Institutes of Health (GM097415 to M.L.S.) and the National Science Foundation (MCB-1244219 to D.G.) and a Dupont Young Professor award to D.G.
References
- Bates D, Maechler M, Bolker B. 2011. lme4: Linear mixed-effects models using S4 classes. R package version 0.999999-0. [cited 2013 September 14]. Available from: http://CRAN.R-project.org/package=lme4. [Google Scholar]
- Blomberg A. Measuring growth rate in high-throughput growth phenotyping. Curr Opin Biotechnol. 2011;22:94–102. doi: 10.1016/j.copbio.2010.10.013. [DOI] [PubMed] [Google Scholar]
- Boer VM, Crutchfield CA, Bradley PH, Botstein D, Rabinowitz JD. Growth-limiting intracellular metabolites in yeast growing under diverse nutrient limitations. Mol Biol Cell. 2009;21:198–211. doi: 10.1091/mbc.E09-07-0597. [DOI] [PMC free article] [PubMed] [Google Scholar]
- Brauer MJ, Saldanha AJ, Dolinski K, Botstein D. Homeostatic adjustment and metabolic remodeling in glucose-limited yeast cultures. Mol Biol Cell. 2005;16:2503–2517. doi: 10.1091/mbc.E04-11-0968. [DOI] [PMC free article] [PubMed] [Google Scholar]
- Brauer MJ, Huttenhower C, Airoldi EM, Rosenstein R, Matese JC, Gresham D, Boer VM, Troyanskaya OG, Botstein D. Coordination of growth rate, cell cycle, stress response, and metabolic activity in yeast. Mol Biol Cell. 2007;19:352–367. doi: 10.1091/mbc.E07-08-0779. [DOI] [PMC free article] [PubMed] [Google Scholar]
- Brown CJ, Todd KM, Rosenzweig RF. Multiple duplications of yeast hexose transport genes in response to selection in a glucose-limited environment. Mol Biol Evol. 1998;15:931–942. doi: 10.1093/oxfordjournals.molbev.a026009. [DOI] [PubMed] [Google Scholar]
- Buchanan R, Whiting R, Damert W. When is simple good enough: a comparison of the Gompertz, Baranyi, and three-phase linear models for fitting bacterial growth curves. Food Microbiol. 1997;14:313–326. [Google Scholar]
- Cubillos FA, Billi E, Zörgö E, Parts L, Fargier P, Omholt S, Blomberg A, Warringer J, Louis EJ, Liti G. Assessing the complex architecture of polygenic traits in diverged yeast populations. Mol Ecol. 2011;20:1401–1413. doi: 10.1111/j.1365-294X.2011.05005.x. [DOI] [PubMed] [Google Scholar]
- Fendt S-M, Sauer U. Transcriptional regulation of respiration in yeast metabolizing differently repressive carbon substrates. BMC Syst Biol. 2010;4:12. doi: 10.1186/1752-0509-4-12. [DOI] [PMC free article] [PubMed] [Google Scholar]
- Ferenci T. “Growth of bacterial cultures” 50 years on: towards an uncertainty principle instead of constants in bacterial growth kinetics. Res Microbiol. 1999;150:431–438. doi: 10.1016/s0923-2508(99)00114-x. [DOI] [PubMed] [Google Scholar]
- Ferguson ML, Le Coq D, Jules M, Aymerich S, Radulescu O, Declerck N, Royer CA. Reconciling molecular regulatory mechanisms with noise patterns of bacterial metabolic promoters in induced and repressed states. Proc Natl Acad Sci U S A. 2012;109:155–160. doi: 10.1073/pnas.1110541108. [DOI] [PMC free article] [PubMed] [Google Scholar]
- Frank SA. Natural selection. II. Developmental variability and evolutionary rate. J Evol Biol. 2011;24:2310–2320. doi: 10.1111/j.1420-9101.2011.02373.x. [DOI] [PubMed] [Google Scholar]
- Frank SA, Rosner MR. Nonheritable cellular variability accelerates the evolutionary processes of cancer. PLoS Biol. 2012;10:e1001296. doi: 10.1371/journal.pbio.1001296. [DOI] [PMC free article] [PubMed] [Google Scholar]
- Geiler-Samerotte K, Bauer C, Li S, Ziv N, Gresham D, Siegal M. The details in the distributions: why and how to study phenotypic variability. Curr Opin Biotechnol. 2013;24:752–759. doi: 10.1016/j.copbio.2013.03.010. [DOI] [PMC free article] [PubMed] [Google Scholar]
- Gerke JP, Chen CTL, Cohen BA. Natural isolates of Saccharomyces cerevisiae display complex genetic variation in sporulation efficiency. Genetics. 2006;174:985–997. doi: 10.1534/genetics.106.058453. [DOI] [PMC free article] [PubMed] [Google Scholar]
- Giaever G, Chu AM, Ni L, et al. (73 co-authors) Functional profiling of the Saccharomyces cerevisiae genome. Nature. 2002;418:387–391. doi: 10.1038/nature00935. [DOI] [PubMed] [Google Scholar]
- Gresham D, Desai MM, Tucker CM, Jenq HT, Pai DA, Ward A, DeSevo CG, Botstein D, Dunham MJ. The repertoire and dynamics of evolutionary adaptations to controlled nutrient-limited environments in yeast. PLoS Genet. 2008;4:e1000303. doi: 10.1371/journal.pgen.1000303. [DOI] [PMC free article] [PubMed] [Google Scholar]
- Gutteridge A, Pir P, Castrillo JI, Charles PD, Lilley KS, Oliver SG. Nutrient control of eukaryote cell growth: a systems biology study in yeast. BMC Biol. 2010;8:68. doi: 10.1186/1741-7007-8-68. [DOI] [PMC free article] [PubMed] [Google Scholar]
- Hillenmeyer ME, Fung E, Wildenhain J, et al. (14 co-authors) The chemical genomic portrait of yeast: uncovering a phenotype for all genes. Science. 2008;320:362–365. doi: 10.1126/science.1150021. [DOI] [PMC free article] [PubMed] [Google Scholar]
- Huh W-K, Falvo JV, Gerke LC, Carroll AS, Howson RW, Weissman JS, O’Shea EK. Global analysis of protein localization in budding yeast. Nature. 2003;425:686–691. doi: 10.1038/nature02026. [DOI] [PubMed] [Google Scholar]
- Johnston IG, Gaal B, Neves RP das, Enver T, Iborra FJ, Jones NS. Mitochondrial variability as a source of extrinsic cellular noise. PLoS Comput Biol. 2012;8:e1002416. doi: 10.1371/journal.pcbi.1002416. [DOI] [PMC free article] [PubMed] [Google Scholar]
- Kaniak A, Xue Z, Macool D, Kim J-H, Johnston M. Regulatory network connecting two glucose signal transduction pathways in Saccharomyces cerevisiae. Eukaryot Cell. 2004;3:221–231. doi: 10.1128/EC.3.1.221-231.2004. [DOI] [PMC free article] [PubMed] [Google Scholar]
- Kovárová-Kovar K, Egli T. Growth kinetics of suspended microbial cells: from single-substrate-controlled growth to mixed-substrate kinetics. Microbiol Mol Biol Rev. 1998;62:646–666. doi: 10.1128/mmbr.62.3.646-666.1998. [DOI] [PMC free article] [PubMed] [Google Scholar]
- Kussell E, Leibler S. Phenotypic diversity, population growth, and information in fluctuating environments. Science. 2005;309:2075–2078. doi: 10.1126/science.1114383. [DOI] [PubMed] [Google Scholar]
- Legendre P. 2011. lmodel2: Model II Regression. R package version 1.7-1. [cited 2013 September 14]. Available from: http://CRAN.R-project.org/package=lmodel2. [Google Scholar]
- Levy SF, Siegal ML. Network hubs buffer environmental variation in Saccharomyces cerevisiae. PLoS Biol. 2008;6:e264. doi: 10.1371/journal.pbio.0060264. [DOI] [PMC free article] [PubMed] [Google Scholar]
- Levy SF, Ziv N, Siegal ML. Bet hedging in yeast by heterogeneous, age-correlated expression of a stress protectant. PLoS Biol. 2012;10:e1001325. doi: 10.1371/journal.pbio.1001325. [DOI] [PMC free article] [PubMed] [Google Scholar]
- Liti G, Carter DM, Moses AM, et al. (26 co-authors) Population genomics of domestic and wild yeasts. Nature. 2009;458:337–341. doi: 10.1038/nature07743. [DOI] [PMC free article] [PubMed] [Google Scholar]
- Liti G, Louis EJ. Advances in quantitative trait analysis in yeast. PLoS Genet. 2012;8:e1002912. doi: 10.1371/journal.pgen.1002912. [DOI] [PMC free article] [PubMed] [Google Scholar]
- Liu Y. Overview of some theoretical approaches for derivation of the Monod equation. Appl Microbiol Biotechnol. 2007;73:1241–1250. doi: 10.1007/s00253-006-0717-7. [DOI] [PubMed] [Google Scholar]
- Monod J. The growth of bacterial cultures. Annu Rev Microbiol. 1949;3:371–394. [Google Scholar]
- Parts L, Cubillos FA, Warringer J, et al. (14 co-authors) Revealing the genetic structure of a trait by sequencing a population under selection. Genome Res. 2011;21:1131–1138. doi: 10.1101/gr.116731.110. [DOI] [PMC free article] [PubMed] [Google Scholar]
- Peleg M, Corradini MG. Microbial growth curves: what the models tell us and what they cannot. Crit Rev Food Sci Nutr. 2011;51:917–945. doi: 10.1080/10408398.2011.570463. [DOI] [PubMed] [Google Scholar]
- Pelkmans L. Using cell-to-cell variability—a new era in molecular biology. Science. 2012;336:425–426. doi: 10.1126/science.1222161. [DOI] [PubMed] [Google Scholar]
- Regenberg B, Grotkjaer T, Winther O, Fausbøll A, Akesson M, Bro C, Hansen LK, Brunak S, Nielsen J. Growth-rate regulated genes have profound impact on interpretation of transcriptome profiling in Saccharomyces cerevisiae. Genome Biol. 2006;7:R107. doi: 10.1186/gb-2006-7-11-r107. [DOI] [PMC free article] [PubMed] [Google Scholar]
- Reifenberger E, Boles E, Ciriacy M. Kinetic characterization of individual hexose transporters of Saccharomyces cerevisiae and their relation to the triggering mechanisms of glucose repression. Eur J Biochem. 1997;245:324–333. doi: 10.1111/j.1432-1033.1997.00324.x. [DOI] [PubMed] [Google Scholar]
- Saldanha AJ, Brauer MJ, Botstein D. Nutritional homeostasis in batch and steady-state culture of yeast. Mol Biol Cell. 2004;15:4089–4104. doi: 10.1091/mbc.E04-04-0306. [DOI] [PMC free article] [PubMed] [Google Scholar]
- Scott M, Hwa T. Bacterial growth laws and their applications. Curr Opin Biotechnol. 2011;22:559–565. doi: 10.1016/j.copbio.2011.04.014. [DOI] [PMC free article] [PubMed] [Google Scholar]
- Silverman SJ, Petti AA, Slavov N, et al. (11 co-authors) Metabolic cycling in single yeast cells from unsynchronized steady-state populations limited on glucose or phosphate. Proc Natl Acad Sci U S A. 2010;107:6946–6951. doi: 10.1073/pnas.1002422107. [DOI] [PMC free article] [PubMed] [Google Scholar]
- Smets B, Ghillebert R, De Snijder P, Binda M, Swinnen E, De Virgilio C, Winderickx J. Life in the midst of scarcity: adaptations to nutrient availability in Saccharomyces cerevisiae. Curr Genet. 2010;56:1–32. doi: 10.1007/s00294-009-0287-1. [DOI] [PubMed] [Google Scholar]
- Smith EN, Kruglyak L. Gene–environment interaction in yeast gene expression. PLoS Biol. 2008;6:e83. doi: 10.1371/journal.pbio.0060083. [DOI] [PMC free article] [PubMed] [Google Scholar]
- Snoep JL, Mrwebi M, Schuurmans JM, Rohwer JM, Teixeira de Mattos MJ. Control of specific growth rate in Saccharomyces cerevisiae. Microbiology. 2009;155:1699–1707. doi: 10.1099/mic.0.023119-0. [DOI] [PubMed] [Google Scholar]
- Son S, Tzur A, Weng Y, Jorgensen P, Kim J, Kirschner MW, Manalis SR. Direct observation of mammalian cell growth and size regulation. Nat Methods. 2012;9:910–912. doi: 10.1038/nmeth.2133. [DOI] [PMC free article] [PubMed] [Google Scholar]
- Swinnen IAM, Bernaerts K, Dens EJJ, Geeraerd AH, Van Impe JF. Predictive modelling of the microbial lag phase: a review. Int J Food Microbiol. 2004;94:137–159. doi: 10.1016/j.ijfoodmicro.2004.01.006. [DOI] [PubMed] [Google Scholar]
- Di Talia S, Skotheim JM, Bean JM, Siggia ED, Cross FR. The effects of molecular noise and size control on variability in the budding yeast cell cycle. Nature. 2007;448:947–951. doi: 10.1038/nature06072. [DOI] [PubMed] [Google Scholar]
- R Core Team. R: A language and environment for statistical computing. Vienna (Austria): 2013. : R Foundation for Statistical Computing. R version 2.15.3[cited 2013 September 14]. Available from: http://www.R-project.org/ [Google Scholar]
- Westerhoff HV, Lolkema JS, Otto R, Hellingwerf KJ. Thermodynamics of growth. Non-equilibrium thermodynamics of bacterial growth. The phenomenological and the mosaic approach. Biochim Biophys Acta. 1982;683:181–220. doi: 10.1016/0304-4173(82)90001-5. [DOI] [PubMed] [Google Scholar]
- Yin Z, Wilson S, Hauser NC, Tournu H, Hoheisel JD, Brown AJP. Glucose triggers different global responses in yeast, depending on the strength of the signal, and transiently stabilizes ribosomal protein mRNAs. Mol Microbiol. 2003;48:713–724. doi: 10.1046/j.1365-2958.2003.03478.x. [DOI] [PubMed] [Google Scholar]
- Zaman S, Lippman SI, Zhao X, Broach JR. How Saccharomyces responds to nutrients. Annu Rev Genet. 2008;42:27–81. doi: 10.1146/annurev.genet.41.110306.130206. [DOI] [PubMed] [Google Scholar]
- Zorgo E, Gjuvsland A, Cubillos FA, Louis EJ, Liti G, Blomberg A, Omholt SW, Warringer J. Life history shapes trait heredity by accumulation of loss-of-function alleles in yeast. Mol Biol Evol. 2012;29:1781–1789. doi: 10.1093/molbev/mss019. [DOI] [PubMed] [Google Scholar]
Associated Data
This section collects any data citations, data availability statements, or supplementary materials included in this article.