

Abstract
A labeled gene tree topology that disagrees with a labeled species tree topology is said to be anomalous if it is more probable under a coalescent model for gene lineage evolution than the labeled gene tree topology that matches the species tree. It has previously been shown that as a consequence of short internal branches of the species tree, for every labeled species tree topology with five or more taxa, and for asymmetric four-taxon species tree topologies, an assignment of species tree branch lengths can be made which gives rise to anomalous gene trees (AGTs). Here, I offer an alternative characterization of this result—a labeled species tree topology produces AGTs if and only if it contains two consecutive internal branches in an ancestor–descendant relationship—and I provide a proof that follows from the change in perspective. The reformulation and alternative proof of the existence result for AGTs provide the insight that it is not merely short internal branches that generate AGTs, but instead, short internal branches that are arranged consecutively.
Keywords: anomalous gene trees, coalescent, species trees
For a labeled binary rooted species tree on n species, with one gene lineage sampled per species, an AGT is a labeled gene tree topology whose probability under the multispecies coalescent model exceeds the probability of the matching gene tree topology (Degnan and Rosenberg 2006). Denoting a labeled species tree with topology ψ and branch lengths  by
by  , denoting a random labeled gene tree topology produced under the model by G, and denoting probability under the model by
  , a labeled gene tree topology g is anomalous for σ if
| (1) |
A labeled species tree topology ψ is said to produce anomalies if there exist g and  such that g is anomalous for
  . The set of values of
  for which ψ produces anomalies is the anomaly zone for ψ.
AGTs represent a surprising feature of gene tree probability distributions useful for studying the behavior of species tree inference. They contribute to the challenge of inferring species trees from gene trees, as they illuminate the possibility of statistical inconsistency for inference algorithms. Further, the number of AGTs and the complexity of AGT phenomena for a given species tree provide intuition regarding the difficulty of inferring the species tree topology (Degnan and Rosenberg 2006; Rosenberg and Tao 2008; Degnan 2013b). The mathematics of AGTs can assist in understanding genealogical evolution more generally; because AGTs represent peculiar consequences of the descent of genetic lineages on a species tree, the study of AGTs can facilitate assessments of ways in which evolutionary processes give rise to complex patterns in gene tree distributions.
Degnan and Rosenberg (2006) characterized the set of species tree topologies that produce anomalies, showing that every four-taxon asymmetric species tree topology and every species tree topology with five or more taxa produces anomalies, and that three-taxon gene tree topologies and four-taxon symmetric gene tree topologies do not produce anomalies. The proof relied on the use of n-maximally probable labeled topologies, the set of n-taxon topologies whose probabilities under the Yule model of random branching (Harding 1971) equal or exceed those of all other n-taxon topologies. For n = 3 and n = 4, the proof involved a direct calculation. For  , we first obtained the AGT existence result for species tree topologies that are not n-maximally probable, a class that includes most n-taxon topologies. We then showed that for n = 5, 6, 7, and 8, the n-maximally probable species tree topologies also produce anomalies. Finally, for n-maximally probable species tree topologies with
  , we provided a construction that identifies a subtree whose branch lengths can be chosen such that the subtree, and in turn the full species tree, produces anomalies (fig. 1). The construction relied on the fact that a binary tree with
  taxa must have a subtree of 5, 6, 7, or 8 taxa.
Fig. 1.
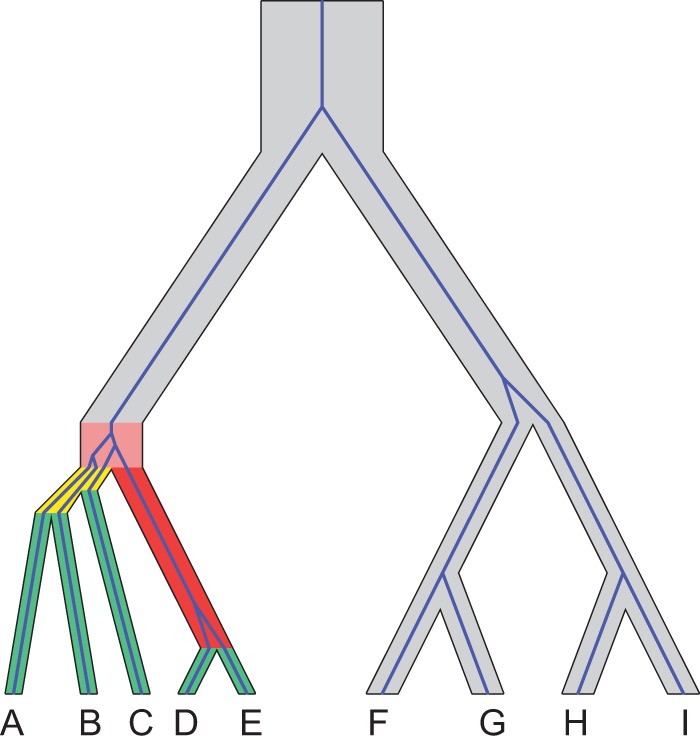
Schematic of the proof of Degnan and Rosenberg (2006) for  taxa. Consider
  taxa, with one gene lineage sampled per taxon. To show that a species tree topology with n taxa has AGTs, first, a subtree with 5, 6, 7, or 8 taxa is identified (this choice of subtree represents a minor modification from the original use of the strong induction principle in choosing the subtree). Branch lengths are chosen so that AGTs occur for the subtree. Outside the subtree, branches are chosen to be long, so that each gene tree coalescence is likely to occur on the first allowable branch. In the figure, the subtree
 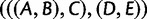 shown in color produces AGTs. Gene lineages from taxa D and E are likely to coalesce on the long red branch, generating gene lineage
  ; however, coalescences are unlikely on the short yellow branches. The green branches indicate locations where no coalescences can occur. Gene lineages A, B, C, and
  are likely to coalesce above the root of the subtree. Because coalescence of four lineages in a population is more likely to generate a specific symmetric labeled topology than a specific asymmetric labeled topology, these coalescences are more likely to generate a specific symmetric subtree for the four lineages—
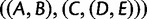 ,
,  , or
, or  —than they are to generate the matching subtree
  .
.
Although our earlier proof fully characterizes which species tree topologies produce anomalies, its division of topologies by whether or not they are n-maximally probable somewhat artificially generates two distinct scenarios for production of AGTs. For species tree topologies that are not n-maximally probable, all branches are made short, so that most coalescences occur above the root. For n-maximally probable species tree topologies, however, particular branches are made short and others are made long, so that only certain coalescences occur above the root.
Here I provide a simpler statement and proof of the AGT existence theorem, relying on a unifying criterion that can more easily enable diagnosis of situations likely to produce AGTs. The approach focuses on pairs of consecutive short branches. Define the depth of a tree as the maximum over leaves of the number of branches separating the leaf from the root. The depth is a topological property, evaluating the length of the longest path from a leaf to the root by counting the edges on the path.
Theorem 1 —
A labeled species tree topology produces anomalies if and only if its depth is at least 3.
The characterization in Theorem 1 of species tree topologies that produce anomalies is equivalent to the corresponding characterization in Degnan and Rosenberg (2006), but as we will see, its emphasis on the tree depth highlights the importance of consecutive pairs of internal branches. Before proving the theorem, I recall some notation and some four-taxon results from Degnan and Rosenberg (2006). Species tree branch lengths are measured in units of coalescent time, where one time unit, in the simplest case of a constant population size of N allelic copies, represents N generations. Consider a four-taxon species tree with topology
, whose root is separated from the node indicating the most recent common ancestor of A, B, and C by branch length
. This latter node is in turn separated from the most recent common ancestor of A and B by branch length
. Degnan and Rosenberg (2006) defined by
,
, and
the probabilities conditional on the species tree that a gene tree has topology
, topology
, and topology
, respectively; topology
also has probability
. Given any choice for
, gene tree topology
has probability greater than all gene tree topologies other than possibly
,
, and
(Rosenberg 2002; Degnan and Rosenberg 2006); the anomaly zone for species tree topology
is therefore the set of values of
for which
or
. Degnan and Rosenberg (2006) noted that
for all allowed
, so that the anomaly zone is the set of
for which
. Using formulas for
,
, and
, and solving the inequalities
and

for
, Degnan and Rosenberg (2006) computed the anomaly zone for
.
Proof of Theorem 1 —
Consider species tree topologies with depth <3. Degnan and Rosenberg (2006) showed by direct computation that these topologies—three-taxon species tree topologies and four-taxon symmetric species tree topologies—do not produce anomalies.
Now consider an arbitrary n-taxon labeled species tree topology ψ with depth at least 3. Either n = 4 and ψ is a four-taxon asymmetric species tree topology already shown to have AGTs by the direct computation of Degnan and Rosenberg (2006) or
. For
, ψ must have a particular structure (fig. 2). Because ψ has depth 3 or more, it must have a pair of internal branches immediately descended from the root and arranged such that one is immediately ancestral to the other. Denote these branches by ex and ey, with ex ancestral to ey, and denote their lengths by x and y. Denote by A and B the two subtrees of ψ immediately descended from ey and by C the subtree descended from ex but not ey. Let D be the subtree that is immediately descended from the root and that does not contain ex and ey. One or more among A, B, C, and D can be a single leaf.
We make ex and ey short and all branches in subtrees A, B, C, and D long. In particular, we choose lengths x and y such that
. That is, if A, B, C, and D are treated as single taxa rather than subtrees, then we choose x and y to lie in the anomaly zone of
, with AGT
. Choose a constant
, satisfying
(2) We choose the branches in subtrees A, B, C, and D and the branches above their roots to all be long, so that considering all these long branches of the species tree, the joint probability that only one lineage remains at the top of each long branch equals
. This choice can be made because under the coalescent, as a species tree branch length approaches infinity, the probability approaches 1 that all gene lineages on the branch coalesce on the branch. Consequently, each of a finite set of branches can be chosen long enough that simultaneously for all branches in the set, the probability that all gene lineages entering a branch coalesce on the branch approaches 1.
Define two labeled topologies, L1, the topology of the species tree
, and L2, the topology
, again treating A, B, C, and D as subtrees. The probability q1 that the gene tree has the matching topology L1 is bounded above by
. The first term represents the probability
of producing topology L1 conditional on all coalescences elsewhere other than on branches ex and ey occurring on their most recent allowed branches, weighted by the probability
that all coalescences other than on branches ex and ey indeed occur on their most recent allowed branches. The second term is the probability that one or more of these coalescences does not occur on the most recent branch, weighted by 1, an upper bound on the probability that the gene tree has topology L1 conditional on one or more of the coalescences not occurring on the most recent branch.
The probability q2 that the gene tree has non-matching topology L2 is bounded below by
. This quantity is the probability
of producing topology L2 conditional on all coalescences other than those on branches ex and ey occurring on the most recent allowed branches, weighted by the probability
that all these coalescences do indeed occur on their most recent branches. Applying equation (2),
, and the non-matching gene tree topology L2 has greater probability than the matching gene tree topology L1.
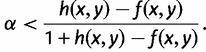
Fig. 2.
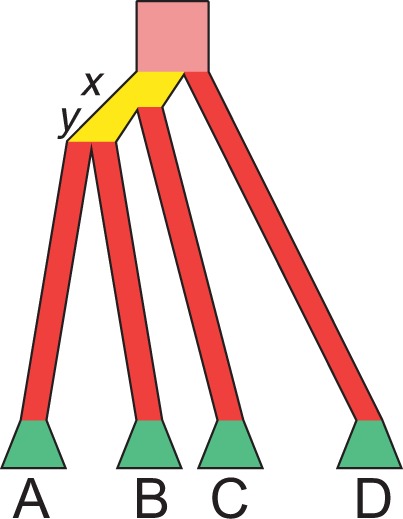
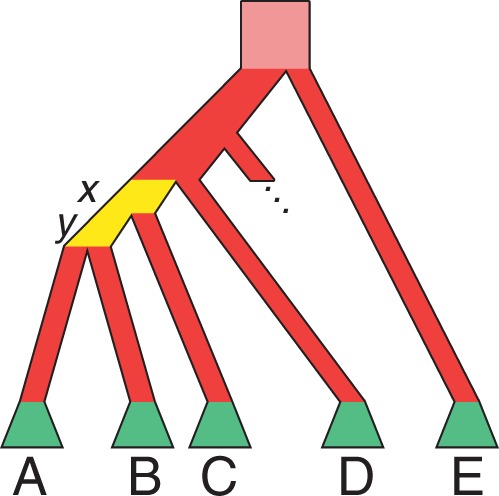
Schematic of the alternative proof. Consider  taxa, with one gene lineage sampled per taxon. Consider a species tree topology that has at least two consecutive internal branches. Such a topology must have the structure shown, where labels A, B, C, and D represent subtrees (Degnan 2013b, Lemma 3). The consecutive branches shown in yellow, with lengths x and y, are set to be short; red branches are set to be long (including the pink branch that extends infinitely far above the root). The green trapezoids indicate that all branches in subtrees A, B, C, and D are set to be long, so that all coalescences in these subtrees are likely to occur at the first opportunity.
Note that in the proof, we used the fact that in the four-taxon case, gene tree topology 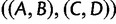 , with probability
  , is anomalous for species tree topology
  . We could just as well have used the fact that gene tree topologies
  and
and  , each with probability
  , are also anomalous. The proof would then have proceeded with
  in place of
  , and with
  or
or  as the AGT in place of
  .
.
An additional assumption in the proof was that the branch ex was immediately descended from the root. If ψ has depth >3, then the proof proceeds analogously when any pair of consecutive internal branches is examined; thus, consecutive short branches need not be descended immediately from the root in order to give rise to AGTs. Consider figure 3, which differs from figure 2 in the choice of the consecutive internal branches ex and ey; as in figure 2, the set of branches chosen to be long contains all branches other than ex and ey. We still choose branch lengths such that the joint probability that for all long branches, coalescences occur on the first possible branch, is  . The topology L1 of the matching gene tree is
  , and the topology L2 of the AGT is
  . The probability q1 that the gene tree has matching topology L1 is again bounded above by
 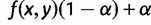 , and the probability q2 that the gene tree has non-matching topology L2 is again bounded below by
 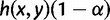 . As before, by equation (2),
  .
.
Fig. 3.
Schematic of the alternative proof, using consecutive internal branches that are not immediately descended from the species tree root. Labels A, B, C, D, and E represent subtrees. The incomplete branch indicates that subtree  can be separated from the root by one or more branches. As in figure 2, the consecutive yellow branches of lengths x and y are set to be short, red branches are set to be long (including the pink branch that extends infinitely far above the root), and green trapezoids indicate that all branches in subtrees A, B, C, D, and E are set to be long, so that all coalescences in these subtrees are likely to occur at the first opportunity.
The main idea of the proof—the use of consecutive short branches with the assumption that branches in and above four subtrees are long—appears in Than and Rosenberg (2011) as a corollary to a proof of the inconsistency of the minimize-deep-coalescences algorithm for species tree inference, and in the discussion by Degnan (2013b) of the unrooted analogue of AGTs, anomalous unrooted gene trees (AUGTs). Degnan (2013b) termed by “caterpillarization” the process of viewing large trees as smaller trees with a caterpillar shape, by grouping the descendants of certain branches such as in figures 2 and 3. Degnan (2013b) also provided terms for topological patterns that can give rise to AGTs and AUGTs, including the “SS” pattern, with two consecutive short internal branches. In the terminology of Degnan (2013b), Theorem 1 states that a labeled species tree produces anomalies if and only if it can be caterpillarized to a four-taxon caterpillar. AGTs are obtained by caterpillarizing the tree and choosing branch lengths with an SS pattern.
The formulation here of the result that any species tree topology with depth three or greater produces anomalies, in addition to simplifying the proof, has the advantage of providing new insight into how AGTs are generated. Although general formulas and software for evaluating gene tree probabilities are now available (Degnan and Salter 2005; Than et al. 2008; Wu 2012), it has been less clear how to intuitively diagnose features of species trees that are likely to give rise to such significant discordance. Short branches have been recognized as key to gene tree discordance, but for five taxa, Rosenberg and Tao (2008) found that certain combinations of short branches did not necessarily produce AGTs. The proof here establishes that production of AGTs primarily reflects consecutive short branches: rapid speciation on the same species lineage is likely to generate AGTs, with at least two speciations being required. Indeed, it was the consideration here of a single scenario with consecutive short branches that streamlined the earlier proof based on a series of cases that were less obviously connected to a unified mathematical or biological feature of the species tree.
We can see an example of the value of the new formulation and proof by reexamining the five-taxon anomaly zones of Rosenberg and Tao (2008). Consider a five-taxon labeled caterpillar tree ψ, whose internal branches, arranged from the root toward the leaves, have lengths x, y, and z, respectively (fig. 4A). Rosenberg and Tao (2008) computed the anomaly zone for ψ, the set of values of  for which the most likely gene tree topology disagrees with ψ. Figure 4B, C, and D show three views of the three-dimensional anomaly zone, one for each pair of variables in
  . In figure 4B, consecutive branch lengths x and y are plotted on the axes, and the contours represent values of z; in figure 4C, consecutive branch lengths y and z appear on the axes, with the contours showing x; finally, in figure 4D, the axes plot nonconsecutive branch lengths x and z, and the contours show values of y. Each axis in each of the panels illustrates the same range of values, from 0 to 2.4. Recall that 1 time unit represents N generations; values substantially less than 1 unit typically represent the level of divergence for populations within a species or, often, for closely related species.
Fig. 4.
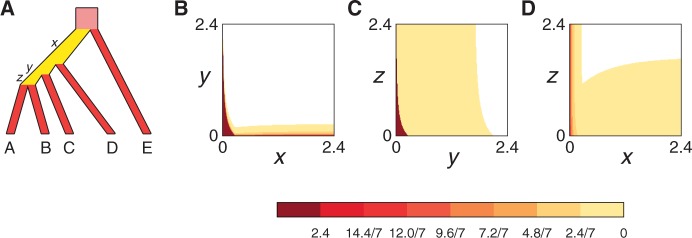
An example of the role of consecutive branches in production of AGTs. (A) A five-taxon caterpillar labeled topology ψ with internal branches of length x, y, and z. (B–D) Sections of the anomaly zone. In each panel, for two of the three variables x, y, and z, a point is shaded according to the largest value of the third variable for which AGTs occur. The color bar indicates the values of this third variable, with the darkest shade corresponding to a value ≥2.4. At some points, AGTs can occur when this variable is arbitrarily large. The figure was constructed by evaluating the equations in supplementary tables 16–18 of Rosenberg and Tao (2008) at a grid of points with 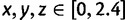 , each examined at intervals of 0.012.
In figure 4B, when consecutive branch lengths x and y are small, the third branch z can be relatively large while still giving rise to AGTs. Similarly, in figure 4C, AGTs can be produced for relatively large x when consecutive branch lengths y and z are both small. For the nonconsecutive branch lengths x and z in figure 4D, however, except in a narrow sliver of the space with tiny values of x, production of AGTs requires a small value of the middle branch length y. A pair of consecutive small branch lengths—either x and y or y and z—enables larger values of the third branch length in the anomaly zone than does a pair of small values for the nonconsecutive branch lengths x and z. Viewed from another perspective, if branch length x is large, then AGTs can be produced when y and z are both small (fig. 4C). If z is large, then AGTs can be produced when x and y are both small (fig. 4B). However, if y is large, then the region for x and z that produces AGTs is much smaller than in the other two cases (fig. 4D). Thus, an understanding of the role of consecutive branches in AGT production clarifies the interpretation of the five-taxon anomaly zone.
To date, investigations of AGTs have focused on theoretical and numerical evaluations of situations in which they and their analogs occur (Degnan and Rosenberg 2006; Rosenberg and Tao 2008; Degnan et al. 2009; Rosenberg and Degnan 2010; Than and Rosenberg 2011; Wang and Degnan 2011; Degnan et al. 2012a, 2012b; Degnan 2013b), demonstrations that certain methods can in theory consistently infer species trees in the anomaly zone (Steel and Rodrigo 2008; Degnan et al. 2009; Liu et al. 2009; DeGiorgio and Degnan 2010; Liu, Yu, and Edwards 2010; Liu, Yu, and Pearl 2010; Mossel and Roch 2010; Liu and Yu 2011; Wang and Degnan 2011; Jewett and Rosenberg 2012; Allman et al. 2013), and simulation-based assessments of the performance of particular species tree methods at parameter settings that produce AGTs (Kubatko and Degnan 2007; Ewing et al. 2008; Huang and Knowles 2009; Liu and Edwards 2009; Liu et al. 2009; DeGiorgio and Degnan 2010; Hird et al. 2010; Liu, Yu, and Edwards 2010; Liu, Yu, and Pearl 2010; O’Meara 2010; Wang and Degnan 2011; Helmkamp et al. 2012; Jewett and Rosenberg 2012; Sánchez-Gracia and Castresana 2012; Degnan 2013a). AGTs represent the basis for inconsistency of the “democratic vote” method for species tree inference, in which the most commonly observed gene tree is taken as an estimate of the species tree; many other methods, including concatenation (Kubatko and Degnan 2007), greedy consensus (Degnan et al. 2009), matrix representation with parsimony (Wang and Degnan 2011), and the minimize-deep-coalescences algorithm (Than and Rosenberg 2011), have analogous regions of the parameter space in which species tree estimates converge on incorrect estimates as increasingly large numbers of gene trees are accumulated. By simplifying our understanding of the anomaly zone, the current work provides guidance for studies of the consistency of species tree inference: the most challenging regions of branch-length space, in which species trees are most likely to be predisposed to producing AGTs, are those regions with one or more pairs of consecutive short branches. Simulation studies to date, which have typically examined a small number of model trees with relatively few taxa, have not had a particular focus on the difficulty of complex cases with multiple pairs of consecutive short branches; the formulation and proof here indicate that it is in such cases that new analyses can offer the most complete tests of the robustness of species tree inference methods to the presence of gene tree discordance.
Acknowledgments
The author thanks P. Jung for helpful conversations and E. Jewett for comments on an earlier version of the manuscript. This work was supported by NSF grant DBI-1146722 and by a grant from the Burroughs Wellcome Fund.
References
- Allman ES, Degnan JH, Rhodes JA. Species tree inference by the STAR method and its generalizations. J Comput Biol. 2013;20:50–61. doi: 10.1089/cmb.2012.0101. [DOI] [PubMed] [Google Scholar]
- DeGiorgio M, Degnan JH. Fast and consistent estimation of species trees using supermatrix rooted triples. Mol Biol Evol. 2010;27:552–569. doi: 10.1093/molbev/msp250. [DOI] [PMC free article] [PubMed] [Google Scholar]
- Degnan JH. Evaluating variations on the STAR algorithm for relative efficiency and sample sizes needed to reconstruct species trees. Pac Symp Biocomput. 2013a;18:262–272. [PubMed] [Google Scholar]
- Degnan JH. Anomalous unrooted gene trees. Syst Biol. 2013b;62:574–590. doi: 10.1093/sysbio/syt023. [DOI] [PubMed] [Google Scholar]
- Degnan JH, DeGiorgio M, Bryant D, Rosenberg NA. Properties of consensus methods for inferring species trees from gene trees. Syst Biol. 2009;58:35–54. doi: 10.1093/sysbio/syp008. [DOI] [PMC free article] [PubMed] [Google Scholar]
- Degnan JH, Rosenberg NA. Discordance of species trees with their most likely gene trees. PLoS Genet. 2006;2:762–768. doi: 10.1371/journal.pgen.0020068. [DOI] [PMC free article] [PubMed] [Google Scholar]
- Degnan JH, Rosenberg NA, Stadler T. The probability distribution of ranked gene trees on a species tree. Math Biosci. 2012a;235:45–55. doi: 10.1016/j.mbs.2011.10.006. [DOI] [PubMed] [Google Scholar]
- Degnan JH, Rosenberg NA, Stadler T. A characterization of the set of species trees that produce anomalous ranked gene trees. IEEE/ACM Trans Comp Biol Bioinform. 2012b;9:1558–1568. doi: 10.1109/TCBB.2012.110. [DOI] [PubMed] [Google Scholar]
- Degnan JH, Salter LA. Gene tree distributions under the coalescent process. Evolution. 2005;59:24–37. [PubMed] [Google Scholar]
- Ewing GB, Ebersberger I, Schmidt HA, von Haeseler A. Rooted triple consensus and anomalous gene trees. BMC Evol Biol. 2008;8:118. doi: 10.1186/1471-2148-8-118. [DOI] [PMC free article] [PubMed] [Google Scholar]
- Harding EF. The probabilities of rooted tree-shapes generated by random bifurcation. Adv Appl Prob. 1971;3:44–77. [Google Scholar]
- Helmkamp LJ, Jewett EM, Rosenberg NA. Improvements to a class of distance matrix methods for inferring species trees from gene trees. J Comput Biol. 2012;19:632–649. doi: 10.1089/cmb.2012.0042. [DOI] [PMC free article] [PubMed] [Google Scholar]
- Hird S, Kubatko L, Carstens B. Rapid and accurate species tree estimation for phylogeographic investigations using replicated sampling. Mol Phylogenet Evol. 2010;57:888–898. doi: 10.1016/j.ympev.2010.08.006. [DOI] [PubMed] [Google Scholar]
- Huang H, Knowles LL. What is the danger of the anomaly zone for empirical phylogenetics? Syst Biol. 2009;58:527–536. doi: 10.1093/sysbio/syp047. [DOI] [PubMed] [Google Scholar]
- Jewett EM, Rosenberg NA. iGLASS: an improvement to the GLASS method for estimating species trees from gene trees. J Comput Biol. 2012;19:293–315. doi: 10.1089/cmb.2011.0231. [DOI] [PMC free article] [PubMed] [Google Scholar]
- Kubatko LS, Degnan JH. Inconsistency of phylogenetic estimates from concatenated data under coalescence. Syst Biol. 2007;56:17–24. doi: 10.1080/10635150601146041. [DOI] [PubMed] [Google Scholar]
- Liu L, Edwards SV. Phylogenetic analysis in the anomaly zone. Syst Biol. 2009;58:452–460. doi: 10.1093/sysbio/syp034. [DOI] [PubMed] [Google Scholar]
- Liu L, Yu L. Estimating species trees from unrooted gene trees. Syst Biol. 2011;60:661–667. doi: 10.1093/sysbio/syr027. [DOI] [PubMed] [Google Scholar]
- Liu L, Yu L, Edwards SV. A maximum pseudo-likelihood approach for estimating species trees under the coalescent model. BMC Evol Biol. 2010;10:302. doi: 10.1186/1471-2148-10-302. [DOI] [PMC free article] [PubMed] [Google Scholar]
- Liu L, Yu L, Pearl DK. Maximum tree: a consistent estimator of the species tree. J Math Biol. 2010;60:95–106. doi: 10.1007/s00285-009-0260-0. [DOI] [PubMed] [Google Scholar]
- Liu L, Yu L, Pearl DK, Edwards SV. Estimating species phylogenies using coalescence times among sequences. Syst Biol. 2009;58:468–477. doi: 10.1093/sysbio/syp031. [DOI] [PubMed] [Google Scholar]
- Mossel E, Roch S. Incomplete lineage sorting: consistent phylogeny estimation from multiple loci. IEEE/ACM Trans Comp Biol Bioinform. 2010;7:166–171. doi: 10.1109/TCBB.2008.66. [DOI] [PubMed] [Google Scholar]
- O’Meara BC. New heuristic methods for joint species delimitation and species tree inference. Syst Biol. 2010;59:59–73. doi: 10.1093/sysbio/syp077. [DOI] [PMC free article] [PubMed] [Google Scholar]
- Rosenberg NA. The probability of topological concordance of gene trees and species trees. Theor Pop Biol. 2002;61:225–247. doi: 10.1006/tpbi.2001.1568. [DOI] [PubMed] [Google Scholar]
- Rosenberg NA, Degnan JH. Coalescent histories for discordant gene trees and species trees. Theor Pop Biol. 2010;77:145–151. doi: 10.1016/j.tpb.2009.12.004. [DOI] [PubMed] [Google Scholar]
- Rosenberg NA, Tao R. Discordance of species trees with their most likely gene trees: the case of five taxa. Syst Biol. 2008;57:131–140. doi: 10.1080/10635150801905535. [DOI] [PubMed] [Google Scholar]
- Sánchez-Gracia A, Castresana J. Impact of deep coalescence on the reliability of species tree inference from different types of DNA markers in mammals. PLoS One. 2012;7:e30239. doi: 10.1371/journal.pone.0030239. [DOI] [PMC free article] [PubMed] [Google Scholar]
- Steel M, Rodrigo A. Maximum likelihood supertrees. Syst Biol. 2008;57:243–250. doi: 10.1080/10635150802033014. [DOI] [PubMed] [Google Scholar]
- Than C, Ruths D, Nakhleh L. PhyloNet: a software package for analyzing and reconstructing reticulate evolutionary relationships. BMC Bioinformatics. 2008;9:322. doi: 10.1186/1471-2105-9-322. [DOI] [PMC free article] [PubMed] [Google Scholar]
- Than CV, Rosenberg NA. Consistency properties of species tree inference by minimizing deep coalescences. J Comput Biol. 2011;18:1–15. doi: 10.1089/cmb.2010.0102. [DOI] [PubMed] [Google Scholar]
- Wang Y, Degnan JH. Performance of matrix representation with parsimony for inferring species from gene trees. Stat Appl Genet Mol Biol. 2011;10:21. [Google Scholar]
- Wu Y. Coalescent-based species tree inference from gene tree topologies under incomplete lineage sorting by maximum likelihood. Evolution. 2012;66:763–775. doi: 10.1111/j.1558-5646.2011.01476.x. [DOI] [PubMed] [Google Scholar]