Abstract
Glutathione (GSH) is transported into renal mitochondria by the dicarboxylate (DIC; Slc25a10) and 2-oxo-glutarate carriers (OGC; Slc25a11). To determine whether these carriers function similarly in liver mitochondria, we assessed the effect of competition with specific substrates or inhibitors on GSH uptake in isolated rat liver mitochondria. GSH uptake was uniphasic, independent of ATP hydrolysis, and exhibited Km and Vmax values of 4.08 mM and 3.06 nmol/min per mg protein, respectively. Incubation with butylmalonate and phenylsuccinate inhibited GSH uptake by 45–50%, although the individual inhibitors had no effect, suggesting in rat liver mitochondria, the DIC and OGC are only partially responsible for GSH uptake. H4IIE cells, a rat hepatoma cell line, were stably transfected with the cDNA for the OGC, and exhibited increased uptake of GSH and 2-oxoglutarate and were protected from cytotoxicity induced by H2O2, methyl vinyl ketone, or cisplatin, demonstrating the protective function of increased mitochondrial GSH transport in the liver.
Keywords: Glutathione, Dicarboxylates, Transport, Liver, Mitochondria, Hepatoma cells, Oxidative stress
Glutathione (GSH)1 is an important antioxidant and cofactor in numerous drug metabolism reactions. In isolated hepatocytes, approximately 80% of total cellular GSH is in the cytoplasm whereas 10–15% is in the mitochondria [1]. Mitochondrial GSH is critical to defense against reactive oxygen species and maintains sulfhydryl groups of mitochondrial proteins in the reduced state. There are no enzymes to synthesize GSH in mitochondria [2,3]. Rather, GSH must be transported from cytoplasm into mitochondria. Due to the almost equal concentration of GSH in the cytoplasmic and mitochondrial pools and the anionic property of GSH at physiological pH, it has been presumed that a GSH carrier(s) exist(s) in the inner membrane of mitochondria. By using substrates and specific inhibitors for known anion transporters of mitochondria isolated from rat and rabbit kidneys, our previous work demonstrated that the dicarboxylate carrier (DIC; Slc25a10) and the 2-oxoglutarate carrier (OGC; Slc25a11) are responsible for uptake of GSH from the cytoplasm into the mitochondrial matrix [3–5]. Overexpression of either of these two carriers in a rat proximal tubular cell line (NRK-52E cells) markedly enhances accumulation of GSH in mitochondria and protects the cells from chemically induced apoptosis [6,7]. GSH is also an important antioxidant in mitochondria for defense against oxidative stress induced by tumor necrosis factor (TNF) and alcohol [8]. Fernandez-Checa used the cDNA sequence from rat brain mitochondria and overexpressed the OGC in oocytes and found that these oocytes increased GSH uptake [9]. These data support a significant role for both the DIC and OGC in mitochondrial GSH transport.
In amplifying the cDNA of mitochondrial OGC using total rat kidney RNA as a template [7], we discovered that the sequence of our PCR product exhibited significant differences from that of rat heart and brain mitochondrial OGC, which are the only two rat tissues from which the mitochondrial OGC cDNA sequence is available in either the literature or in GenBank™ (Table 1). Sequencing of the kidney OGC was repeated 10 times with identical results, suggesting that the differences were not due to errors introduced from the PCR amplification. Nucleotide differences were observed for 6 bp between kidney and heart and for 10 bp between kidney and brain. Amino acid differences include 2 residues between kidney and heart and 6 residues between kidney and brain. While neither of the 2 amino acid differences between kidney and heart OGC are in predicted transmembrane domains (TMDs) and both are substitutions of amino acids that are similar in terms of charge and polarity (T for A and T for I), 2 of the amino acid differences between kidney and brain OGC are in predicted TMDs (TMD2 and TMD3) and one difference is very close to TMD1. Two of these differences are amino acids that differ by charge or polarity (K for N and T for P) and should have a significant effect on protein structure and function. There is uncertainty about the identity of transporters for 2-oxoglutarate (2-OG) and GSH in rat liver. Although rat liver OGC may have a high degree of homology with rat brain OGC [9], its sequence has not been reported. A thorough search of the GenBank™ database and the published literature, however, failed to find any cDNA or amino acid sequences for the OGC from rat liver mitochondria. Fiermonte et al. [10] reported cloning and expression of a rat liver oxodicarboxylate carrier (ODC) that transports 2-OG and other C5–C7 dicarboxylates. They isolated a 1456-bp cDNA with a 99-bp 5′-untranslated region, an open reading frame of 897 bp, and a 460-bp 3′-untranslated region. The cDNA encodes a polypeptide of 298 amino acids with a molecular mass of 33,276, which contrasts with the OGC from rat kidney, heart, and brain mitochondria, which are all 314 amino acids in length. The relationship between the rat liver ODC and OGC is unclear. Clearly, further investigation is needed to establish the role of the OGC and ODC in rat liver, to determine the significance of the OGC sequence variants in relation to kidney and liver GSH transport, and to assess the functional implications of these sequence differences for mitochondrial GSH transport.
Table 1.
Tissue-specific differences in nucleotide and amino acid sequences of rat OGC
| Tissue/accession numbers |
Nucleotide sequences | Amino acid sequences |
|---|---|---|
| vs. Rat heart OGC GenBank™ Accession Nos.: DNA: X80075 Protein: 2116232A | Identity: 958/964 (99.4%) a28–g48; c129–a149; c145–t165; c227–t247; t228–c248; t600–c620. | Identity: 312/314 (99.4%) T3-A3; T69-I69. |
| vs. Rat brain OGC GenBank™ Accession Nos.: DNA: NM_022398, U84727 (source); Protein: AAB41797, NP_071793 | Identity: 934/943 (99.0%) a28-g7; g160-n139; a182-g161; c189-t168; a433-c412; t600-c579; g698-t677; g785-a764; g958-a937. | Identity: 308/314 (98.1%) T3-A3; K46-N46; T138-P138; S226-I226; G255-E255; G313-S313. |
| vs. Rat liver ODCa GenBank™ Accession Nos.: DNA: NM_133614b; Protein: NP_598298b | Identity: no significant homologies. | Identity: 72/266c (27.1%) |
The published nucleotide and amino acid sequences from the heart, brain, and liver of the rat are compared with those of the rat kidney that we obtained [7]. Sequences were aligned using BLAST.
ODC, oxodicarboxylate carrier.
The carrier cDNA with Accession No. NM_133614 is listed in GenBank™ as the rat liver mitochondrial oxodicarboxylate carrier. It is described in the original reference [10] as an exchanger that transports 2-OG as well as several other C5–C7 dicarboxylates. mRNA for the carrier was detected by RT-PCR in mitochondria of rat liver, kidney, heart, lung, spleen, testes, skeletal muscle, and brain. The protein was detected by immunodetection in mitochondria of rat heart, kidney, liver, lung, spleen, and brain. Its identity and functional relationship with the OGC, however, is unknown.
Comparison was made between 266 of the 298 amino acid residues of the ODC and that of the kidney OGC.
Hepatocytes are the primary source of plasma and other pools of extrahepatic GSH, as these cells have carriers on the sinusoidal and canalicular plasma membranes that mediate efflux of GSH. Liver mitochondrial GSH transport showed high-affinity and low-affinity components, and both were inhibited by glutamate [11]. By injection of rat liver mRNA into oocytes, Garcia-Ruiz et al. [12] concluded that the hepatic mitochondrial GSH carrier was different from the sinusoidal and canalicular transporters for reduced GSH.
The tissue-specific variations in cDNA and amino acid sequences for the OGC led to our present study. Here, we determined the kinetics of GSH transport in rat liver mitochondria and assessed inhibition of GSH transport by specific inhibitors or substrates of mitochondrial anion carriers. We then stably transfected the OGC cDNA (GenBank™ Accession No. NM_022398) in a rat hepatoma cell line, H4IIE cells, compared GSH transport in mitochondria isolated from wild-type H4IIE cells and H4IIE cells overexpressing the OGC, and assessed the ability of enhanced OGC activity to protect cells from three oxidants, H2O2, cisplatin, and methyl vinyl ketone (MVK). A combination of the DIC and OGC inhibitors butylmalonate and phenylsuccinate decreased GSH uptake by only 45–50% in rat liver mitochondria, suggesting that other carriers also contribute to hepatic mitochondrial GSH uptake. Overexpression of OGC protected cells from oxidant-induced toxicity and increased GSH uptake in mitochondria isolated from H4IIE cells. Our results provide further evidence that GSH transport differs in mitochondria from rat liver and kidney and that the DIC and OGC only partially determine transport of GSH in rat liver mitochondria.
Materials and methods
Materials
GSH, iodoacetic acid, 1-fluoro-2, 4-dinitrobenzene, antimycin A (AA), phosphoenolpyruvate (PEP), oligomycin, and atractyloside were purchased from Sigma Chemical Co. (St. Louis, MO). Phenylsuccinate and butylmalonate were purchased from Aldrich Chemical Co. (Milwaukee, WI). L-[3H-Glycyl]-GSH (44.8 Ci/mmol) and [14C]-2-OG (281 mCi/mmol) was purchased from DuPont NEN (Boston, MA).
Preparation of mitochondria
Male Sprague–Dawley rats (175–225 g) were purchased from Harlan (Indianapolis, IN). Rats were housed in cages in the Wayne State University vivarium with a 12-h light–dark cycle, given food and water ad libitum, and anesthetized with an i.p. injection of sodium pentobarbital (50 mg/kg body weight). After removal from the abdomen, rat livers were immediately placed in ice-cold buffer and rats were killed by bilateral pneumothorax and exsanguination. The mitochondrial isolation buffer consisted of 20 mM triethanolamine/HCl, pH 7.4, 225 mM sucrose, 3 mM potassium phosphate (pH 7.4), 5 mM MgCl2, 20 mM KCl, and 0.1 mM phenylmethylsulfonyl fluoride to inhibit proteolysis. EGTA (2 mM) was included in the buffer at all preparatory stages, except the final resuspension, to remove calcium ions. Liver was sliced into small pieces and was homogenized with a hand-held Dounce homogenizer. Mitochondria from homogenates of rat liver were isolated by differential centrifugation, as described previously [13].
Measurement of GSH uptake in isolated rat liver mitochondria
Aliquots (0.5 ml) at each time point during incubations with different concentrations of GSH were placed in 1.5-ml polyethylene microcentrifuge tubes and were centrifuged at 13,000g for 30 s. After removal of supernatants, pellets were resuspended and centrifuged twice with 0.5 ml ice-cold buffer. The final pellets were resuspended in 10% (v/v) perchloric acid to release mitochondrial matrix contents. GSH levels were determined by HPLC (see below).
Calculation of initial rate of GSH uptake
Uptake rates were calculated by linear curve-fitting as described previously [4], plotting In(Ptotal/(Ptotal − Pt) versus time. Ptotal represents the total uptake of substrate at equilibrium (estimated by exponential decay curve-fitting of time course data) and Pt represents substrate uptake at time t (0–5 min). The initial rates of uptake were then determined from the first-order rate equation ν = k(Ptotal).
Culture of H4IIE cells
H4IIE cells (ATCC, Manassas, VA; catalogue no. CRL-1548) were cultured on collagen-coated, polystyrene T-25, T-75, or T-175 culture flasks with minimum essential Eagle’s medium containing 10% (v/v) bovine calf serum in an atmosphere of 5% CO2, 95% air at 37 °C.
Stable transfection of H4IIE cells with cDNA of rat kidney OGC
cDNA of the OGC from rat heart mitochondria (GenBank™ Accession No. NM_022398) [14] was amplified by RT-PCR. Primers were as follows. Upper primer: 5′-GCC GAG GGC CAT CAA GGG AGG ATT-3′; lower primer: 5′-ACT TGG AAA CCC TGG CAC ACG AGT CTC A-3′. The PCR product was confirmed by automated DNA sequencing and ligated into a T–A cloning vector (pGEM-T Easy). The plasmid OGC cDNA was purified, following amplification in Escherichia coli, using the Promega Wizard Prep purification kit. cDNA of OGC was subcloned into the pcDNA3.1/V5-His TOPO vector and stably transfected into the H4IIE cells with FuGENE 6 from Roche Applied Science (Indianapolis, IN). Transfections were carried out using a 3:1 ratio of FuGENE 6 reagent to plasmid DNA. Stable transfections were selected with 0.6 mg Geneticin (G418)/ml.
Confocal microscopy
Wild-type (H4IIE-WT) and OGC-overexpressing (H4IIE-OGC) cells were seeded on 35-mm dishes the day before acquisition of confocal images. The cells were grown to 50% confluence. The medium was replaced with 100 nM Mito-Tracker® Orange CMTMRos (Invitrogen) dissolved in 10% serum-containing medium and cells were incubated for 30 min. Cells were then washed twice with fresh medium containing 10% serum, were fixed with 3.7% formaldehyde diluted in medium containing 10% serum for 30 min at room temperature, and were permeabilized with 0.2% Triton X-100 for 5 min. Cells were then blocked with 10% fetal bovine serum diluted in PBS for 20 min, washed twice with PBS, and then incubated with anti-V5 antibody conjugated with fluorescein isothiocyanate (FITC; 1:500) diluted in 10% bovine fetal serum for 1 h at room temperature in the dark. After washing twice with PBS, cells were then incubated with 1.9 µM DAPI (4,6-diamidino-2-phenylindole dihydrochloride) for 20 min, and then washed twice with PBS. Cells were viewed with a Zeiss LSM 510 Confocal Microscope.
Isolation of mitochondria from H4IIE cells and transport measurements
A total of 8 to 12 T-175 flasks of confluent cells were harvested and homogenized by 8 strokes with a hand-held Dounce homogenizer. Homogenates were centrifuged by differential centrifugation and mitochondria were resuspended in isolation buffer without EGTA at a concentration of 1 mg protein/ml [13]. Mitochondria were incubated with either 5 mM GSH containing 3H-GSH or 1 mM 2-OG containing 14C-2-OG for 2 min, then centrifuged at 13,000g for 30 s, washed with isolation buffer, and centrifuged twice for 30 s. Mitochondria were transferred to scintillation vials, scintillation fluid added, and radioactivity counts measured in a Beckman LS 6000 IC scintillation counter.
Western blot analysis
Protein from H4IIE-WT cells and H4IIE-OGC cells and their mitochondria were loaded into 12% polyacrylamide gels and separation was achieved as described previously [7]. The proteins were then transferred to nitrocellulose membranes (MSI, Westborough, MA). The membranes were blocked with 5% milk, washed with Tris-buffered saline containing Tween 20 (TTBS), and probed either with a monoclonal anti-V5 antibody conjugated with alkaline phosphatase (Invitrogen) 1:2000 dilution for 2 h or anti-actin (Sigma) 1:1000 dilution for 1 h. The membranes were washed three times with TTBS. Secondary antibody for actin was anti-rabbit conjugated with alkaline phosphatase (Invitrogen) 1:4000 dilution. Immunoreactive bands were visualized following incubation with a solution containing 5-bromo-4-chloro-3-indolyl-phosphate/nitro blue tetrazolium (Promega).
LDH release measurement
H4IIE-WT and H4IIE-OGC cells were treated with different concentrations of H2O2, cisplatin (CisPt) or methyl vinyl ketone (MVK) for 4, 8, or 24 h. Lactate dehydrogenase (LDH) activities in supernatant and cells were measured spectrophotometrically as NADH oxidation at 340 nm.
MTT cell proliferation assay
H4IIE-WT and H4IIE-OGC cells were seeded in 24-well plates at 1 × 10⁵ cells per ml. Cells were incubated for 24 h until they reached 50% confluence. Cells were then treated with various concentrations of MVK for 6 h or 24 h. MTT [(3-(4,5-dimethylthiaxzol-2-yl)-2,5-diphenyltetrazolium bromide); ATCC, Manassas, VA] was added to treated cells, and cells were incubated for another 2 h. SDS (20% w/v) was added to wells and cells were incubated in the dark for an additional 2 h. Cell proliferation was measured by absorbance at 590 nm in a SpectraMax M2 plate reader.
Flow cytometry analysis of cell cycle status and quantitation of apoptosis
H4IIE-WT and H4IIE-OGC cells were treated with 100 µM or 200 µM MVK for 24 h. The cells were harvested, fixed with ice-cold 75% ethanol, and stained with propidium iodide as described previously [7]. Samples were analyzed by flow cytometry using a Becton–Dickinson FACSCalibur flow cytometer, which is a core facility of the National Institute of Environmental Health Sciences Center for Molecular Toxicology with Human Applications at Wayne State University (Detroit, MI).
Data analysis
All values are means ± SEM of measurements made on the indicated number of separate cell or mitochondrial preparations. Significant differences among means for data were first assessed by a one-way analysis of variance. When significant ‘‘F values” were obtained, the Fisher’s protected least significance t test was performed to determine which means were significantly different from one another, with two-tail probabilities <0.05 considered significant.
Results
Kinetics of GSH uptake
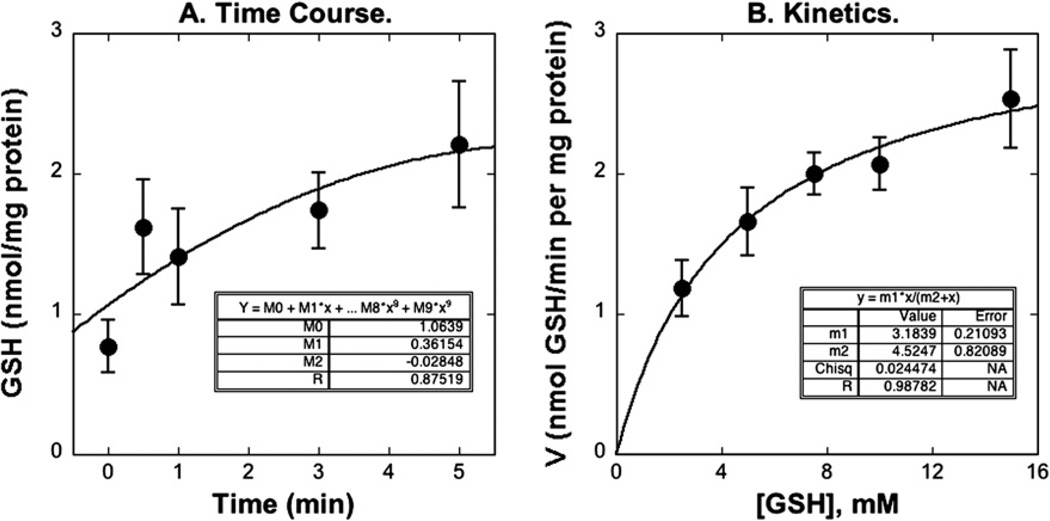
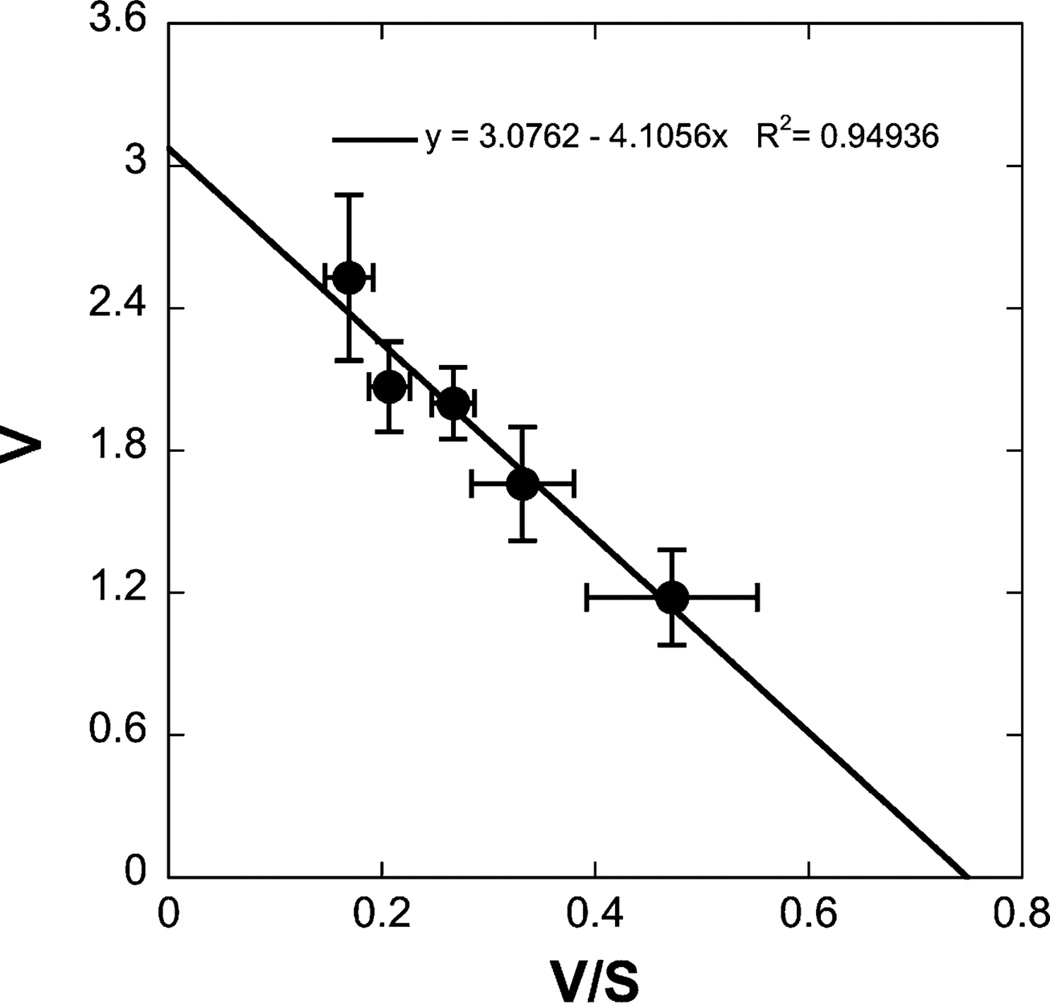
The time course for uptake of 5 mM GSH in liver mitochondria was measured at 25 °C by the centrifugation–resuspension method (Fig. 1A). Initial mitochondrial GSH content was about 0.6 nmol/mg protein. In the presence of 7.5 mM extramitochondrial GSH, the intramitochondrial content of GSH increased rapidly within 5 min to an equilibrium level of 2.2 nmol/mg protein. GSH uptake was concentration dependent (Fig. 1B) and was uniphasic (Fig. 2), exhibiting a Km of 4.08 mM and a Vmax of 3.06 nmol/mg protein per min. Our study showed only a uniphasic uptake with kinetic parameters consistent with a low-affinity, high-capacity process, because the extramitochondrial concentrations of GSH used were from 2.5 mM to 15 mM. Extramitochondrial concentrations <1 mM would be required to observe the high-affinity, low-capacity process [8] and these would not provide sufficient intramitochondrial GSH for the HPLC assay.
Fig. 1.
Time course (A) and concentration dependence (B) of GSH uptake in rat liver mitochondria. (A) Time course of GSH uptake. Mitochondria were incubated with 7.5 mM GSH, at each time point (0, 0.5, 1, 3, 5 min), the content of mitochondrial GSH was determined by HPLC. The line was drawn by a polynomial regression. (B) Concentration dependence of GSH uptake. Mitochondria were incubated with various concentrations of GSH (2.5, 5, 7.5, 10, 15 mM) for 0.5 min. The line was drawn by use of the Michaelis–Menten equation and regression. Values represent means ± SEM (n = 5–8).
Fig. 2.
Kinetics of GSH uptake. Mitochondria were incubated with various concentrations of GSH for several time points up to 5 min. After calculation of initial rates, kinetic parameters were derived from Eadie–Hofstee plots, with the line determined by linear regression. Results are means ± SEM (n = 8).
Role of ATP hydrolysis in GSH uptake
Previous studies showed that GSH uptake was increased by ATP in liver mitochondria [8], but not in kidney mitochondria [2]. If transport of GSH across the mitochondrial inner membrane requires ATP hydrolysis, then inhibitors of either ATP hydrolysis or adenine nucleotide transport should inhibit GSH uptake. In the present study, preincubation with ATP alone increased GSH uptake in liver mitochondria, but ATP in combination with either Complex II inhibitor AA, the ATP synthetase inhibitor oligomycin, or the ATP translocase inhibitor atractyloside, had no effect on GSH uptake (Table 2). Thus, although GSH uptake was accelerated by ATP, it did not require ATP hydrolysis.
Table 2.
Role of ATP hydrolysis in hepatic mitochondrial GSH uptake
| Addition | GSH uptake (nmol/min per mg protein) |
|
|---|---|---|
| − AA | + AA | |
| Buffer | 1.64 ±0.14 | 2.05 ±0.31 |
| +2 mM ATP | 2.79 ± 0.67* | 2.27 ± 0.41 |
| +ATP + Oligomycin (20 µg/ml) | 2.55 ±0.13* | 2.50 ±0.13 |
| +ATP + Atractyloside (20 µM) | 1.93 ±0.23 | 2.61 ±0.15* |
Initial rates of uptake of 7.5 mM GSH in suspensions of isolated mitochondria from rat liver were measured with L-[3H-glycyl]-GSH with the indicated additions and in the absence and presence of 2 µM antimycinA (AA). Measurements are means ± SEM of 5 experiments.
P < 0.05 compared with corresponding control value.
Role of anion carriers in GSH uptake
Our previous study in renal mitochondria suggested that the DIC and OGC were responsible for GSH uptake, that both carriers facilitated the electroneutral exchange of dicarboxylates or inorganic phosphate with GSH through the mitochondrial inner membrane, and that these two carriers could account for nearly all of the carrier-mediated, GSH uptake in renal cortical mitochondria [3,4]. In the present study, the relationship between the uptake of GSH and organic anions in liver mitochondria was assessed by co-incubation with 7.5 mM GSH and 15 mM of a substrate or specific inhibitor of one of the known mitochondrial anion transporters (Table 3). AA was added to inhibit oxygen consumption and substrate metabolism and had no significant influence on GSH transport, as found in renal mitochondria [4]. Substrates for the glutamate, aspartate, tricarboxylate, and monocarboxylate carriers had no effect on GSH uptake. Only the combination of the DIC inhibitor butylmalonate and the OGC inhibitor phenylsuccinate significantly inhibited the uptake of GSH in liver mitochondria by 45–50%. In contrast, incubation with the individual inhibitors had no significant effect on GSH uptake. This difference between kidney and liver suggests that the function of mitochondrial GSH carriers varies between tissues, possibly due to differences between renal and hepatic OGC and due to existence of other GSH carriers in liver mitochondria, such as the ODC.
Table 3.
Substrate specificity of GSH uptake in rat liver mitochondria
| Addition | GSH uptake (nmol/min per mg protein) |
|
|---|---|---|
| − AA | + AA | |
| Buffer | 1.78 ± 0.17 | 1.51 ± 0.17 |
| Dicarboxylate inhibitors | ||
| Butylmalonate | 1.47 ±0.39 | 1.86 ±0.92 |
| Phenylsuccinate | 2.67 ± 2.08 | 3.80 ± 1.56 |
| Butylmalonate + Phenylsuccinate | 0.90 ± 0.38* | 0.81 ±0.21* |
| Glutamate and aspartate | ||
| Glutamate | 1.85 ±0.30 | 1.51 ±0.35 |
| Aspartate | 2.51 ± 1.05 | 1.53 ±0.59 |
| Tricarboxylate substrates | ||
| Phosphoenolpyruvate (PEP) | 1.84 ±0.90 | 2.32 ± 1.34 |
| Citrate | 1.05 ± 0.23 | 2.63 ± 1.46 |
| Monocarboxylate substrates | ||
| Lactate | 1.72 ± 0.65 | 2.14 ± 0.67 |
| Pyruvate | 1.71 ± 0.56 | 2.01 ± 0.43 |
Initial rates of uptake of 7.5 mM GSH in suspensions of isolated mitochondria from rat liver were measured with L-[3H-glycyl]-GSH with the indicated inhibitors (each at 15 mM) in both the absence and presence of 2 µM antimycin A (AA). Measurements are means ± SEM of 3 experiments.
P < 0.05 compared with corresponding control value.
Overexpression of OGC in H4IIE cells
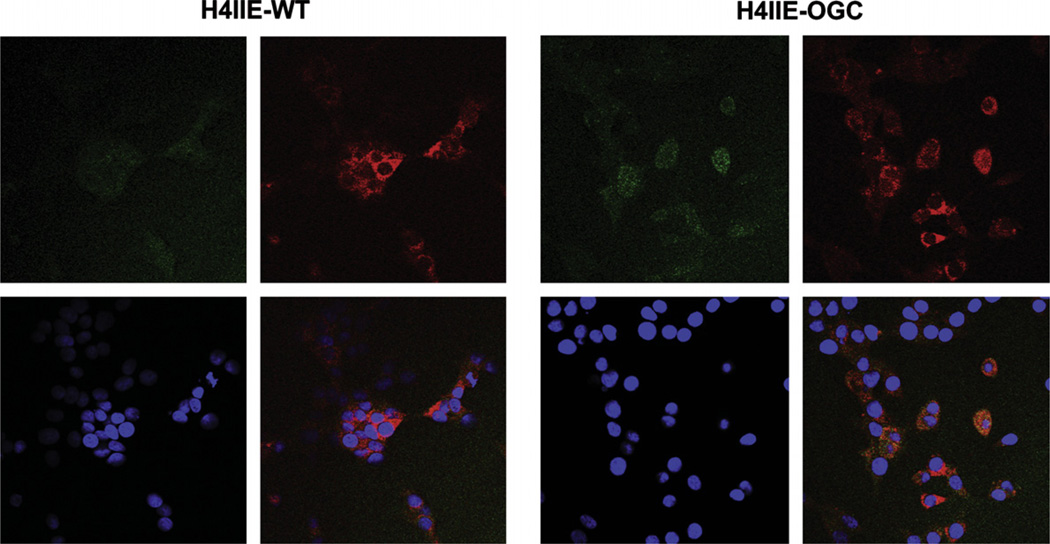
H4IIE cells were stably transfected with OGC, using a vector containing the V5 epitope (Fig. 3). Using an anti-V5 antibody, we found that the OGC protein was overexpressed in cells and mitochondria by Western blot. H4IIE-WT cells exhibited only a small, background reaction with the anti-V5 antibody. Using the anti-V5-FITC antibody and the mitochondrial dye MitoTracker® Orange, we showed that the expressed OGC was localized in mitochondria (Fig. 4). This was demonstrated by overlaying cells stained with anti-V5-FITC and MitoTracker® Orange and showing the appearance of an orange-yellow color (punctate staining) where the OGC and mitochondrial marker co-localize. DAPI staining was also performed to localize nuclei. Of the 43 cells visible in the lower right-hand panel of the H4IIE-OGC cells panel (based on the number of nuclei indicated by DAPI staining), 25 cells showed some degree of orange, punctate fluorescence. This suggests that a majority of the cells overexpressed the protein. None of the H4IIE-WT cells exhibited any orange, punctate fluorescence.
Fig. 3.
Recombinant OGC protein expression in total cell and mitochondrial extracts of H4IIE-WT and H4IIE-OGC cells. OGC protein was detected by Western blot using an anti-V5 antibody in either total cell or mitochondrial extracts.
Fig. 4.
Localization of recombinant OGC in mitochondria. Cells (H4IIE-WT or H4IIE-OGC) were stained with either anti-V5-FITC (green; upper left panel in each grouping), MitoTracker® Orange (orange; upper right panel in each grouping), or DAPI to stain the nucleus (blue; lower left panel in each grouping). An overlay of the three stains is shown in the lower right panel of each grouping. The brighter yellow-orange color indicates co-localization of V5 with the mitochondria. Magnification = 400×.
Overexpression of OGC in H4IIE cells protects cells from toxicants
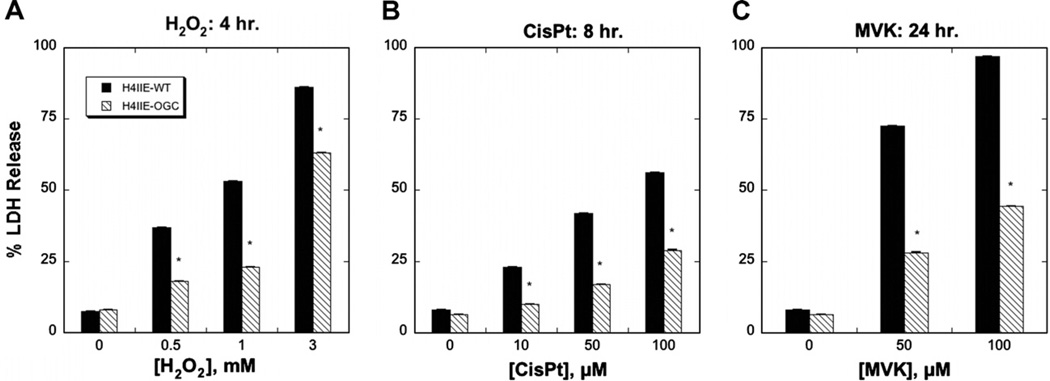
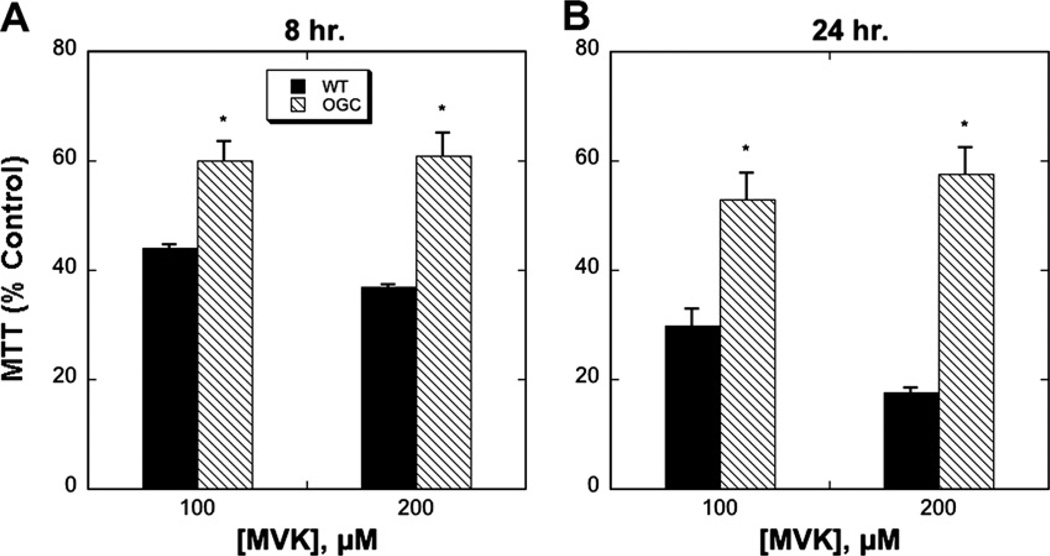
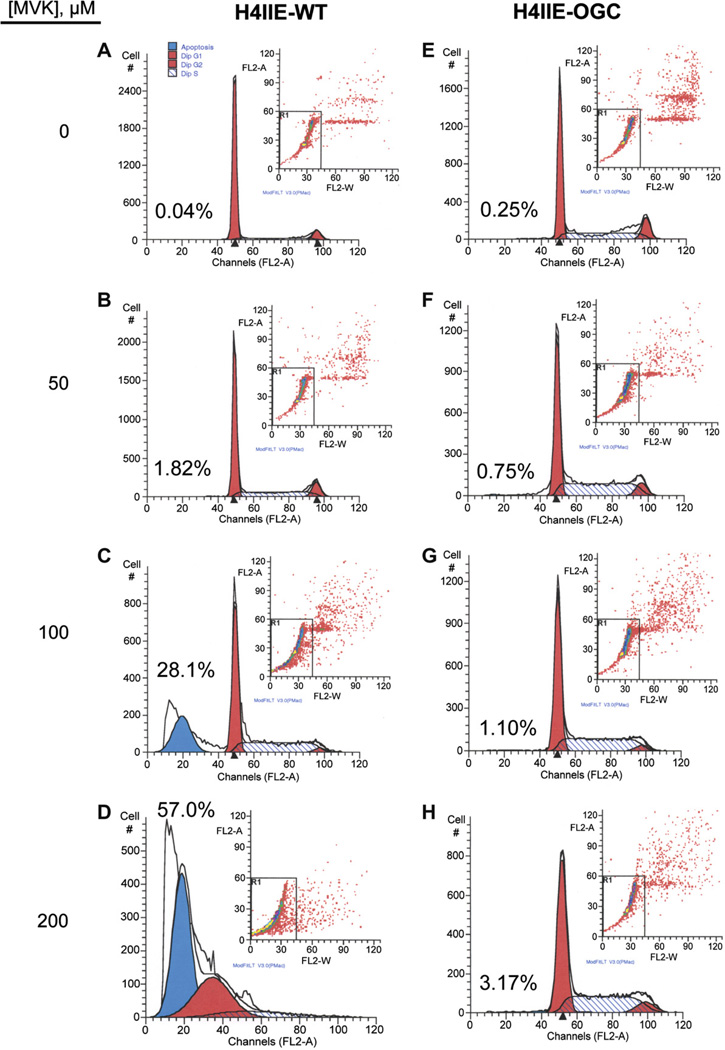
Both H4IIE-WT and H4IIE-OGC cells were treated with different concentrations of H2O2, CisPt or MVK, all of which are known to induce oxidative stress and injury to cells, although by different mechanisms. Whereas H2O2 is a direct oxidant, MVK is both an oxidant and thiol-alkylating agent and CisPt is known to produce DNA damage and cause generation of reactive oxygen species. Cytotoxicity was assessed over a period of up to 24 h by three methods: LDH release (Fig. 5), the MTT assay (Fig. 6), and cell cycle analysis to quantify apoptosis (Fig. 7). Selected LDH release data from incubations with the three toxicants (Fig. 5) show that the H4IIE-OGC cells were significantly less sensitive to injury from each of the three chemicals than the H4IIE-WT cells. Using MVK as the model toxicant, H4IIE-OGC cells also exhibited markedly less cytotoxicity than H4IIE-WT cells by both the MTT cell proliferation assay (Fig. 6) and by cell cycle analysis (Fig. 7). In both cases, a clear concentration dependent cytotoxicity was observed in the H4IIE-OGC cells. Of the three cytotoxicity assays used, the most complete protection was observed when apoptosis was assessed.
Fig. 5.
Protective effect of OGC overexpression in H4IIE cells as assessed by LDH release. H4IIE-WT or H4IIE-OGC cells were incubated with the indicated concentrations of either H2O2 for 4 h (A), CisPt for 8 h (B), or MVK for 24 h (C). Values represent means ± SEM (n = 3) *P < 0.05 compared with corresponding sample from WT cells.
Fig. 6.
Protective effect of OGC overexpression in H4IIE cells as assessed by the MTT assay. H4IIE-WT or H4IIE-OGC cells were incubated with the indicated concentration of MVK for either 8 h (A) or 24 h (B). Values are relative to control cells and represent means ± SEM (n = 3). *P < 0.05 compared with corresponding sample from WT cells.
Fig. 7.
Protective effect of OGC overexpression in H4IIE cells against apoptosis induced by MVK. H4IIE-WT (A–D) or H4IIE-OGC (E–H) cells were incubated with either media (=0), 50 µM, 100 µM, or 200 µM MVK for 24 h. Apoptosis was assessed by staining with propidium iodide and flow cytometry using a Becton–Dickinson FACSCalibur flow cytometer. Peaks from left to right represent apoptotic (sub-G1) cells and cells in G0/G1, G2/M, and S phases. Insets. Distribution of cells according to fluorescence intensity. Cells outside the box were those excluded from analysis due to aggregation. Values above the sub-G1 peak indicate the percentage of apoptotic cells in each sample.
Overexpression of OGC in H4IIE cells increased GSH and 2-OG uptake in mitochondria isolated from H4IIE-WT and H4IIE-OGC cells
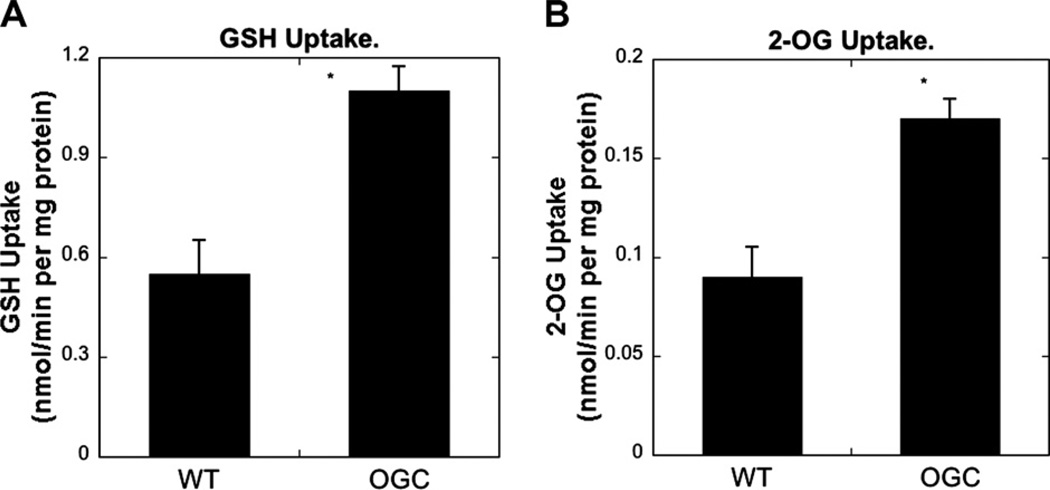
Mitochondria isolated from H4IIE-WT and H4IIE-OGC cells were used to measure GSH or 2-OG uptake by incubation with 5 mM GSH or 1 mM 2-OG (Fig. 8). Overexpression of OGC increased mitochondrial uptake of both GSH and 2-OG by approximately 2-fold, indicating that the protection from oxidant-induced cytotoxicity is associated with increased ability to accumulate GSH.
Fig. 8.
GSH and 2-OG uptake in mitochondria isolated from H4IIE-WT and H4IIE-OGC cells. Mitochondria, isolated from cell suspensions, were incubated with 3H-labeled GSH (5 mM final) or 14C-labeled 2-OG (1 mM final) for 2 min. Uptake was stopped by centrifugation and pellets were washed twice with ice-cold mitochondrial buffer. The final pellets were counted by scintillation spectrometry. Results are means ± SEM of measurements from 3 experiments. *Significantly different (P < 0.05) from the value from WT cells.
Discussion
In the present study, we demonstrate that both the DIC and OGC contribute to, but are not entirely responsible for, the mitochondrial uptake of GSH in rat liver. Unlike our previous findings in rat kidney mitochondria [3,4], where we found that function of these two inner membrane carriers could account for nearly all of the observed uptake of GSH, in hepatic mitochondria the DIC and OGC only appear to account for approximately 50% of the observable transport. We further demonstrated the functional and toxicological significance of hepatic mitochondrial GSH transport by studying the influence of stable overexpression of the OGC in H4IIE cells, a rat hepatoma cell line. H4IIE-OGC cells expressed the recombinant OGC in mitochondria, as demonstrated by fluorescent staining and confocal microscopy, and exhibited increased mitochondrial accumulation of both GSH and 2-OG and markedly diminished sensitivity to cytotoxicity from three model toxicants as compared to H4IIE-WT cells.
Hepatocytes are the primary source of plasma and other pools of extrahepatic GSH, because these cells have carriers on the sinusoidal and canalicular plasma membrane that mediate efflux of GSH. Garcia-Ruiz et al. [12] found that mitochondria isolated from oocytes injected with total rat liver mRNA increased GSH uptake but those from oocytes that were injected with either rat liver sinusoidal GSH transporter (RsGshT) mRNA or rat liver canalicular GSH transporter (RcGshT) mRNA did not. They concluded that the mitochondrial system(s) responsible for GSH transport is (are) distinct from those found in hepatic plasma membranes.
The uptake of GSH into mitochondria was uniphasic in the present study. HPLC analysis was used to detect the GSH content in rat liver mitochondria for each time point after incubation with external GSH. The uptake to equilibrium level was attained in about 5 min with a transient peak at 30 s. Although degradation or other metabolic reactions are less of a concern for accurate measurement of GSH transport in hepatic mitochondrial preparations than in those from renal cortex [3,4], the HPLC method enables unambiguous identification of intact GSH as the transported species. Martensson et al. [11] and Colell et al. [15], using scintillation counting with 35S-labeled-GSH as substrate, showed biphasic GSH uptake with low-affinity, high-capacity and high-affinity, low-capacity components. The high-affinity component was only observable at external GSH concentrations <1 mM. Inasmuch as the present studies used external GSH concentrations of 2.5–15 mM, it is not surprising that the low-affinity component was the only one that was detected. Considering that normal GSH concentrations in hepatic cytoplasm are in the range of 5– 7 mM, the quantitative significance of a high-affinity, low-capacity component is likely very small under all but the most stringent conditions of GSH depletion.
Uptake of GSH into the mitochondrial matrix did not require ATP or ATP hydrolysis. Inhibition of ATP synthesis, of ATP transport, or of the electron transport chain complex II did not suppress GSH uptake, although ATP did modestly increase GSH uptake. Martensson et al. [11] found that both ADP and ATP increased GSH uptake at 4 mM external GSH, but only ATP increased GSH uptake at the lower external GSH level of 0.15 mM. We conclude that GSH uptake in liver mitochondria is not dependent on ATP hydrolysis, at least at the relatively high concentrations of GSH that are normally found in the cytoplasm. The presence of added ATP or modulation of ATP transport or metabolism have some effects on mitochondria that can modestly alter GSH transport function, but based on these results, any effects are likely to be secondary and not a direct effect on the mitochondrial GSH transporters themselves.
Our analysis of the function of the OGC and DIC in hepatic mitochondrial GSH transport was prompted for two reasons. First, although Coll et al. [9] showed that the OGC is involved in hepatic mitochondrial GSH transport and they and others [10–12,15,16] have characterized some aspects of the energetics and kinetics of hepatic mitochondrial GSH transport, no previous study determined the interaction of anionic substrates for the various known mitochondrial organic anion carriers with GSH transport. Second, our previous work on the OGC in rat kidney mitochondria [7] and our analysis of the published cDNA sequences for the OGC in GenBank™ and the literature (also cf. Table 1), revealed the presence of tissue-specific differences for the OGC that may have functional importance. Interestingly, the cDNA sequence for the other main mitochondrial carrier involved in GSH transport, the DIC, appears to be invariant across tissues. Some differences in characteristics of GSH transport between the present study in rat liver mitochondria and those we reported previously in rat kidney mitochondria [3,4] were indeed observed. The primary difference is that whereas inhibition of the DIC and OGC with butylmalonate and phenylsuccinate inhibits GSH uptake in renal cortical mitochondria by >80%, the combination of the two inhibitors only blocked at most 50% of GSH uptake in hepatic mitochondria. Moreover, the two inhibitors were without significant inhibitory effect when they were used singly, suggesting that other carriers that are present in the hepatic inner mitochondrial membrane can readily compensate for the loss of function of one of the two carriers.
Another potential factor that has recently been shown to directly modulate GSH transport in mitochondria of cerebellar granule neurons is the pro-survival protein Bcl-2 [17]. In their study, Zimmermann and colleagues showed that Bcl-2 can directly bind GSH via the Bcl-2 homology-3 domain (BH3) groove and enhance mitochondrial accumulation of GSH. Moreover, Bax and other BH3 mimetics bind to Bcl-2, preventing its interaction with GSH, thereby leading to decreased accumulation of GSH in mitochondria, oxidative stress, and mitochondrial dysfunction. Although there are likely to be some tissue-specific differences, Bcl-2 presumably functions similarly in hepatic and renal mitochondria, although how its status influences function of the DIC and OGC is unclear at present. Such tissue-specific differences may in part explain some of the differences in properties of GSH transport that we have observed in renal mitochondria in previous studies and in hepatic mitochondria in the present study.
To assess further the potential functional and toxicological importance of these carriers in rat liver mitochondria, we stably transfected a rat hepatoma cell line, H4IIE cells, with the cDNA for OGC [7]. Confocal microscopy demonstrated that the expressed OGC protein localized in mitochondria. The OGC is a dimer and its targeting to the inner mitochondrial membrane requires a membrane potential and Tom 70 [18]. Western blot analysis provided further support that the OGC was expressed in mitochondria of the H4IIE cells. Overexpression of the OGC markedly protected cells from three model toxicants that act, at least in part, by producing oxidative stress, preventing both necrosis and apoptosis. HepG2 cells, a human hepatoblastoma cell line, showed a biphasic GSH uptake pattern similar to that found previously in rat liver mitochondria [19]. Using a chronic, ethanol-treated rat model, Coll et al. [9] provided evidence that the OGC functions as a GSH carrier in liver and that its sensitivity to perturbation of membrane dynamics contributes, in part, to the well-characterized alcohol-induced mitochondrial GSH depletion. They overexpressed the OGC (GenBank™ Accession No. XM_028373) in X. laevis oocytes and found that mitochondria isolated from these oocytes exhibited increased uptake of both GSH and 2-OG. Thus, we conclude that overexpression of OGC protects against oxidants by increasing mitochondrial GSH uptake.
OGC may have other functions as well. Kabe et al. [20] found that the OGC mediates porphyrin uptake in mitochondria, which is critical to heme production. Overexpression of human OGC in HEK-293 cells, a human embryonic kidney cell line, decreased mitochondrial membrane potential [21], but overexpression of OGC in yeast failed to alter membrane potential [22]. This uncoupling may be through the malate/aspartate shuttle, involving the electrogenic co-transport of a proton plus glutamate into mitochondria in exchange for aspartate [21]. Alternatively the OGC may influence other pathways to dissipate membrane potential.
In summary, the present study provides evidence that GSH uptake in rat liver mitochondria depends on both the DIC and OGC, the OGC protein localizes in mitochondria when expressed in H4IIE cells, and overexpression of the OGC in H4IIE cells protects from oxidants and this protection is attributable to increased mitochondrial GSH. Mitochondrial GSH depletion has been implicated in numerous pathological states and diseases, including chronic alcohol consumption and alcoholic liver diseases [9,15,18,23] and cirrhosis and biliary obstruction [24]. Modulation of the OGC, DIC, or other potential GSH carriers may provide promising strategies to develop novel treatments for various diseases [25,26].
Footnotes
This research was supported by NIH Grant R01-DK40725 to L.H.L. and by the NIEHS Center for Molecular Toxicology with Human Applications (Grant P30-ES06639) at Wayne State University.
Abbreviations used: AA, antimycin; CisPt, cisplatin; DAPI, 4,6-diamidino-2-phen-ylindole dihydrochloride; DIC, dicarboxylate carrier; FITC, fluorescein isothiocyanate; GSH, glutathione; LDH, lactate dehydrogenase; MVK, methyl vinyl ketone; ODC, oxodicarboxylate carrier; 2-OG, 2-oxoglutarate; OGC, 2-oxoglutarate carrier; PEP, phosphoenolpyruvate; TMD, transmembrane domain; TTBS, Tris-buffered saline containing Tween 20.
References
- 1.Meredith MJ, Reed DJ. J. Biol. Chem. 1982;257:3747–3753. [PubMed] [Google Scholar]
- 2.Griffith OW, Meister A. Proc. Natl. Acad. Sci. USA. 1985;82:4668–4672. doi: 10.1073/pnas.82.14.4668. [DOI] [PMC free article] [PubMed] [Google Scholar]
- 3.McKernan TB, Woods EB, Lash LH. Arch. Biochem. Biophys. 1991;288:653–663. doi: 10.1016/0003-9861(91)90248-h. [DOI] [PubMed] [Google Scholar]
- 4.Chen Z, Lash LH. J. Pharmacol. Exp. Ther. 1998;285:608–618. [PubMed] [Google Scholar]
- 5.Chen Z, Putt DA, Lash LH. Arch. Biochem. Biophys. 2000;373:193–202. doi: 10.1006/abbi.1999.1527. [DOI] [PubMed] [Google Scholar]
- 6.Lash LH, Putt DA, Matherly LH. J. Pharmacol. Exp. Ther. 2002;303:476–486. doi: 10.1124/jpet.102.040220. [DOI] [PubMed] [Google Scholar]
- 7.Xu F, Putt DA, Matherly LH, Lash LH. J. Pharmacol. Exp. Ther. 2006;316:1175–1186. doi: 10.1124/jpet.105.094599. [DOI] [PubMed] [Google Scholar]
- 8.Fernandez-Checa JC, Kaplowitz N, Garcia-Ruiz C, Miranda M, Mari M, Ardite E, Morales A. Am. J. Physiol. 1997;273:G7–G17. doi: 10.1152/ajpgi.1997.273.1.G7. [DOI] [PubMed] [Google Scholar]
- 9.Coll O, Colell A, Garcia-Ruiz C, Kaplowitz N, Fernandez-Checa JC. Hepatology. 2003;38:692–702. doi: 10.1053/jhep.2003.50351. [DOI] [PubMed] [Google Scholar]
- 10.Fiermonte G, Dolce V, Palmieri L, Ventura M, Runswick MJ, Palmieri F, Walker JE. J. Biol. Chem. 2001;276:8225–8230. doi: 10.1074/jbc.M009607200. [DOI] [PubMed] [Google Scholar]
- 11.Martensson J, Lai JCK, Meister A. Proc. Natl. Acad. Sci. USA. 1990;87:7185–7189. doi: 10.1073/pnas.87.18.7185. [DOI] [PMC free article] [PubMed] [Google Scholar]
- 12.Garcia-Ruiz C, Morales A, Colell A, Rodes J, Yi JR, Kaplowitz N. J. Biol. Chem. 1995;270:15946–15949. doi: 10.1074/jbc.270.27.15946. [DOI] [PubMed] [Google Scholar]
- 13.Lash LH, Sall JM. In: Mitochondrial Dysfunction: Methods in Toxicology. Lash LH, Jones DP, editors. vol. 2. Academic Press; San Diego, CA: 1993. pp. 8–28. [Google Scholar]
- 14.Runswick MJ, Walker JE, Bisaccia F, Iacobazzi V, Palmieri F. Biochemistry. 1990;29:11033–11040. doi: 10.1021/bi00502a004. [DOI] [PubMed] [Google Scholar]
- 15.Colell A, Garcia-Ruiz C, Morales A, Ballesta A, Ookhtens M, Rodes J, Kaplowitz N, Fernandez-Checa JC. Hepatology. 1997;26:699–708. doi: 10.1002/hep.510260323. [DOI] [PubMed] [Google Scholar]
- 16.Kurosawa K, Hayashi N, Sato N, Kamada T, Tagawa K. Biochem. Biophys. Res. Commun. 1990;167:367–372. doi: 10.1016/0006-291x(90)91774-m. [DOI] [PubMed] [Google Scholar]
- 17.Zimmermann AK, Loucks FA, Schroeder EK, Bouchard RJ, Tyler KL, Linseman DA. J. Biol. Chem. 2007;282:29296–29304. doi: 10.1074/jbc.M702853200. [DOI] [PMC free article] [PubMed] [Google Scholar]
- 18.Palmisano A, Zara V, Honlinger A, Vozza A, Dekker PJT, Pfanner N, Palmieri F. Biochem. J. 1998;333:151–158. doi: 10.1042/bj3330151. [DOI] [PMC free article] [PubMed] [Google Scholar]
- 19.Lluis JM, Colell A, Garcia-Ruiz C, Kaplowitz N, Fernandez-Checa JC. Gastroenterology. 2003;124:708–724. doi: 10.1053/gast.2003.50089. [DOI] [PubMed] [Google Scholar]
- 20.Kabe Y, Ohmori M, Shinouchi K, Tsuboi Y, Hirao S, Azuma M, Watanabe H, Okura I, Handa H. J. Biol. Chem. 2006;281:31729–31735. doi: 10.1074/jbc.M604729200. [DOI] [PubMed] [Google Scholar]
- 21.Yu XX, Lewin DA, Zhong A, Brush J, Schow PW, Sherwood SW, Pan G, Adams SH. Biochem. J. 2001;353:369–375. doi: 10.1042/0264-6021:3530369. [DOI] [PMC free article] [PubMed] [Google Scholar]
- 22.Sanchis D, Fleury C, Chomiki N, Goubern M, Huang Q, Neverova M, Gregoire F, Easlick J, Raimbault S, Levi-Meyrueis C, Miroux B, Collins S, Seldin M, Richard D, Warden C, Bouillaud F, Ricquier D. J. Biol. Chem. 1998;273:34611–34615. doi: 10.1074/jbc.273.51.34611. [DOI] [PubMed] [Google Scholar]
- 23.Fernandez-Checa JC, Garcia-Ruiz C, Ookhtens M, Kaplowitz N. J. Clin. Invest. 1991;87:397–405. doi: 10.1172/JCI115010. [DOI] [PMC free article] [PubMed] [Google Scholar]
- 24.Krahenbuhl S, Talos C, Lauterburg BH, Reichen J. Hepatology. 1995;22:607–612. doi: 10.1002/hep.1840220234. [DOI] [PubMed] [Google Scholar]
- 25.Fernandez-Checa JC, Kaplowitz N. Toxicol. Appl. Pharmacol. 2005;204:263–273. doi: 10.1016/j.taap.2004.10.001. [DOI] [PubMed] [Google Scholar]
- 26.Lash LH. Chem.-Biol. Interact. 2006;163:1–14. doi: 10.1016/j.cbi.2006.03.001. [DOI] [PMC free article] [PubMed] [Google Scholar]


