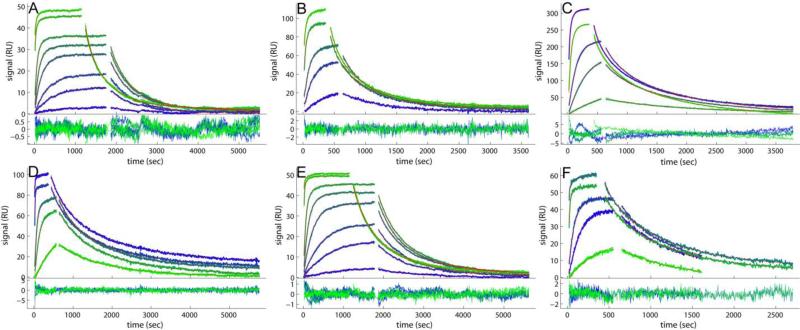
Figure 1.
Comparison of the experimental data and fits for binding of soluble B2MG to a monoclonal IgG antibody immobilized on different sensor surfaces. Binding data (blue to green) and best-fit (red lines, virtually superimposed by the blue/green lines) from the affinity and kinetic rate constant distribution model without (A, B, D, E, F) and with two-compartment transport approximation (C). Excellent fits are achieved for all the data sets, with rmsd values listed in Table 1. For each panel, the binding traces and best-fits are shown on the top, and the residuals of the fit are shown on the bottom. (A) B2MG at 0.1, 0.5, 1.0, 2.5, 5.0, 10, 50 and 100 nM binding to a CM3 sensor chip with 1350 RU of anti-B2MG-biotin immobilized. (B) B2MG at 1.0, 5.0, 10, 50 and 100 nM binding to a CM5 sensor chip with 3000 RU of anti-B2MG-biotin immobilized. (C) B2MG at 1.0, 5.0, 10, 50 and 100 nM binding to a CM5 sensor chip with 6000 RU of anti-B2MG-biotin immobilized. (D) B2MG at 1.0, 5.0, 10, 50 and 100 nM binding to a C1 sensor chip with 1500 RU of anti-B2MG-biotin captured on the surface with 1500 RU of SA immobilized. (E) B2MG at 0.1, 0.5, 1.0, 2.5, 5.0, 10, 50 and 100 nM binding to a CM3 sensor chip with 800 RU of anti-B2MG-biotin captured on the surface with 880 RU of SA immobilized. (F) B2MG at 1.0, 5.0, 10, 50 and 100 nM binding to a CM5 sensor chip with 1000 RU of anti-B2MG-biotin captured on the surface with 1000 RU of SA immobilized.

