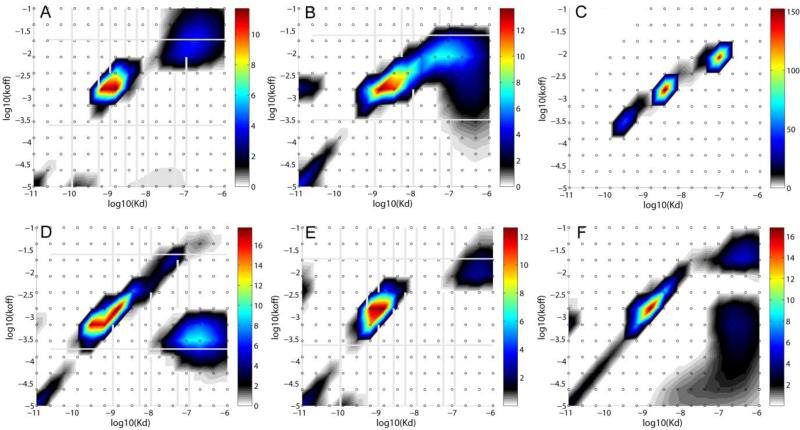
Figure 2.
Best-fit affinity and kinetic rate constant P(koff, KD) distribution from the global fit of all traces in corresponding panels of Figure 1. A: CM3; B: CM5 (low density); C: CM5 (high density); D: C1-SA; E: CM3-SA; F: CM5-SA. The distribution is modeled using a grid of 12 koff values between 10-5 and 10-1 s-1, and a grid of 15 KD values between 0.01 nM and 1 μM, as indicated by the small circles, with Tikhonov-Phillips regularization on a P = 0.95 confidence level. Each distribution is depicted as a color temperature contour plot, with the color scale depicted in the color bar on the right side.

