

Abstract
Background
Quantifying population health is important for public health policy. Since national disease registers recording clinical diagnoses are often not available, pharmacy data were frequently used to identify chronic conditions (CCs) in populations. However, most approaches mapping prescribed drugs to CCs are outdated and unambiguous. The aim of this study was to provide an improved and updated mapping approach to the classification of medications. Furthermore, we aimed to give an overview of the proportions of patients with CCs in Switzerland using this new mapping approach.
Methods
The database included medical and pharmacy claims data (2011) from patients aged 18 years or older. Based on prescription drug data and using the Anatomical Therapeutic Chemical (ATC) classification system, patients with CCs were identified by a medical expert review. Proportions of patients with CCs were calculated by sex and age groups. We constructed multiple logistic regression models to assess the association between patient characteristics and having a CC, as well as between risk factors (diabetes, hyperlipidemia) for cardiovascular diseases (CVD) and CVD as one of the most prevalent CCs.
Results
A total of 22 CCs were identified. In 2011, 62% of the 932′612 subjects enrolled have been prescribed a drug for the treatment of at least one CC. Rheumatologic conditions, CVD and pain were the most frequent CCs. 29% of the persons had CVD, 10% both CVD and hyperlipidemia, 4% CVD and diabetes, and 2% suffered from all of the three conditions. The regression model showed that diabetes and hyperlipidemia were strongly associated with CVD.
Conclusions
Using pharmacy claims data, we developed an updated and improved approach for a feasible and efficient measure of patients’ chronic disease status. Pharmacy drug data may be a valuable source for measuring population’s burden of disease, when clinical data are missing. This approach may contribute to health policy debates about health services sources and risk adjustment modelling.
Keywords: Population health, Pharmacy data, Medication classification, Chronic conditions
Background
The evaluation of the population health status, patients’ health care needs and its associated costs is a priority issue in health policy, decision-making and resource allocation debates. In general, data of national disease registries and prevalence surveys, including clinical diagnoses according to the International Classification of Diseases (ICD-10-codes) have regularly been used to estimate the health status of a population. However, this type of data pool is not available in all health care systems. In Switzerland, for example, epidemiological data, providing information on the prevalence of chronic diseases and comorbidities in general population, are not widely available.
Administrative databases such as drug prescription data have thus been frequently used to identify persons with chronic conditions, quasi as an indirect method to estimate prevalence. Pharmacy based claims data provide a consistently available information source, which is reliable, covers a large population and might be extremely useful for assessment of morbidity [1-6]. Pharmacy-based diagnosis were used in risk adjustment models [7-9], illness severity measurement [10,11], prevalence estimates [12-15] and epidemiological studies for comorbidity adjustments [16,17]. However, in these studies the clustering of the Anatomical Therapeutic Chemical (ATC)-codes has not been applied consistently, and even in few studies the used ATCs are not documented. Moreover, the well-known ATC-algorithm of Lamers/van Vliet [18-20], the Pharmacy-based Cost Group (PCG) model, was often used in various modified and unspecified defined versions. The PCG model distinguishes 22 chronic conditions and was primarily developed to predict cost of diseases for risk adjustment. However, this model has some limitations. Medication classifications based on data, which have been recorded about 10 years ago. New drugs, which had not been developed and thus were not commercially available in the past years, were not included in the model. Furthermore, previous studies claimed the possibility of an exact differentiation between specific diseases via ATC code [12,19-21]. For example beta-blockers and diuretics were assigned to the category “hypertension” [19,22]. However, beta-blockers were also prescribed in patients with other cardiovascular diseases. Another example, diuretics were included in the category “cardiovascular diseases” although diuretics were also frequently used in patients with renal diseases [12,21]. In several medication classes, an ambiguous assignment of medication to chronic conditions is challenging and even, in certain cases, infeasible.
To overcome the limitations of previous mapping approaches, and to suggest a standardised and transparent use of the mapped medication classes to chronic conditions, we aimed to develop an updated mapping algorithm with a special focus on the unambiguous assignment of prescription drugs to chronic diseases. We provide an updated and rather conservative mapping approach to the classification of medications. Our classification is on the one side detailed as possible and on the other side we summarise categories to the superior category of disease when needed. Furthermore, we give an overview of the proportions of chronically ill patients in Switzerland using pharmacy data.
Methods
Study design and population
This study was a cross-sectional study covering all 26 cantons in Switzerland during the study period of January 1, 2011 to December 31, 2011. The study sample included all mandatory insured individuals aged 18 years or older insured by the Helsana Insurance Group, the leading Swiss health insurer. Individuals who died during the calendar year 2011 were also included in our study sample. In Switzerland, each resident has a mandatory basic coverage which is financed by a premium. All Swiss health insurants have an insurance coverage with cost sharing consisting of co-payments and deductibles. Co-payments are a charge of 10% of the health care costs per year which every person has to pay. This co-payment is limited to 700 Swiss francs (Sfr) per year. Deductibles range from 300 (Sfr) to a maximum of 2500 (Sfr) per year and can be chosen by the insurants. The amount of the premium decreases when the patient choose higher deductibles.
Data source
Medical claims data were used from Helsana, covering about 1.3 million Swiss residents with mandatory health insurance. Population characteristics comprised gender, age, regional variables (e.g. language area) and the type of health insurance plan (managed care model, accident coverage, type of deductible class). The database also included information on health care visits, prescription drugs and drug costs. Drug data were based on medications prescribed in the outpatient setting including prescribed drugs which were purchased directly at the pharmacy. The outpatient setting comprised practice-based primary care physicians and specialists, as well as physicians from ambulatories, outpatient clinics and walk-in clinics. In our database, all prescribed drug items were coded according to the WHO ATC classification system [23]. Our (drug) data are highly reliable because the collected insurance claims covered almost all health care and pharmacy invoices. Since about 3% of the invoices were directly paid by the patient and not submitted for reimbursement, only a small percentage of invoices could not considered in our analyses. Permission to access the study data was provided by the Helsana Group.
Identification of chronic diseases
The Anatomical Therapeutic Chemical (ATC) classification system was used to classify drugs and was controlled by the WHO Collaborating Centre for Drug Statistics Methodology. Each drug ingredient was assigned to the so called ATC code and was classified into different groups according to the human organ system on which they act. Ingredients can be used in different local application formulations: oral, inhalation, nasal, injection, installation, parenteral, rectal, transdermal, sublingual/buccal, implant, vaginal. Based on the WHO-report on ATC classification system, ATC-codes were assigned to chronic conditions by a medical expert group consisting of primary and secondary care physicians as well as health services researchers. We only included ATC-codes for chronic diseases which are exclusively used for the treatment of these diseases. Some drugs may be assigned to two chronic diseases simultaneously. For example, loop or “high-ceiling” diuretics (e.g. sulfonamides) are most frequently used in patients with heart failure but also in patients with poor renal function (chronic kidney disease). Additionally, beta-blockers are prescribed both in patients with hypertension and in patients with other cardiovascular diseases. In general, an unique assignment of ATC-codes to heart diseases is challenging. Since new trends in the use of various drugs for cardiac and hypertensive patients have been established over the last years, a clear distinction between ATC-codes for cardiac diseases and for hypertension is infeasible. Therefore, we conservatively evaluated the ATCs related to chronic diseases and generated relatively broad ATC-groups (e.g. “cardiovascular diseases inclusive hypertension”). ATCs, which could not be matched to a certain disease, were excluded. In our database, all ATC-codes referring to these ATC-groups classes were coded with the correspondingly chronic condition.
Statistical analyses
We calculated the point prevalence of chronic conditions (CC) by dividing the number of patients with at least one prescribed drug in one of the generated ATC-groups CC at the end of the given year (31.12.2011) by the total number of insured persons aged ≥ 18 years at the end of 2011 (31.12). We presented proportions of patients with chronic conditions stratified by sex and age.
In this study, we also described the situation of patients with cardiovascular diseases. Cardiovascular diseases are the leading cause of death and are becoming an increasing economic and social burden for industrialized societies [24]. Therefore, we calculated prevalence rates of cardiovascular diseases (including hypertension) in combination with their risk factors, diabetes and hyperlipidemia, by age.
Furthermore, we estimated multiple logistic regression models to determine independent associations between age, sex, regional variables, the type of health insurance plan, and the occurrence of any chronic condition. Additionally, we performed a logistic regression to determine factors associated with the presence of cardiovascular diseases (including hypertension) as dependent variable. The independent variables included cardiovascular risk factors such as diabetes and hyperlipidemia, as well as patient characteristics described in the previous model. Analyses were performed using the software package R (version 2.12.2).
Results
Based on prescription drug data, we identified a total of 22 diseases. Table 1 summarises the chronic conditions with the assigned medication classes.
Table 1.
Chronic diseases and assigned ATC-codes and medication classes
| Chronic condition | ATC classification | Medication class |
|---|---|---|
| Acid related disorders |
A02 |
Antacids |
| Drugs for peptic ulcer and gastroesophageal reflux disease (GERD) | ||
| Other drugs for acid related disorders | ||
| Bone diseases (osteoporosis) |
M05 |
Drugs for treatment of bone diseases |
| Cancer |
L01 |
Antineoplastic agents |
| Cardiovascular diseases (incl. hypertension) |
B01AA, B01AC, |
Cardiac agents (excl. ACE inhibitors) |
| C01, C04A, |
Antihypertensives |
|
| C02, C07, |
Peripheral vasodilators |
|
| C08, C09 |
Beta blocking agents |
|
| Calcium channel blockers | ||
| Agents acting on the renin-angiotensin system | ||
| Vitamin K antagonists | ||
| |
Platelet aggregation inhibitors (excl. herparin) |
|
| Dementia |
N06D |
Anti-dementia drugs |
| Diabetes mellitus |
A10A, A10B, |
Insulins and analogues |
| A10X |
Blood glucose lowering drugs (excl. insulins) |
|
| Other drugs used in diabetes | ||
| Epilepsy |
N03 |
Antiepileptics |
| Glaucoma |
S01E |
Antiglaucoma preparations and miotics |
| Gout, Hyperuricemia |
M04 |
Antigout preparations |
| HIV |
J05AE, J05AG, |
Protease inhibitors |
| J05AR |
Non-nucleoside reverse transcriptase inhibitorsAntivirals for treatment of HIV infections, combinations |
|
| Hyperlipidemia |
C10 |
Lipid modifying agents |
| Intestinal inflammatory diseases |
A07EA, A07EC |
Corticosteroids acting locallyAminosalicylic acid and similar agents |
| Iron deficiency anemia |
B03AA, B03AB, |
Iron bivalent, oral prepartations |
| Iron trivalent, oral preparations | ||
| B03AC |
Iron trivalent, parenteral preparations |
|
| Migraines |
N02C |
Antimigraine preparations |
| Pain |
N02A, N02B |
Opioids |
| Other analgesics | ||
| Parkinson’s disease |
N04 |
Anti-parkinson drugs |
| Psycholgical disorders (sleep disorder, depression) |
N05B, N05C, |
Anxiolytics |
| N06A |
Hypnotics and sedativesAntidepressants |
|
| Psychoses |
N05A |
Antipsychotics |
| Respiratory illness (asthma, COPD) |
R03 |
Drugs for obstructive airway diseases |
| Rheumatologic conditions |
M01, M02 |
Antiflammatory and antirheumatic products |
| L04AA, L04AB |
Topical products for joint and muscular pain |
|
| Selective immunosuppressants | ||
| TNF-alpha inhibitors | ||
| Thyroid disorders |
H03 |
Drugs for thyroid therapy |
| Tuberculosis | J04A | Drugs for treatment of tuberculosis |
Table 2 shows the population characteristics of our study sample. We identified 932′612 adult individuals of a total of more than 1′300′000 subjects in 2011. There were slightly more woman (53%) than men. The mean age of the population was 51 years. About 40% of the sample chose a health insurance plan with managed care and 30% a deductible class over 500 Swiss francs. Approximately two thirds of the sample had one or more medication classes assigned with chronic conditions. Since several patients have been prescribed more than one disease related medication, multimorbidity could be observed. About 45% of the population had at least two chronic conditions (result not shown).
Table 2.
Population characteristics of insured individuals in 2011
| Variables | N (%) |
|---|---|
| Total |
932′612 |
| Gender |
|
| Women |
489′501 (52.5) |
| Mean age (sd*) |
51.4 (19.2) |
| Language area |
|
| German |
715′443 (76.7) |
| French |
151′144 (16.2) |
| Italian |
64′040 (6.9) |
| Rhaeto-Romanic |
1′985 (0.2) |
| Insurance plan |
|
| Managed care |
|
| Yes |
394′362 (42.3) |
| No |
538′250 (57.7) |
| Deductible class (> 500 Swiss francs/year) |
|
| Yes |
283′441 (30.4) |
| No |
649′171 (69.6) |
| Accident coverage |
|
| Yes |
514′930 (55.2) |
| No |
417′682 (44.8) |
| One or more chronic condition |
|
| Yes |
578′115 (62.0) |
| No | 354′497 (38.0) |
*Standard deviation.
Within both gender groups, the number of medication classes assigned to chronic conditions increased linearly with age, as plotted in Figure 1. The strongest increase from approximately 1.5 to 3 chronic conditions was observed in patients aged between 40 and 70 years. The curve was moderately rising in younger (18–40 years) as well as in older age (>70 years). Female patients were prescribed slightly more drugs for chronic diseases compared to male patients. On average, patients suffered from about two chronic conditions in the age group of 50–59 years, from about three chronic conditions in the age group of 60–69 years and from slightly more than three conditions in the age group of over 69 years or older.
Figure 1.
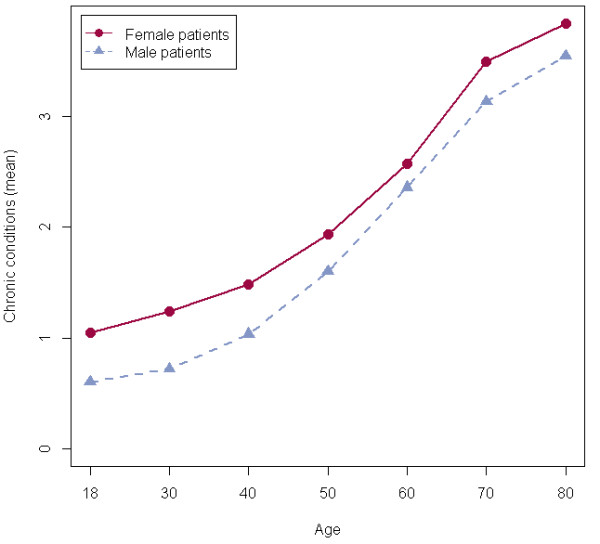
Mean number of chronic conditions among all patients by sex and age.
The number and proportions of insured persons in each ATC-group are presented in Table 3. The largest proportions of persons suffered from rheumatologic conditions (36%), cardiovascular diseases including hypertension (29%), pain (28%) and psychological disorders including sleep disorders and depressions (21%). About 20% of the individuals have been prescribed a drug for treating acid related disorders, 12% for hyperlipidaemia and 7% for respiratory illnesses including asthma and COPD.
Table 3.
Number and proportion of patients by chronic condition
| Chronic condition | Number of patients | Proportion of patients (%) |
|---|---|---|
| Acid related disorders |
183′211 |
19.6 |
| Bone diseases (osteoporosis) |
22′159 |
23.8 |
| Cancer |
13′105 |
1.4 |
| Cardiovascular diseases (incl. hypertension) |
269′993 |
29.0 |
| Dementia |
16′780 |
1.8 |
| Diabetes mellitus |
50′751 |
5.4 |
| Epilepsy |
27′225 |
2.9 |
| Glaucoma |
33′640 |
3.6 |
| Gout, Hyperuricemia |
16′332 |
1.8 |
| HIV |
1′956 |
0.2 |
| Hyperlipidemia |
114′698 |
12.3 |
| Intestinal inflammatory diseases |
4′542 |
0.5 |
| Iron deficiency anemia |
38′022 |
4.1 |
| Migraines |
11′325 |
1.2 |
| Pain |
261′225 |
28.0 |
| Parkinson’s disease |
10′942 |
1.2 |
| Psycholgical disorders (sleep disorder, depression) |
197′490 |
21.2 |
| Psychoses |
30′024 |
3.2 |
| Respiratory illness (asthma, COPD) |
68′595 |
7.4 |
| Rheumatologic conditions |
336′373 |
36.1 |
| Thyroid disorders |
35′053 |
3.8 |
| Tuberculosis | 799 | 0.1 |
29% of the persons had CVD, 10% both CVD and hyperlipidemia, 4% CVD and diabetes, and 2% suffered from all of the three conditions (results not shown). As showed in Figure 2, the prevalence of cardiovascular diseases (including hypertension), hyperlipidemia and diabetes was continuously increasing with age. Furthermore, there was a strong increase in the proportion of patients between 40 and 70 years suffering from cardiovascular diseases in combination with hyperlipidemia and/or diabetes mellitus. For the age group 40–49 years, the prevalence was 2.2% for cardiovascular diseases combined with hyperlipidemia, 1.1% for cardiovascular diseases with diabetes and 0.5% for cardiovascular diseases with hyperlipidemia and diabetes. For the age group of 70–79 years, the proportion of patients with cardiovascular diseases combined with hyperlipidemia was 29.5%, with diabetes 12.4% and with both hyperlipidemia and diabetes 7.5%. With exception of cardiovascular diseases, every proportion of patients with chronic condition and its combinations slightly decreased in older age groups (70–79 and >79 years). Additional analyses could show that 35% of patients with cardiovascular diseases were also treated for hyperlipidemia and 15% for diabetes mellitus. About 9% of the patients with cardiovascular diseases were both hypertensive and diabetic (results not shown).
Figure 2.
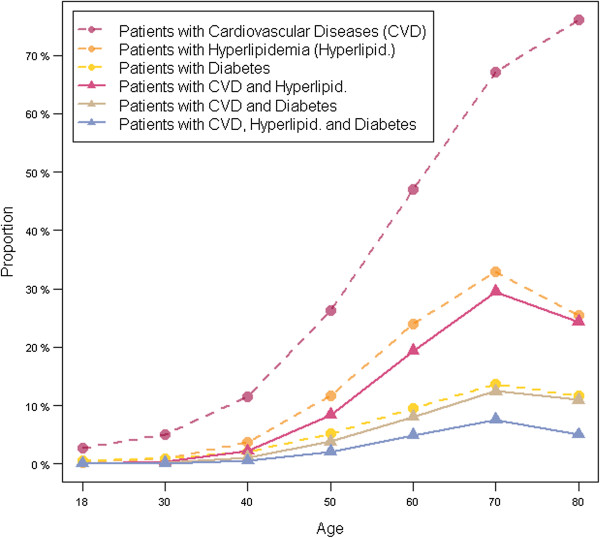
Proportions of patients with cardiovascular diseases and their risk factors by age.
To identify independent predictors of the occurrence of any chronic condition, we estimated a multiple logistic regression model (Table 4). Female sex and older age strongly predicted the prevalence of any chronic condition. We constructed a second multiple logistic regression to determine risk factors for prevalent cardiovascular diseases. Older age and suffering from diabetes mellitus and hyperlipidemia were independently associated with prevalent cardiovascular diseases (inclusive hypertension).
Table 4.
Risk factors for chronic conditions in multivariate modelling using logistic regression
| |
Chronic condition |
Cardiovascular diseases |
||
|---|---|---|---|---|
| Variable | OR* | 95%-CI † | OR* | 95%-CI † |
| Gender |
|
|
|
|
| Women |
1.39 |
1.38-1.41 |
0.89 |
0.88-0.90 |
| Age groups |
|
|
|
|
| 18-29 |
1.00 |
|
1.00 |
|
| 30-39 |
1.50 |
1.48-1.53 |
2.16 |
2.07-2.24 |
| 40-49 |
1.65 |
1.62-1.67 |
4.20 |
4.05-4.36 |
| 50-59 |
2.27 |
2.23-2.31 |
8.85 |
8.55-9.16 |
| 60-69 |
3.95 |
3.89-4.02 |
17.20 |
16.62-17.79 |
| 70-79 |
7.79 |
7.62-7.97 |
34.44 |
33.24-35.68 |
| >79 |
8.73 |
8.50-8.97 |
60.80 |
58.61-63.07 |
| Language area |
|
|
|
|
| German |
1.00 |
|
1.00 |
|
| French |
1.25 |
1.23-1.26 |
0.87 |
0.85-0.88 |
| Italian |
1.11 |
1.09-1.14 |
0.84 |
0.82-0.86 |
| Rhaeto-Romanic |
0.82 |
0.74-0.90 |
0.77 |
0.67-0.88 |
| Insurance plan |
|
|
|
|
| Managed care |
1.001 |
0.99-1.01 |
0.92 |
0.91-0.93 |
| Deductible class (> 500 Swiss francs/year) |
0.25 |
0.25-0.25 |
0.36 |
0.35-0.36 |
| Accident coverage |
1.06 |
1.05-1.07 |
1.15 |
1.13-1.16 |
| Cardiovascular risk factors |
|
|
|
|
| Diabetes |
|
|
4.23 |
4.11-4.34 |
| Hyperlipidemia |
|
|
6.79 |
6.67-6.92 |
| Nagelkerke R2 | 0.28 | 0.52 | ||
*Odds ratio.
†95% confidence interval.
Table 5 gives an overview on our estimated proportions of patients with cardiovascular diseases, diabetes mellitus, hyperlipidemia, cancer and respiratory illness (asthma, COPD) compared to those proportions from available data sources in Switzerland [25-35]. Proportions of cancer, cardiovascular diseases, diabetes and respiratory illness reported in previous studies were similar to our estimates using pharmacy data [25,28,31,34]. However, previous findings about the prevalence of hyperlipidemia were about twice as high than those estimated in our pharmacy based study [27,33].
Table 5.
Proportions of chronically ill patients compared to other epidemiological data
|
Chronic condition |
Various data sources |
Data used in this study (2011) |
|||
|---|---|---|---|---|---|
| Proportion of patients (%) | Description of the chronic condition | Data source/study design (year of data) | Reference | Proportion of patients (%) | |
| Cancer |
1.5 |
All malignant neoplasms excluding non-melanoma skin cancer |
Registry data (1992) |
Micheli et al. 2002 [25] |
1.4 |
| |
1.4 |
Registry data (2008) |
WHO 2008 [26] |
||
| Cardiovascular diseases (incl. hypertension) |
30.0 |
Hypertension |
Epidemiological data (2001) |
Pechère-Bertschi et al. 2005 [27] |
29.0 |
| |
36.0 |
High blood pressure |
Epidemiological data (2003–2006) |
Firmann et al. 2008 [28] |
|
| |
34.4 |
Hypertension |
Epidemiological data (1999-2009) |
Guessous et al. 2012 [29] |
|
| Diabetes mellitus |
6.3 |
Type 2 diabetes |
Epidemiological data (2003–2006) |
Kaiser et al. 2012 [30] |
5.4 |
| |
5.8 |
Diabetes |
Officially registered hospital discharges with diagnosis (2008) |
Bopp et al. 2011 [31] |
|
| |
3.3 |
Non-insulin dependent diabetes |
Electronic medical records (2009–2011) |
Rizza et al. 2012 [32] |
|
| Hyperlipidemia |
20.0 |
Dyslipidemia |
Epidemiological data (2001) |
Pechère-Bertschi et al. 2005 [27] |
12.3 |
| |
29.0 |
Dyslipidemia |
Epidemiological data (2003–2006) |
Firmann et al. 2010 [33] |
|
| Respiratory illness (asthma, COPD) |
5.7-10.0 |
Asthma |
Epidemiological data (2002) |
Bridevaux et al. 2010 [34] |
7.4 |
| 9.1 | COPD | Epidemiological data (2002) | Bridevaux et al. 2008 [35] | ||
Proportions of patients with cancer, respiratory illness, cardiovascular diseases and cardiovascular risk factors based on data used in this study (2011) compared to proportions from available data sources in Switzerland.
Discussion
This study developed an updated mapping approach to identify chronically ill patients using pharmacy data. Databases on prescribed drugs are an useful source of information on morbidity, if reliable medical diagnoses are missing.
In our classification model, we identified a total of 22 chronic conditions based on the 2011 WHO-ATC-classification. We found that the largest proportions of persons suffered from pain, rheumatologic conditions and cardiovascular diseases, including hypertension. These findings are in line with previous studies in Italy estimating prevalence of chronic diseases showing highest rates in cardiovascular diseases and rheumatologic conditions [12,13]. On the other hand, our results are different from the Dutch estimates based on the PCG-model showing a low prevalence rate in rheumatologic conditions [19]. One explanation is the fact that a different and partly out-dated medication classification for the chronic conditions was used. New drugs, which have been developed during the last decade, were not included in the PCG-model performed in the nineties. We assume that the Italian results may be more exact, since a more recent medication classification was used in comparison to the Dutch study. Several of our estimated proportions of patients with chronic conditions are comparable to prevalence estimates in other European countries. For example, the prevalence of diabetes mellitus, as one of the leading health problems in the industrialised countries, is similar to the prevalence in Germany and the Netherlands [15,36,37]. Additionally, the prevalence rates of asthma are comparable to those reported in other European countries such as France, Norway and Germany [38]. Not surprisingly and in line with several studies, we could show that chronic conditions affected all ages, but with a significant increase in older age groups [39-42]. Furthermore, we found that cardiovascular diseases are mainly attributable to classical risk factors such as diabetes and hyperlipidemia. A large body of epidemiological and pathological data also demonstrated that diabetes and dyslipidemia are independent risk factors for cardiovascular diseases in both men and women. Diabetes and hyperlipidemia are common comorbidities of cardiovascular diseases and contributed significantly to its overall mortality [43-47].
A further aim of our study was to compare our estimated proportions of chronically ill patients with the reliable prevalence estimates from national studies. Therefore, we compared our estimated proportions of patients with cardiovascular diseases, diabetes mellitus, hyperlipidemia, cancer and respiratory illness (asthma, COPD) to those proportions from available data sources in Switzerland. Data on further chronic conditions could not be presented, since epidemiological data in Switzerland are very scarce. We found a high level of agreement between the estimates using pharmacy data and those reported by epidemiological studies. Proportions of cancer, cardiovascular diseases, diabetes and respiratory illness matched quite well [25,28,31,34]. For hyperlipidemia, study results showed lower prevalence estimates than those revealed in our pharmacy based study [27,33]. One explanation for the discrepancy between our findings and those from Pèchere-Bertschi et al. [27] and Firmann et al. [33] is the questionable representativeness for the general Swiss population. For example, Firmann et al. [33] collected data from a sample of 6′084 subjects living in one Swiss city, Lausanne, with a relatively high percentage of non-Swiss compared to other cities. Moreover, this study was conducted six years ago and recent trends in prevalence are not taken into account.
There are some limitations addressing the accuracy of our estimates. About 3% of the used claims invoices were paid directly by the patients and not by the health insurer. Drug data may be underrepresented since claims data are not completely recorded. Furthermore, the number of prescribed drugs was underreported because they were obtained exclusively in outpatient settings. Additionally, drug-based diagnoses are naturally regarded as a proxy for a medical diagnosis. Since we excluded ATC-codes which could not be matched to certain diseases, proportions may be underestimated. Moreover, we are not able to distinguish specific chronic diseases such as hypertension from other cardiovascular diseases. For legal and ethical reasons as well as regarding data security, data do not include medical diagnoses and clinical procedures, and thus we are unable to give more information on chronic conditions as well as to provide prevalence estimates based on medical diagnoses (e.g. ICD-10) for comparisons in the same data source. Furthermore, in Switzerland reliable epidemiological data are scare. Appropriate additional, independent samples for comparing the prevalence estimates are not widely available. However, drug-based diagnoses could not completely substitute, but add clinical data. Mapping medication classes to chronic conditions is a frequently recommended and used in previous studies [10,12,21]. Moreover, we assume that no patient is prescribed a drug for chronic conditions such as insulin without a serious indication of diabetes. However, this study has several strengths. Our study is based on a very comprehensive administrative claims database for a large population across Switzerland with an almost complete recording of prescribed drug data. Administrative data are a consistently available source of information on morbidity, health care use and costs of care. They are reliable, longitudinal, practice-based, large in size and widely accepted in epidemiological, health services and outcomes research to assess prevalence. Moreover, studies developing risk models emphasised that prescription data derived from administrative claims database have several advantages over diagnostic data regarding reliability, timeliness and completeness of data [7,11,48]. In the Dutch health care system, the use of information on chronic conditions obtained from claims for prescribed drugs are well established as a helpful instrument for improving risk equalisation between the sickness funds as well as in capitation modelling [19,20,49]. In Switzerland, there is an on-going debate about the optimal risk equalisation scheme [50-53]. The present Swiss risk equalisation scheme is a demographics-based risk equalisation model which based on age, sex and an at least three successive night-stays in a hospital or nursing home (in the previous year) as equalising elements. In 2011, the Swiss parliament has decided to refine the risk equalisation by diagnoses based on pharmacy data, since no appropriate data on diagnosed diseases exist. Consequently, it is particularly important to identify those ATC-codes which are exclusively used for the treatment of population’s common diseases. Pharmacy-based, estimated prevalence data might be a useful addition for risk adjustment modelling in health care delivery systems with demographics-based risk equalisation schemes.
Conclusions
Using pharmacy data, we developed an updated and improved approach for a feasible and efficient measure of patients’ chronic disease status. Pharmacy drug data may be a valuable source for measuring population’s burden of disease, when clinical data are missing. This approach may contribute to health policy debates about health services sources and risk adjustment modelling.
Competing interests
All authors declare that they have no competing interests.
Authors’ contributions
CAH and OR participated in the conceptual development and study design. CH drafted the manuscript and RR analysed the data. OR and TDS revised the manuscript. All authors participate in the interpretation of data, critically reviewed and gave final approval to the manuscript.
Pre-publication history
The pre-publication history for this paper can be accessed here:
Contributor Information
Carola A Huber, Email: carola.huber@helsana.ch.
Thomas D Szucs, Email: thomas.szucs@unibas.ch.
Roland Rapold, Email: roland.rapold@helsana.ch.
Oliver Reich, Email: oliver.reich@helsana.ch.
Acknowledgements
The authors thank Heiner C. Bucher from the University Hospital Basel for his very helpful comments and suggestions. We also thank all participants of the medical expert group who assigned the pharmacy codes to the equivalent chronic conditions.
References
- McKee M. Routine data: a resource for clinical audit? Qual Health Care. 1993;2(2):104–111. doi: 10.1136/qshc.2.2.104. [DOI] [PMC free article] [PubMed] [Google Scholar]
- Zhan C, Miller MR. Administrative data based patient safety research: a critical review. Qual Saf Health Care. 2003;12(Suppl 2):ii58–ii63. doi: 10.1136/qhc.12.suppl_2.ii58. [DOI] [PMC free article] [PubMed] [Google Scholar]
- Smeets HM, de Wit NJ, Hoes AW. Routine health insurance data for scientific research: potential and limitations of the Agis Health Database. J Clin Epidemiol. 2011;64(4):424–430. doi: 10.1016/j.jclinepi.2010.04.023. [DOI] [PubMed] [Google Scholar]
- Monfared AA, Lelorier J. Accuracy and validity of using medical claims data to identify episodes of hospitalizations in patients with COPD. Pharmacoepidemiol Drug Saf. 2006;15(1):19–29. doi: 10.1002/pds.1131. [DOI] [PubMed] [Google Scholar]
- Chu YT, Ng YY, Wu SC. Comparison of different comorbidity measures for use with administrative data in predicting short- and long-term mortality. BMC Health Serv Res. 2010;10:140. doi: 10.1186/1472-6963-10-140. [DOI] [PMC free article] [PubMed] [Google Scholar]
- Tamblyn R, Lavoie G, Petrella L, Monette J. The use of prescription claims databases in pharmacoepidemiological research: the accuracy and comprehensiveness of the prescription claims database in Québec. J Clin Epidemiol. 1995;48(8):999–1009. doi: 10.1016/0895-4356(94)00234-h. [DOI] [PubMed] [Google Scholar]
- Fishman PA, Goodman MJ, Hornbrook MC, Meenan RT, Bachman DJ, O’Keeffe Rosetti MC. Risk adjustment using automated ambulatory pharmacy data: the RxRisk model. Med Care. 2003;41(1):84–99. doi: 10.1097/00005650-200301000-00011. [DOI] [PubMed] [Google Scholar]
- Beck K, Trottmann M, Zweifel P. Risk adjustment in health insurance and its long-term effectiveness. J Health Econ. 2010;29(4):489–498. doi: 10.1016/j.jhealeco.2010.03.009. [DOI] [PubMed] [Google Scholar]
- Beck K. Risk insurance. Risk management in a regulated health insurance market. Haupt Verlag: Bern; 2011. [Google Scholar]
- Von Korff M, Wagner EH, Saunders K. A chronic disease score from automated pharmacy data. J Clin Epidemiol. 1992;45(2):197–203. doi: 10.1016/0895-4356(92)90016-g. [DOI] [PubMed] [Google Scholar]
- Clark DO, Von Korff M, Saunders K, Baluch WM, Simon GE. A chronic disease score with empirically derived weights. Med Care. 1995;33(8):783–795. doi: 10.1097/00005650-199508000-00004. [DOI] [PubMed] [Google Scholar]
- Chini F, Pezzotti P, Orzella L, Borgia P, Guasticchi G. Can we use the pharmacy data to estimate the prevalence of chronic conditions? a comparison of multiple data sources. BMC Public Health. 2011;11:688. doi: 10.1186/1471-2458-11-688. [DOI] [PMC free article] [PubMed] [Google Scholar]
- Maio V, Yuen E, Rabinowitz C, Louis D, Jimbo M, Donatini A, Mall S, Taroni F. Using pharmacy data to identify those with chronic conditions in Emilia Romagna, Italy. J Health Serv Res Policy. 2005;10(4):232–238. doi: 10.1258/135581905774414259. [DOI] [PubMed] [Google Scholar]
- Nielen MM, Schellevis FG, Verheij RA. Inter-practice variation in diagnosing hypertension and diabetes mellitus: a cross-sectional study in general practice. BMC Fam Pract. 2009;10:6. doi: 10.1186/1471-2296-10-6. [DOI] [PMC free article] [PubMed] [Google Scholar]
- Stock SA, Redaelli M, Wendland G, Civello D, Lauterbach KW. Diabetes–prevalence and cost of illness in Germany: a study evaluating data from the statutory health insurance in Germany. Diabet Med. 2006;23(3):299–305. doi: 10.1111/j.1464-5491.2005.01779.x. [DOI] [PubMed] [Google Scholar]
- Haring R, Völzke H, Felix SB, Schipf S, Dörr M, Rosskopf D, Nauck M, Schöfl C, Wallaschofski H. Prediction of metabolic syndrome by low serum testosterone levels in men: results from the study of health in Pomerania. Diabetes. 2009;58(9):2027–2031. doi: 10.2337/db09-0031. [DOI] [PMC free article] [PubMed] [Google Scholar]
- Johnsen SP, Pedersen L, Friis S, Blot WJ, McLaughlin JK, Olsen JH, Sørensen HT. Nonaspirin nonsteroidal anti-inflammatory drugs and risk of hospitalization for intracerebral hemorrhage: a population-based case–control study. Stroke. 2003;34(2):387–391. doi: 10.1161/01.str.0000054057.11892.5b. [DOI] [PubMed] [Google Scholar]
- Lamers LM, Vliet RC. Health-based risk adjustment Improving the pharmacy-based cost group model to reduce gaming possibilities. Eur J Health Econ. 2003;4(2):107–114. doi: 10.1007/s10198-002-0159-9. [DOI] [PubMed] [Google Scholar]
- Lamers LM, van Vliet RC. The Pharmacy-based Cost Group model: validating and adjusting the classification of medications for chronic conditions to the Dutch situation. Health Policy. 2004;68(1):113–121. doi: 10.1016/j.healthpol.2003.09.001. [DOI] [PubMed] [Google Scholar]
- Lamers LM. Risk-adjusted capitation payments: developing a diagnostic cost groups classification for the Dutch situation. Health Policy. 1998;45(1):15–32. doi: 10.1016/s0168-8510(98)00031-1. [DOI] [PubMed] [Google Scholar]
- O’Shea M, Teeling M, Bennett K. The prevalence and ingredient cost of chronic comorbidity in the Irish elderly population with medication treated type 2 diabetes: a retrospective cross-sectional study using a national pharmacy claims database. BMC Health Serv Res. 2013;13:23. doi: 10.1186/1472-6963-13-23. [DOI] [PMC free article] [PubMed] [Google Scholar]
- Kuo RN, Dong YH, Liu JP, Chang CH, Shau WY, Lai MS. Predicting healthcare utilization using a pharmacy-based metric with the WHO’s Anatomic Therapeutic Chemical algorithm. Med Care. 2011;49(11):1031–1039. doi: 10.1097/MLR.0b013e31822ebe11. [DOI] [PubMed] [Google Scholar]
- WHO Collaborating Centre for Drug Statistics Methodology. Anatomical Therapeutic Chemical (ATC) Classification System. Guidelines for ATC classification and DDD assignment 2011. 2010. Available from: http://www.whocc.no/filearchive/publications/2011guidelines.pdf; cited 11 July 2012.
- WHO. Global Status Report on Noncommunicable Diseases 2010. 2010. Available from: http://whqlibdoc.who.int/publications/2011/9789240686458_eng.pdf; cited 11 July 2012.
- Micheli A, Mugno E, Krogh V, Quinn MJ, Coleman M, Hakulinen T, Gatta G, Berrino F, Capocaccia R. EUROPREVAL Working Group. Cancer prevalence in European registry areas. Ann Oncol. 2002;13(6):840–865. doi: 10.1093/annonc/mdf127. [DOI] [PubMed] [Google Scholar]
- WHO International Agency for Research on Cancer IARC. GLOBOCAN Cancer Prevalence, Incidence and Mortality Worldwide. Available from: http://globocan.iarc.fr/; cited 26 November 2012.
- Pechère-Bertschi A, Greminger P, Hess L, Philippe J, Ferrari P. Swiss Hypertension and Risk Factor Program (SHARP): cardiovascular risk factors management in patients with type 2 diabetes in Switzerland. Blood Press. 2005;14(6):337–344. doi: 10.1080/08037050500340018. [DOI] [PubMed] [Google Scholar]
- Firmann M, Mayor V, Vidal PM, Bochud M, Pécoud A, Hayoz D, Paccaud F, Preisig M, Song KS, Yuan X, Danoff TM, Stirnadel HA, Waterworth D, Mooser V, Waeber G, Vollenweider P. The CoLaus study: a population-based study to investigate the epidemiology and genetic determinants of cardiovascular risk factors and metabolic syndrome. BMC Cardiovasc Disord. 2008;17(8):6. doi: 10.1186/1471-2261-8-6. [DOI] [PMC free article] [PubMed] [Google Scholar]
- Guessous I, Bochud M, Theler JM, Gaspoz JM, Pechère-Bertschi A. 1999–2009 Trends in prevalence, unawareness, treatment and control of hypertension in Geneva. Switzerland. PLoS One. 2012;7(6):e39877. doi: 10.1371/journal.pone.0039877. [DOI] [PMC free article] [PubMed] [Google Scholar]
- Kaiser A, Vollenweider P, Waeber G, Marques-Vidal P. Prevalence, awareness and treatment of type 2 diabetes mellitus in Switzerland: the CoLaus study. Diabet Med. 2012;29(2):190–197. doi: 10.1111/j.1464-5491.2011.03422.x. [DOI] [PubMed] [Google Scholar]
- Bopp M, Zellweger U, Faeh D. Routine data sources challenge international diabetes Federation extrapolations of national diabetes prevalence in Switzerland. Diabetes Care. 2011;34(11):2387–2389. doi: 10.2337/dc11-0157. [DOI] [PMC free article] [PubMed] [Google Scholar]
- Rizza A, Kaplan V, Senn O, Rosemann T, Bhend H, Tandjung R. FIRE study group. Age- and gender-related prevalence of multimorbidity in primary care: the Swiss FIRE project. BMC Fam Pract. 2012;13:113. doi: 10.1186/1471-2296-13-113. [DOI] [PMC free article] [PubMed] [Google Scholar]
- Firmann M, Marques-Vidal P, Paccaud F, Mooser V, Rodondi N, Waeber G, Vollenweider P. Prevalence, treatment and control of dyslipidaemia in Switzerland: still a long way to go. Eur J Cardiovasc Prev Rehabil. 2010;17(6):682–687. doi: 10.1097/HJR.0b013e32833a09ab. [DOI] [PubMed] [Google Scholar]
- Bridevaux PO, Probst-Hensch NM, Schindler C, Curjuric I, Felber Dietrich D, Braendli O, Brutsche M, Burdet L, Frey M, Gerbase MW, Ackermann-Liebrich U, Pons M, Tschopp JM, Rochat T, Russi EW. Prevalence of airflow obstruction in smokers and never-smokers in Switzerland. Eur Respir J. 2010;36(6):1259–1269. doi: 10.1183/09031936.00004110. [DOI] [PubMed] [Google Scholar]
- Bridevaux PO, Gerbase MW, Probst-Hensch NM, Schindler C, Gaspoz JM, Rochat T. Long-term decline in lung function, utilisation of care and quality of life in modified GOLD stage 1 COPD. Thorax. 2008;63(9):768–774. doi: 10.1136/thx.2007.093724. [DOI] [PubMed] [Google Scholar]
- Heidemann C, Kroll L, Icks A, Lampert T, Scheidt-Nave C. Prevalence of known diabetes in German adults aged 25–69 years: results from national health surveys over 15 years. Diabet Med. 2009;26(6):655–658. doi: 10.1111/j.1464-5491.2009.02739.x. [DOI] [PubMed] [Google Scholar]
- Ubink-Veltmaat LJ, Bilo HJ, Groenier KH, Houweling ST, Rischen RO, Meyboom-de Jong B. Prevalence, incidence and mortality of type 2 diabetes mellitus revisited: a prospective population-based study in The Netherlands (ZODIAC-1) Eur J Epidemiol. 2003;18(8):793–800. doi: 10.1023/a:1025369623365. [DOI] [PubMed] [Google Scholar]
- Masoli M, Fabian D, Holt S, Beasley R. Global Initiative for Asthma (GINA) Program. The global burden of asthma: executive summary of the GINA Dissemination Committee report. Allergy. 2004;59(5):469–478. doi: 10.1111/j.1398-9995.2004.00526.x. [DOI] [PubMed] [Google Scholar]
- Wolff JL, Starfield B, Anderson G. Prevalence, expenditures, and complications of multiple chronic conditions in the elderly. Arch Intern Med. 2002;162(20):2269–2276. doi: 10.1001/archinte.162.20.2269. [DOI] [PubMed] [Google Scholar]
- Fortin M, Stewart M, Poitras ME, Almirall J, Maddocks H. A systematic review of prevalence studies on multimorbidity: toward a more uniform methodology. Ann Fam Med. 2012;10(2):142–151. doi: 10.1370/afm.1337. [DOI] [PMC free article] [PubMed] [Google Scholar]
- Danon-Hersch N, Marques-Vidal P, Bovet P, Chiolero A, Paccaud F, Pécoud A, Hayoz D, Mooser V, Waeber G, Vollenweider P. Prevalence, awareness, treatment and control of high blood pressure in a Swiss city general population: the CoLaus study. Eur J Cardiovasc Prev Rehabil. 2009;16(1):66–72. doi: 10.1097/HJR.0b013e32831e9511. [DOI] [PubMed] [Google Scholar]
- Lloyd-Jones DM, Leip EP, Larson MG, D’Agostino RB, Beiser A, Wilson PW, Wolf PA, Levy D. Prediction of lifetime risk for cardiovascular disease by risk factor burden at 50 years of age. Circulation. 2006;113(6):791–798. doi: 10.1161/CIRCULATIONAHA.105.548206. [DOI] [PubMed] [Google Scholar]
- Johnson ML, Pietz K, Battleman DS, Beyth RJ. Prevalence of comorbid hypertension and dyslipidemia and associated cardiovascular disease. Am J Manag Care. 2004;10(12):926–932. [PubMed] [Google Scholar]
- Sowers JR. Treatment of hypertension in patients with diabetes. Arch Intern Med. 2004;164(17):1850–1857. doi: 10.1001/archinte.164.17.1850. [DOI] [PubMed] [Google Scholar]
- Yusuf S, Hawken S, Ounpuu S, Dans T, Avezum A, Lanas F, McQueen M, Budaj A, Pais P, Varigos J, Lisheng L. INTERHEART Study Investigators. Effect of potentially modifiable risk factors associated with myocardial infarction in 52 countries (the INTERHEART study): case–control study. Lancet. 2004;364(9438):937–952. doi: 10.1016/S0140-6736(04)17018-9. [DOI] [PubMed] [Google Scholar]
- Miller M. Dyslipidemia and cardiovascular risk: the importance of early prevention. QJM. 2009;102(9):657–667. doi: 10.1093/qjmed/hcp065. [DOI] [PMC free article] [PubMed] [Google Scholar]
- Sowers JR, Epstein M, Frohlich ED. Diabetes, hypertension, and cardiovascular disease: an update. Hypertension. 2001;37(4):1053–1059. doi: 10.1161/01.hyp.37.4.1053. [DOI] [PubMed] [Google Scholar]
- Malone DC, Billups SJ, Valuck RJ, Carter BL. Development of a chronic disease indicator score using a Veterans Affairs Medical Center medication database. IMPROVE Investigators. J Clin Epidemiol. 1999;52(6):551–557. doi: 10.1016/s0895-4356(99)00029-3. [DOI] [PubMed] [Google Scholar]
- Ellis RP, Pope GC, Iezzoni L, Ayanian JZ, Bates DW, Burstin H, Ash AS. Diagnosis-based risk adjustment for Medicare capitation payments. Health Care Financ Rev. 1996;17(3):101–128. [PMC free article] [PubMed] [Google Scholar]
- Federal Office of Public Health. Inclusion of an additional morbidity factor in the risk equalization. 2007. Available from: http://www.bag.admin.ch/themen/krankenversicherung/00295/12845/index.html?lang=de; cited 24 April 2012.
- Beck K, Spycher S, Holly A, Gardiol L. Risk adjustment in Switzerland. Health Policy. 2003;65(1):63–74. doi: 10.1016/s0168-8510(02)00117-3. [DOI] [PubMed] [Google Scholar]
- Spycher S. Risk equalization in health insurance. Need to design and effects. Haupt Verlag: Bern; 2002. [Google Scholar]
- van de Ven WP, Beck K, Buchner F, Chernichovsky D, Gardiol L, Holly A, Lamers LM, Schokkaert E, Shmueli A, Spycher S, Van de Voorde C, van Vliet RC, Wasem J, Zmora I. Risk adjustment and risk selection on the sickness fund insurance market in five European countries. Health Policy. 2003;65(1):75–98. doi: 10.1016/s0168-8510(02)00118-5. [DOI] [PubMed] [Google Scholar]