

Abstract
Background
Salmonella enterica subsp. enterica serovars Typhimurium (S. Typhimurium) and Heidelberg (S. Heidelberg) are major causes of foodborne salmonellosis, accounting for a fifth of all annual salmonellosis cases in the United States. Rapid, efficient and accurate methods for identification are required for routine surveillance and to track specific strains during outbreaks. We used Pulsed-field Gel Electrophoresis (PFGE) and a recently developed molecular subtyping approach termed CRISPR-MVLST that exploits the hypervariable nature of virulence genes and Clustered Regularly Interspaced Short Palindromic Repeats (CRISPRs) to subtype clinical S. Typhimurium and S. Heidelberg isolates.
Results
We analyzed a broad set of 175 S. Heidelberg and S. Typhimurium isolates collected over a five-year period. We identified 21 Heidelberg Sequence Types (HSTs) and 37 Typhimurium STs (TSTs) that were represented by 27 and 45 PFGE pulsotypes, respectively, and determined the discriminatory power of each method.
Conclusions
For S. Heidelberg, our data shows that combined typing by both CRISPR-MVLST and PFGE provided a discriminatory power of 0.9213. Importantly, CRISPR-MVLST was able to separate common PFGE patterns such as JF6X01.0022 into distinct STs, thus providing significantly greater discriminatory power. Conversely, we show that subtyping by either CRISPR-MVLST or PFGE independently provides a sufficient discriminatory power (0.9345 and 0.9456, respectively) for S. Typhimurium. Additionally, using isolates from two S. Typhimurium outbreaks, we demonstrate that CRISPR-MVLST provides excellent epidemiologic concordance.
Keywords: CRISPR subtyping, CRISPR-MVLST, Molecular subtyping, Salmonella Heidelberg, Salmonella Typhimurium
Background
Non-typhoidal Salmonella are one of the leading causes of bacterial foodborne disease in the United States, accounting for over a million human cases each year [1]. Salmonellosis symptoms include diarrhea, fever and abdominal cramps that occur 12 to 72 hours after infection. Annually, Salmonella is responsible for an estimated 20,000 hospitalizations and nearly 400 deaths in the United States, with a financial burden of approximately $3.3 – 4.4 billion [2,3]. Most infections are transmitted via ingestion of contaminated food and, unlike trends with other bacterial foodborne pathogens, the annual incidence rate of salmonellosis has not significantly declined over the past decade. Since 2006, nearly a fifth of all salmonellosis cases in the United States were caused by Salmonella enterica subsp. enterica serovars Typhimurium (S. Typhimurium) and Heidelberg (S. Heidelberg) [4]. According to the Centers for Disease Control and Prevention, there have already been two outbreaks in 2013 where S. Typhimurium and S. Heidelberg were responsible [5,6].
To limit and reduce the scope of a Salmonella outbreak, an efficient and robust surveillance system is vital. During epidemiological investigations Salmonella isolates are serotyped and concurrently subtyped to classify isolates to the strain level. An ideal subtyping method has a high discriminatory power (i.e. can separate all unrelated strains) but is not so discriminatory that it inadvertently separates isolates that are part of the same outbreak (i.e. possesses high epidemiologic concordance). There are several molecular-based subtyping approaches that have been developed, including pulsed-field gel electrophoresis (PFGE) [7], amplified fragment length polymorphism (AFLP) [8-10], multiple-locus variable-number tandem-repeat analysis (MLVA) [11-17], multiple amplification of prophage locus typing (MAPLT) [13,18] and, most recently, a multiplex DNA suspension array [19]. PFGE was adapted to Salmonella in the 1990s and generally provides a high discriminatory power for subtyping most Salmonella serovars, though it certainly does not provide equal sensitivity across all serovars [20]. Despite being labor-intensive and time-consuming, conventional serotyping and concurrent PFGE fingerprinting is still considered the gold standard for Salmonella subtyping and is widely used by public health surveillance laboratories [21-23]. Although PFGE data are uploaded to PulseNet USA (http://www.cdc.gov/pulsenet), the national electronic network for food disease surveillance that is coordinated by the CDC, inter-laboratory comparisons of PFGE fingerprints can be ambiguous.
There are several different PFGE patterns, or pulsotypes, though most often a limited number of common patterns are associated with the majority of isolates within a given serovar. Two recent S. Typhimurium and S. Heidelberg foodborne outbreaks in the United States involved contaminated cantaloupe melons (S. Typhimurium, 2012; 228 reported illnesses) [24] and broiled chicken livers (S. Heidelberg, 2011; 190 reported illnesses) [25]. In both cases, the individual XbaI PFGE patterns associated with each strain were fairly common: for S. Typhimurium, the associated PFGE pattern is typically seen in 10–15 cases per month [24] and for S. Heidelberg, the pattern occurs even more frequently, 30–40 cases per month [25]. Consequently, identification of the outbreak strains was particularly difficult and to more accurately identify isolates that were part of the S. Typhimurium cantaloupe outbreak, these isolates were also analyzed by MVLA to define the outbreak strain. Additionally, another S. Heidelberg outbreak in 2011, linked to ground turkey, involved isolates with two similar but distinctly different PFGE patterns, thus showing reduced epidemiologic concordance by this subtyping method [26]. This last example may indicate evolutionary relatedness between the two sets of isolates which, unlike some methods, PFGE cannot really provide.
The recent outbreak cases described above highlight the need for additional subtyping approaches for Salmonella that can be used instead of, or as a complement to PFGE for routine disease surveillance and outbreak tracking. Clustered Regularly Interspaced Short Palindromic Repeats (CRISPRs) are found in ~50% of all bacterial species, including Salmonella[27]. CRISPR elements comprise several unique short sequences, called spacers, which are interspaced by conserved direct repeats. In some bacteria, homology between a spacer and a complementary target nucleic acid results in degradation of the target by sequence-specific endonucleases, providing protection from exogenous bacteriophage or plasmid DNA [reviewed in [28]. Due to both acquisition and loss of these spacer elements, CRISPRs represent arguably the most rapidly evolving prokaryotic loci [29-31].
Sequence analysis of CRISPR loci has been used to subtype clinical isolates of Salmonella[32-34], Escherichia coli[35,36], group A Streptococcus[37] and Campylobacter species [38]. Salmonella contains two of these non-coding loci, which are comprised of direct repeats of 29 nucleotides separated by spacers of 32 nucleotides (Figure 1). Generally, CRISPR polymorphisms between Salmonella strains are due to deletion or repetition of one or more spacers, termed ‘spacer microevolution’ [32-34,39,40]. An extensive investigation of 738 isolates, representing several different serovars, showed that polymorphisms within the CRISPR loci correlate highly with serovar, with isolates from individual serovars bearing distinct CRISPR patterns [32].
Figure 1.

Salmonella CRISPR loci.Salmonella have two CRISPR loci, CRISPR1 and CRISPR2 comprised of direct repeats of 29 nucleotides (black diamonds) separated by spacers (empty rectangles). There is an A-T rich leader sequence upstream of each locus (shaded rectangle) and the CRISPR-associated genes (cas) are upstream of the CRISPR1 locus (grey boxed arrow). Primers used for amplification are shown in blue and red for CRISPR1 and CRISPR2, respectively.
We recently developed a sequence-based subtyping assay (multi-virulence locus sequence typing; MVLST) for Salmonella that involves the sequencing of two virulence genes, fimH1 (fimH) and sseL, in addition to CRISPR sequencing [33]. Preliminary studies showed that this approach, termed CRISPR-MVLST, provided better discrimination than either CRISPR or MVLST alone and, importantly, exhibited strong epidemiologic concordance among eight out of nine of the most common illness-causing Salmonella enterica serovars [33], including both S. Heidelberg and S. Typhimurium outbreak strains. Subsequently, among a large number of clinical isolates of the highly clonal S. Enteritidis, a combination of CRISPR-MVLST and PFGE was required to provide a sufficient discriminatory power [34]. Among a large set of S. Newport clinical isolates, CRISPR-MVLST provides similar discrimination to PFGE [41].
To further determine the functionality of this new subtyping approach, we investigated the discriminatory power of both CRISPR-MVLST and PFGE among a larger and unbiased collection of clinical S. Typhimurium and S. Heidelberg isolates that were collected over a five year period. We show here that a combination of both CRISPR-MVLST and PFGE is required to achieve an appropriate discriminatory power for S. Heidelberg. For S. Typhimurium, both subtyping methods independently provide a discriminatory power >0.94. Importantly, as one of the first applications of CRISPR-MVLST to analyze isolates that were part of an outbreak, we were able to cluster two different S. Typhimurium outbreak strains.
Results
Results of CRISPR-MVLST
To more accurately determine the discriminatory power of CRISPR-MVLST and PFGE for S. Heidelberg and S. Typhimurium, we subtyped 89 and 86 isolates, respectively, that were obtained from the Pennsylvania Department of Health (Table 1). Among the 175 total isolates analyzed, we identified 29 CRISPR1 alleles, 31 CRISPR2 alleles, 6 fimH alleles and 7 sseL alleles (Table 2). Of these, we found 27, 30, 2 and 4 alleles, respectively, that were novel and not seen in our previous data sets [33]. In total, these alleles defined 58 novel sequence types among the two serovars (Tables 3 and 4). The overwhelming sequence-type diversity among both of these prevalent serovars is provided by genetic variability in the CRISPR loci, rather than in either fimH or sseL (Figure 2). We found that 88/89 S. Heidelberg isolates had fimH allele 7 and in S. Typhimurium there were two predominant fimH alleles, allele 6 (52/86 isolates) and allele 8 (28/86 isolates). Similarly, in S. Heidelberg, 88/89 isolates bore sseL allele 19 and in S. Typhimurium, 73/86 isolates had sseL allele 15. The polymorphisms between different sseL or fimH alleles arise from the presence of SNPs with the exception of allele 63 that has a single base insertion. No alleles for any of the four markers were shared among the two different serovars, consistent with previously published studies [32-34].
Table 1.
List of 175 S. Heidelberg and S. Typhimurium isolates from the Pennsylvania Department of Health that were analyzed in this study
| Isolate | Sequence type | PFGE pattern | PA region | Isolation date |
|---|---|---|---|---|
|
S. Heidelberg
|
|
|
|
|
| 06E00444 |
HST 7 |
JF6X01.0022 |
SE |
Mar-06 |
| 06E00726 |
HST 7 |
JF6X01.0022 |
SE |
Jun-06 |
| 06E01437 |
HST 7 |
JF6X01.0022 |
SE |
Aug-06 |
| 07E00466 |
HST 7 |
JF6X01.0022 |
SE |
Apr-07 |
| 07E00768 |
HST 7 |
JF6X01.0022 |
NC |
May-07 |
| 07E01405 |
HST 7 |
JF6X01.0022 |
SE |
Aug-07 |
| 07E01505 |
HST 7 |
JF6X01.0022 |
SE |
Aug-07 |
| 08E00753 |
HST 7 |
JF6X01.0022 |
NE |
Jun-08 |
| 08E01373 |
HST 7 |
JF6X01.0022 |
SE |
Aug-08 |
| 09E00637 |
HST 7 |
JF6X01.0022 |
SE |
Mar-09 |
| 09E00701 |
HST 7 |
JF6X01.0022 |
SE |
Mar-09 |
| 09E00750 |
HST 7 |
JF6X01.0022 |
SE |
Apr-09 |
| 09E00782 |
HST 7 |
JF6X01.0022 |
SE |
Apr-09 |
| 09E01149 |
HST 7 |
JF6X01.0022 |
SE |
May-09 |
| 09E01511 |
HST 7 |
JF6X01.0022 |
SE |
Jun-09 |
| M09019838001A |
HST 7 |
JF6X01.0022 |
SE |
Aug-09 |
| M10003150001A |
HST 7 |
JF6X01.0022 |
SE |
Jan-10 |
| M10014816001A |
HST 7 |
JF6X01.0022 |
SE |
Jun-10 |
| M10016406001A |
HST 7 |
JF6X01.0022 |
SE |
Jul-10 |
| M10022189001A |
HST 7 |
JF6X01.0022 |
SE |
Sep-10 |
| M11012103001A |
HST 7 |
JF6X01.0022 |
SW |
Apr-11 |
| M11017212001A |
HST 7 |
JF6X01.0022 |
SE |
Jul-11 |
| M11021620001A |
HST 7 |
JF6X01.0022 |
SW |
Aug-11 |
| 06E00846 |
HST 7 |
JF6X01.0032 |
SW |
Jun-06 |
| 08E00963 |
HST 7 |
JF6X01.0033 |
SW |
Jul-08 |
| 08E01089 |
HST 7 |
JF6X01.0033 |
SE |
Jul-08 |
| 07E01378 |
HST 7 |
JF6X01.0034 |
SW |
Jul-07 |
| 08E00470 |
HST 7 |
JF6X01.0034 |
NE |
May-08 |
| 08E00508 |
HST 7 |
JF6X01.0034 |
NE |
May-08 |
| M10000626001A |
HST 7 |
JF6X01.0034 |
SW |
Dec-09 |
| 07E00964 |
HST 7 |
JF6X01.0042 |
NW |
Jun-07 |
| M11025202001A |
HST 7 |
JF6X01.0042 |
SC |
Oct-11 |
| M11027881001A |
HST 7 |
JF6X01.0042 |
NE |
Nov-11 |
| 07E01870 |
HST 7 |
JF6X01.0045 |
SC |
Sep-07 |
| M09021251001A |
HST 7 |
JF6X01.0051 |
SE |
Sep-09 |
| 09E00927 |
HST 7 |
JF6X01.0058 |
SE |
May-09 |
| 08E00342 |
HST 7 |
JF6X01.0080 |
SE |
Mar-08 |
| M11018110001A |
HST 7 |
JF6X01.0087 |
NW |
Jul-11 |
| 06E00558 |
HST 7 |
JF6X01.0122 |
NW |
|
| 07E00680 |
HST 7 |
JF6X01.0122 |
SW |
May-07 |
| 07E02336 |
HST 7 |
JF6X01.0161 |
SW |
Nov-07 |
| 07E02139 |
HST 7 |
JF6X01.0167 |
SW |
Oct-07 |
| M09033280001A |
HST 7 |
JF6X01.0221 |
SE |
Dec-09 |
| M10004098001A |
HST 7 |
JF6X01.0246 |
SE |
Feb-10 |
| 08E01461 |
HST 7 |
JF6X01.0324 |
SE |
Aug-08 |
| 09E00128 |
HST 7 |
JF6X01.0324 |
SE |
Jan-09 |
| M09015668001A |
HST 7 |
JF6X01.0326 |
SE |
Jul-09 |
| M10015955001A |
HST 7 |
JF6X01.0581 |
SW |
Jul-10 |
| 06E01523 |
HST 8 |
JF6X01.0051 |
SE |
Sep-06 |
| 08E00143 |
HST 9 |
JF6X01.0022 |
NE |
Feb-13 |
| 08E01679 |
HST 9 |
JF6X01.0022 |
SC |
Sep-08 |
| 06E01915 |
HST 9 |
JF6X01.0022 |
SC |
Oct-06 |
| 07E00349 |
HST 9 |
JF6X01.0022 |
SW |
Feb-07 |
| 07E02366 |
HST 9 |
JF6X01.0022 |
NE |
Dec-07 |
| 09E01408 |
HST 9 |
JF6X01.0022 |
SW |
Jun-09 |
| M10006052001A |
HST 9 |
JF6X01.0022 |
SW |
Mar-10 |
| M10021328001A |
HST 9 |
JF6X01.0022 |
SC |
Sep-10 |
| M11000821001A |
HST 9 |
JF6X01.0041 |
NW |
Jan-11 |
| 06E00519 |
HST 9 |
JF6X01.0052 |
NE |
Apr-06 |
| 07E00933 |
HST 10 |
JF6X01.0051 |
SC |
Jun-07 |
| 08E00107 |
HST 11 |
JF6X01.0085 |
NE |
Jan-08 |
| 09E00226 |
HST 12 |
JF6X01.0022 |
SE |
Jan-09 |
| M10020282001A |
HST 13 |
JF6X01.0034 |
NC |
Sep-10 |
| 07E02483 |
HST 14 |
JF6X01.0022 |
SC |
Dec-07 |
| 08E00103 |
HST 14 |
JF6X01.0022 |
SE |
Jan-08 |
| 07E00451 |
HST 15 |
JF6X01.0049 |
SC |
Mar-07 |
| 08E01904 |
HST 15 |
JF6X01.0049 |
SW |
Sep-08 |
| 08E01911 |
HST 15 |
JF6X01.0049 |
SW |
Oct-08 |
| 07E01400 |
HST 16 |
JF6X01.0270 |
SE |
Jul-07 |
| M10004892001A |
HST 17 |
JF6X01.0041 |
SE |
Mar-10 |
| M11005464001A |
HST 17 |
JF6X01.0041 |
SW |
Feb-11 |
| M11000267001A |
HST 17 |
JF6X01.0500 |
NW |
Dec-10 |
| M09020244001A |
HST 18 |
JF6X01.0321 |
SW |
Aug-09 |
| M09022904001A |
HST 19 |
JF6X01.0022 |
NE |
Sep-09 |
| M11020321001A |
HST 20 |
JF6X01.0042 |
SE |
Aug-11 |
| M10018092001A |
HST 21 |
JF6X01.0033 |
SW |
Aug-10 |
| M11011342001A |
HST 21 |
JF6X01.0058 |
SW |
Apr-11 |
| M11013202001A |
HST 21 |
JF6X01.0058 |
SW |
May-11 |
| M11015845001A |
HST 21 |
JF6X01.0058 |
SW |
Jun-11 |
| M11015850001A |
HST 21 |
JF6X01.0058 |
SW |
Jun-11 |
| M11023722001A |
HST 21 |
JF6X01.0058 |
SW |
Sep-11 |
| M11005685001A |
HST 21 |
JF6X01.0582 |
SW |
Feb-11 |
| M10002453001A |
HST 22 |
JF6X01.0032 |
SC |
Jan-10 |
| M09016444001A |
HST 22 |
JF6X01.0033 |
NC |
Jul-09 |
| 07E02184 |
HST 23 |
JF6X01.0042 |
SE |
Oct-07 |
| 07E01907 |
HST 24 |
JF6X01.0058 |
SW |
Sep-07 |
| 06E00416 |
HST 25 |
JF6X01.0172 |
NC |
Mar-06 |
| 06E00661 |
HST 26 |
JF6X01.0022 |
SE |
Jun-06 |
| 06E01299 |
HST 27 |
JF6X01.0022 |
SE |
Aug-06 |
|
S. Typhimurium
|
|
|
|
|
| 07E00002 |
TST 9 |
JPXX01.0177 |
|
Dec-06 |
| 07E02276 |
TST 9 |
JPXX01.0177 |
|
Nov-07 |
| 08E02063 |
TST 9 |
JPXX01.0177 |
|
Oct-08 |
| 09E00003 |
TST 9 |
JPXX01.0177 |
|
Dec-08 |
| M09023403001A |
TST 9 |
JPXX01.0177 |
|
Sep-09 |
| 07E01490 |
TST 10 |
JPXX01.0003 |
|
Aug-07 |
| 07E01769 |
TST 10 |
JPXX01.0003 |
|
Sep-07 |
| 07E02403 |
TST 10 |
JPXX01.0003 |
|
Dec-07 |
| 08E00363 |
TST 10 |
JPXX01.0003 |
|
Apr-08 |
| 09E00309 |
TST 10 |
JPXX01.0003 |
|
Jan-09 |
| M10005050001A |
TST 10 |
JPXX01.0003 |
|
Feb-10 |
| M10010138001A |
TST 10 |
JPXX01.0003 |
|
Apr-10 |
| M10023515001A |
TST 10 |
JPXX01.0003 |
|
Oct-10 |
| 07E00173 |
TST 10 |
JPXX01.0018 |
|
Jan-07 |
| 08E00006 |
TST 10 |
JPXX01.0018 |
|
Dec-07 |
| M09017753001A |
TST 10 |
JPXX01.0018 |
|
Jul-09 |
| M10003149001A |
TST 10 |
JPXX01.0018 |
|
Jan-10 |
| M10006054001A |
TST 10 |
JPXX01.0098 |
|
Mar-10 |
| 07E00658 |
TST 10 |
JPXX01.0256 |
|
Apr-07 |
| 08E00457 |
TST 10 |
JPXX01.1011 |
|
Apr-08 |
| M10018865001A |
TST 10 |
JPXX01.2731 |
|
Aug-10 |
| 07E00234 |
TST 11 |
JPXX01.0442 |
|
Feb-07 |
| M10001003001A |
TST 11 |
JPXX01.0442 |
|
Jan-10 |
| 07E00290 |
TST 12 |
JPXX01.0022 |
|
Feb-07 |
| 07E00436 |
TST 12 |
JPXX01.0146 |
|
Mar-07 |
| M09028540001A |
TST 12 |
JPXX01.0146 |
|
Oct-09 |
| M10012000001A |
TST 12 |
JPXX01.0146 |
|
May-10 |
| M11018826001A |
TST 12 |
JPXX01.0604 |
|
Jul-11 |
| 09E01310 |
TST 12 |
JPXX01.0925 |
|
May-09 |
| 08E02215 |
TST 12 |
JPXX01.1302 |
|
Nov-08 |
| 08E00255 |
TST 13 |
JPXX01.0001 |
|
Feb-08 |
| M11021986001A |
TST 13 |
JPXX01.0081 |
|
Aug-11 |
| 09E00084 |
TST 13 |
JPXX01.0111 |
|
Dec-08 |
| 07E00868 |
TST 13 |
JPXX01.0206 |
|
Jun-07 |
| 07E00568 |
TST 13 |
JPXX01.0642 |
|
Apr-07 |
| 07E00364 |
TST 13 |
JPXX01.1212 |
|
Jan-07 |
| 07E01042 |
TST 14 |
JPXX01.1393 |
|
Jun-07 |
| 07E01180 |
TST 15 |
JPXX01.0003 |
|
Jun-07 |
| 08E01211 |
TST 15 |
JPXX01.0003 |
|
Jul-08 |
| M11004438001A |
TST 15 |
JPXX01.0003 |
|
Jan-11 |
| M11016520001A |
TST 15 |
JPXX01.0070 |
|
Jun-11 |
| 07E01365 |
TST 16 |
JPXX01.0928 |
|
Jul-07 |
| 08E00877 |
TST 17 |
JPXX01.0006 |
|
Jun-08 |
| 08E01423 |
TST 17 |
JPXX01.0006 |
|
Aug-08 |
| 07E02063 |
TST 17 |
JPXX01.0146 |
|
Oct-07 |
| M09025088001A |
TST 17 |
JPXX01.0146 |
|
Oct-09 |
| M11002975001A |
TST 17 |
JPXX01.0146 |
|
Jan-11 |
| 08E01686 |
TST 17 |
JPXX01.0416 |
|
Sep-08 |
| 07E02348 |
TST 18 |
JPXX01.0018 |
|
Nov-07 |
| 08E00618 |
TST 19 |
JPXX01.0146 |
|
May-08 |
| M10000110001A |
TST 19 |
JPXX01.0146 |
|
Jan-10 |
| M10010755001A |
TST 19 |
JPXX01.0146 |
|
May-10 |
| M11025544001A |
TST 19 |
JPXX01.0146 |
|
Sep-11 |
| 08E00074 |
TST 19 |
JPXX01.0557 |
|
Jan-08 |
| M11011894001A |
TST 19 |
JPXX01.2900 |
|
Apr-11 |
| M09018928001A |
TST 20 |
JPXX01.0001 |
|
Aug-09 |
| 08E00162 |
TST 20 |
JPXX01.0014 |
|
Feb-08 |
| 09E00747 |
TST 20 |
JPXX01.0014 |
|
Apr-09 |
| M11029619001A |
TST 20 |
JPXX01.0014 |
|
Nov-11 |
| M10026894001A |
TST 20 |
JPXX01.0146 |
|
Nov-10 |
| 08E00998 |
TST 21 |
JPXX01.0604 |
|
Jul-08 |
| 08E02429 |
TST 22 |
JPXX01.1396 |
|
Dec-08 |
| 09E00422 |
TST 23 |
JPXX01.1255 |
|
Feb-09 |
| 09E00632 |
TST 24 |
JPXX01.1975 |
|
Mar-09 |
| 09E00904 |
TST 25 |
JPXX01.2016 |
|
Apr-09 |
| M09014919001A |
TST 26 |
JPXX01.0083 |
|
Jun-09 |
| M09015997001A |
TST 27 |
JPXX01.0416 |
|
Jul-09 |
| M09020496001A |
TST 28 |
JPXX01.0146 |
|
Aug-09 |
| M09021700001A |
TST 29 |
JPXX01.0552 |
|
Sep-09 |
| M10014370001A |
TST 30 |
JPXX01.0333 |
|
Jun-10 |
| M10015309001A |
TST 31 |
JPXX01.0003 |
|
Jun-10 |
| M10016817001A |
TST 32 |
JPXX01.0324 |
|
Jul-10 |
| M10025067001A |
TST 33 |
JPXX01.0359 |
|
Oct-10 |
| M10028492001A |
TST 34 |
JPXX01.0060 |
|
Dec-10 |
| M11001607001A |
TST 35 |
JPXX01.0359 |
|
Jan-11 |
| M11009301001A |
TST 36 |
JPXX01.1678 |
|
Mar-11 |
| M11012744001A |
TST 37 |
JPXX01.0013 |
|
May-11 |
| M11015184001A |
TST 38 |
JPXX01.1833 |
|
Jun-11 |
| M11022803001A |
TST 39 |
JPXX01.0146 |
|
Sep-11 |
| M10007760001A |
TST 40 |
JPXX01.2488 |
|
Apr-10 |
| M11006620001A |
TST 41 |
JPXX01.1314 |
|
Feb-11 |
| M11024498001A |
TST 42 |
JPXX01.0351 |
|
Oct-11 |
| 09E01078 |
TST 42 |
JPXX01.0781 |
|
May-09 |
| 07E00784 |
TST 56 |
JPXX01.0359 |
|
May-07 |
| 08E00321 |
TST 57 |
JPXX01.1301 |
|
Mar-08 |
| M09031352001A | TST 58 | JPXX01.0146 | Nov-09 |
The data are shown in order of Sequence Type (HST or TST) and further sorted by PFGE pattern.
Table 2.
Number of alleles identified for each of the four CRISPR-MVLST markers
| Serovar | fimH | sseL | CRISPR1 | CRISPR2 |
|---|---|---|---|---|
|
S. Heidelberg |
0 (2) |
1 (2) |
12 (12) |
7 (8) |
|
S. Typhimurium |
2 (4) |
3 (5) |
13 (15) |
19 (19) |
| Total | 2 (6) | 4 (7) | 25 (27) | 26 (27) |
The total number of alleles for each locus is listed in parentheses with the number of alleles that are new in this study, as compared to Liu et al. [33], shown to the left.
Table 3.
List of all S. H eidelberg CRISPR-MVLST S equence T ypes (HSTs) that were identified in this study
| HST | Frequency |
Allelic profile |
|||
|---|---|---|---|---|---|
| fimH | sseL | CRISPR1 | CRISPR2 | ||
| HST 7 |
48 |
17 |
19 |
167 |
32 |
| HST 8 |
1 |
17 |
19 |
168 |
209 |
| HST 9 |
10 |
17 |
19 |
167 |
209 |
| HST 10 |
1 |
17 |
19 |
169 |
32 |
| HST 11 |
1 |
17 |
19 |
170 |
32 |
| HST 12 |
1 |
17 |
19 |
171 |
32 |
| HST 13 |
1 |
18 |
19 |
167 |
32 |
| HST 14 |
2 |
17 |
19 |
179 |
32 |
| HST 15 |
3 |
17 |
19 |
167 |
212 |
| HST 16 |
1 |
17 |
19 |
173 |
213 |
| HST 17 |
3 |
17 |
19 |
172 |
32 |
| HST 18 |
1 |
17 |
19 |
178 |
32 |
| HST 19 |
1 |
17 |
67 |
174 |
209 |
| HST 20 |
1 |
17 |
19 |
175 |
32 |
| HST 21 |
7 |
17 |
19 |
167 |
211 |
| HST 22 |
2 |
17 |
19 |
167 |
210 |
| HST 23 |
1 |
17 |
19 |
177 |
32 |
| HST 24 |
1 |
17 |
19 |
167 |
214 |
| HST 25 |
1 |
17 |
19 |
176 |
32 |
| HST 26 |
1 |
17 |
19 |
177 |
215 |
| HST 27 | 1 | 17 | 19 | 167 | 215 |
The numbers represent the allelic identifier for the individual CRISPR-MVLST markers. The combination of four specific alleles defines a given HST. The frequency is the number of times a particular HST was observed among the 89 S. Heidelberg isolates analyzed. All HSTs identified here were new and not seen in previous studies.
Table 4.
List of all S. T yphiurium CRISPR-MVLST S equence T ypes (TSTs) that were identified in this study
| TST | Frequency |
Allelic profile |
|||
|---|---|---|---|---|---|
| fimH | sseL | CRISPR1 | CRISPR2 a | ||
| TST 9 |
5 |
6 |
15 |
129 |
159* |
| TST 10 |
16 |
8 |
15 |
11 |
160 |
| TST 11 |
2 |
6 |
15 |
10 |
163* |
| TST 12 |
7 |
6 |
15 |
10 |
164* |
| TST 13 |
6 |
6 |
15 |
129 |
162 |
| TST 14 |
1 |
6 |
15 |
129 |
165 |
| TST 15 |
4 |
8 |
15 |
11 |
161 |
| TST 16 |
1 |
8 |
61 |
11 |
160 |
| TST 17 |
6 |
6 |
15 |
10 |
167* |
| TST 18 |
1 |
8 |
20 |
131 |
160 |
| TST 19 |
6 |
6 |
62 |
10 |
164* |
| TST 20 |
5 |
49 |
15 |
129 |
162 |
| TST 21 |
1 |
6 |
15 |
132 |
164* |
| TST 22 |
1 |
6 |
15 |
10 |
168* |
| TST 23 |
1 |
8 |
20 |
11 |
160 |
| TST 24 |
1 |
6 |
15 |
133 |
167* |
| TST 25 |
1 |
50 |
20 |
134 |
169* |
| TST 26 |
1 |
6 |
15 |
10 |
170* |
| TST 27 |
1 |
6 |
15 |
10 |
171* |
| TST 28 |
1 |
6 |
15 |
10 |
172* |
| TST 29 |
1 |
8 |
62 |
11 |
160 |
| TST 30 |
1 |
6 |
15 |
137 |
174 |
| TST 31 |
1 |
8 |
15 |
11 |
175 |
| TST 32 |
1 |
6 |
15 |
135 |
162 |
| TST 33 |
1 |
6 |
15 |
138 |
177* |
| TST 34 |
1 |
8 |
15 |
139 |
161 |
| TST 35 |
1 |
6 |
15 |
140 |
178* |
| TST 36 |
1 |
8 |
63 |
11 |
160 |
| TST 37 |
1 |
6 |
15 |
141 |
162 |
| TST 38 |
1 |
6 |
15 |
10 |
179* |
| TST 39 |
1 |
6 |
15 |
10 |
180* |
| TST 40 |
1 |
6 |
15 |
142 |
173* |
| TST 41 |
1 |
8 |
20 |
143 |
166 |
| TST 42 |
2 |
6 |
15 |
10 |
181** |
| TST 56 |
1 |
6 |
15 |
130 |
173* |
| TST 57 |
1 |
6 |
15 |
10 |
205** |
| TST 58 |
1 |
6 |
15 |
136 |
164* |
| TST 59 |
- |
6 |
62 |
10 |
207* |
| TST 60 | - | 6 | 15 | 166 | 208* |
The numbers represent the allelic identifier for the individual CRISPR-MVLST markers. The combination of four specific alleles defines a given HST. The frequency is the number of times a particular TST was observed among the 86 S. Typhimurium isolates analyzed in the first study and does not include the frequency of TSTs that were seen in the outbreak study. All TSTs identified here were new and not seen in previous studies. aSome CRISPR2 alleles required more than two sequencing primers to cover the whole length of the array. Alleles that required three primers are noted with * and the two isolates that required seven primers to sequence CRISPR2 are noted with **. The position of these primers is shown in Additional file 1.
Figure 2.
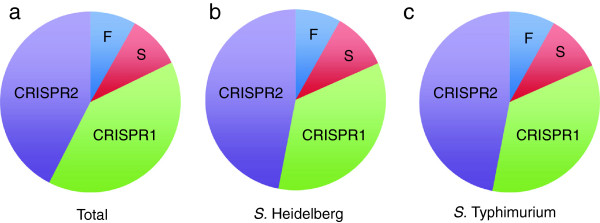
Contribution of allele number for each marker. Pie charts showing the combined total number of different alleles identified at all four loci. The contribution of each marker to this total is shown for a) combined all alleles from both S. Heidelberg and S. Typhimurium, b)S. Heidelberg and c)S. Typhimurium. F – fimH; S – sseL.
S. Heidelberg analysis and sequence type distribution
CRISPR-MVLST analysis of 89 S. Heidelberg clinical isolates (representing 27 unique PFGE patterns) resulted in 21 unique S. Heidelberg Sequence Types (HSTs), HST 7 – HST 27 (Table 3). In total, we identified 12 CRISPR1 alleles, 8 CRISPR2 alleles, 2 fimH alleles and 2 sseL alleles (Table 2). As shown in Figure 2b, most of the allelic diversity comes from the CRISPR1 and CRISPR2 loci. All 12 CRISPR1 alleles and seven of the eight CRISPR2 alleles were new, compared to our previous studies [33]. We did not find any new fimH alleles in our dataset and only one of the two sseL alleles was new. The most frequent ST was HST7, occurring in 49/89 isolates (54%).
Discriminatory power of CRISPR-MVLST and PFGE in S. Heidelberg isolates
The discriminatory power of CRISPR-MVLST among the S. Heidelberg isolates was calculated to be 0.6931 (Figure 3a). The discriminatory power provided by PFGE among the same isolates was 0.8149 (Figure 3b). Given these low values and insufficient discriminatory power (an ideal discriminatory power is >0.95) [42], we combined the two typing methods. This combination provided 44 unique groups with a more satisfactory discriminatory power of 0.9213 (Figure 3c), suggesting a 92% confidence in ability to separate unrelated isolates.
Figure 3.

Frequency of S. Heidelberg subtype prevalence generated by CRISPR-MVLST and PFGE. Pie charts showing the number and frequency of distinct subtypes defined by a) CRISPR-MVLST, b) PFGE and c) the combination of CRISPR-MVLST and PFGE among 89 S. Heidelberg isolates. The most frequent subtypes for each method are indicated; .0022 and .0058 represent PFGE profiles JF6X01.0022 and JF6X01.0058, respectively. The number of distinct subtypes defined by each method is listed in parenthesis and the discriminatory power (D) is listed below. d) CRISPR-MVLST is able to separate the most common S. Heidelberg PFGE pattern JF6X01.0022 into 7 distinct sequence types.
Separation of common S. Heidelberg subtypes
Among the S. Heidelberg isolates analyzed, the most frequent PFGE pulsotype was JF6X01.0022 (42%). We were able to further subtype isolates with JF6X01.0022 pattern into 7 distinct HSTs - HST 7, 9, 12, 14, 19, 26 and 27 (Figure 3d). Among JF6X01.0022 isolates, the two most common HSTs were HST7 (62%) and HST9 (22%). JF6X01.0058 is also fairly common, occurring in 8% of isolates studied. With these isolates, we were able to further subtype them into 3 distinct HSTs – HST 7, 21 and 24, with HST21 being the most common (71%). Conversely, over half the isolates analyzed have HST 7 (54%), but by PFGE analysis, these are represented by 18 different PFGE patterns, the most frequent being JF6X01.0022 (48%). Collectively, this data highlights the strengths and weakness of each subtyping method.
S. Typhimurium analysis and sequence type distribution
CRISPR-MVLST analysis of 86 S. Typhimurium clinical isolates (representing 45 unique PFGE patterns) resulted in the identification of 37 unique and novel S. Typhimurium Sequence Types (TSTs), TST9 – TST41, and TST56 – TST58 (Table 4). This included 17 CRISPR1, 23 CRISPR2, 4 fimH and 5 sseL alleles (Table 2). Of these, the majority of CRISPR1 alleles were new (15/17 alleles) and all CRISPR2 alleles were new (23/23), as compared to our previous studies [33]. As with S. Heidelberg, the majority of unique sequence types were defined by polymorphisms in either or both of the CRISPR loci (Figure 2c).
Discriminatory power of CRISPR-MVLST and PFGE in S. Typhimurium isolates
The discriminatory power of CRISPR-MVLST among the S. Typhimurium isolates was 0.9415 (Figure 4a). This means that there would be a 94% probability that two unrelated isolates could be separated using the CRISPR-MVLST scheme. Similarly, for PFGE, the discriminatory power among these isolates is 0.9486 (Figure 4b). These values suggest that either method can provide sufficient discrimination between outbreak and non-outbreak S. Typhimurium strains.
Figure 4.
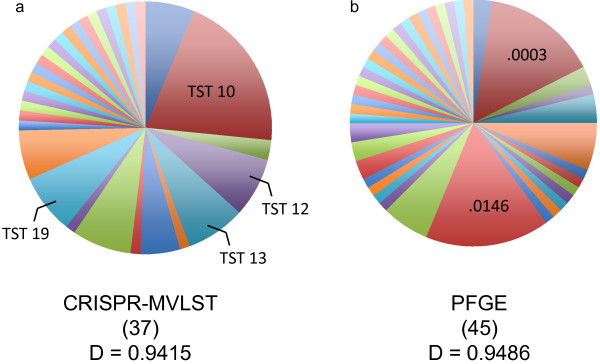
Frequency of S. Typhimurium subtype prevalence generated by CRISPR-MVLST and PFGE. Pie charts showing the number of distinct subtypes defined by a) CRISPR-MVLST and b) PFGE among 86 S. Typhimurium isolates. The most frequent TSTs or PFGE patterns observed are indicated. .0003 and .0146 represent PFGE profiles JPXX01.0003 and JPXX01.0146, respectively. The number of distinct subtypes defined by each method is listed in parenthesis and the discriminatory power (D) is listed below.
Correlation between different TSTs and PFGE patterns
We next wanted to investigate whether any correlation existed between TSTs and PFGE patterns. To accomplish this, we first determined the relationship among different TSTs. BURST analysis of all 37 TSTs generated four groups (Figure 5a). Of these, Groups 1–3 contain 6 – 15 TSTs. Group 4 consists of only two TSTs and BURST was unable to assign a core TST. There was also a collection of five singletons that BURST did not assign to a group. For Groups 1–3, each group comprises a core TST surrounded by TSTs that differ from the core by one allele. The number of rings in the group demonstrates the number of allele differences from the core. For example, in Group 1 TSTs 9, 37, 32, 20, and 14 each differ by one allele at one locus from the core TST, TST 13. For group 3, TST 10 is the core TST and TSTs 15, 31, 36, 29, 23 and 16 each differ from TST 10 at one locus. TST 34, in the outer ring differs from the TSTs in the middle ring at one locus and from the core at two loci.
Figure 5.

Correlation of CRISPR-MVLST and PFGE. a) BURST analysis of 37 TSTs identified in this study shows the relationship between different TSTs. Within a BURST group, the TSTs within one ring differ from TSTs in an adjacent ring at one of the four CRISPR-MVLST loci. TSTs that could not be assigned to a group are listed as singletons. Individual PFGE patterns that are found in isolates that have different TSTs are shown in color and the PFGE pulsotype is indicated as the numbers after JPXX01, i.e. JPXX01.0604 is shown as .0604. b) Dendrogram showing the levels of similarity between the 45 different PFGE patterns identified. All the PFGE patterns that are found in isolates with TSTs in Groups 1–3 are shaded in the corresponding color. The blue asterix represents TST 20, which is in Group 1.
To investigate whether there was any relationship between CRISPR-MVLST sequence type and PFGE patterns, we overlaid our PFGE data to identify isolates from different TSTs that have the same PFGE pattern. Figure 5a shows that there were seven PFGE pulsotypes that could be further separated into TSTs. In the majority of instances (5/7), identical PFGE patterns were found in isolates that had closely related TSTs such as JPXX01.0003 and JPXX01.0604 (TSTs 15, 31, 10 and TSTs 12 and 21, respectively).
Following this, we then generated a dendrogram using the Dice coefficient to determine the relationship between different PFGE pulsotypes. For clarity, we color-coded the PFGE patterns according to the BURST Group shown in Figure 5a. As can be seen in Figure 5b, closely related CRISPR-MVLST sequence types have similar PFGE patterns.
CRISPR-MVLST analysis of S. Typhimurium outbreak isolates
Since CRISPR-MVLST and PFGE exhibit a similarly high discriminatory ability in S. Typhimurium, we wanted to investigate the utility of the former for separating outbreak isolates. We obtained 30 S. Typhimurium isolates from the Pennsylvania Department of Health (Table 5). Ten of these were isolates associated with an outbreak in 2004 with the cluster designation 0411PAJPX-1c. All affected persons were on a bus trip together, though the outbreak source was never identified. The remaining 20 isolates comprised 10 isolates that were linked to a 2009 live poultry outbreak (cluster 0905PAJPX-1) and 10 control isolates that were isolated in the same year but were not part of any classified outbreaks.
Table 5.
List of 30 S. Typhimurium isolates used in the outbreak study
| Isolate | Sequence type | PFGE-pattern ( Xba I) | PFGE pattern ( Bln I) | Outbreak cluster |
|---|---|---|---|---|
| 04E02240 |
TST 59 |
JPXX01.0146 |
JPXA26.0172 |
0411PAJPX-1c |
| 04E02241 |
TST 59 |
JPXX01.0146 |
JPXA26.0294 |
0411PAJPX-1c |
| 04E02243 |
TST 59 |
JPXX01.0146 |
JPXA26.0172 |
0411PAJPX-1c |
| 04E02295 |
TST 59 |
JPXX01.0146 |
JPXA26.0172 |
0411PAJPX-1c |
| 04E02296 |
TST 59 |
JPXX01.0146 |
JPXA26.0172 |
0411PAJPX-1c |
| 04E02297 |
TST 59 |
JPXX01.0146 |
JPXA26.0172 |
0411PAJPX-1c |
| 04 F00368 |
TST 59 |
JPXX01.0146 |
JPXA26.0172 |
0411PAJPX-1c |
| 04 F00376 |
TST 59 |
JPXX01.0146 |
JPXA26.0172 |
0411PAJPX-1c |
| 04 F00381 |
TST 59 |
JPXX01.0146 |
JPXA26.0172 |
0411PAJPX-1c |
| 04E02239 |
TST 59 |
JPXX01.0279 |
JPXA26.0172 |
0411PAJPX-1c |
| 09E00857 |
TST 42 |
JPXX01.0302 |
JPXA26.0183 |
0905PAJPX-1 |
| 09E01235 |
TST 42 |
JPXX01.0302 |
JPXA26.0183 |
0905PAJPX-1 |
| 09E01308 |
TST 42 |
JPXX01.0302 |
JPXA26.0183 |
0905PAJPX-1 |
| 09E01333 |
TST 42 |
JPXX01.0302 |
JPXA26.0183 |
0905PAJPX-1 |
| 09E01424 |
TST 42 |
JPXX01.0302 |
JPXA26.0183 |
0905PAJPX-1 |
| 09E01666 |
TST 42 |
JPXX01.0302 |
JPXA26.0183 |
0905PAJPX-1 |
| M09015209001A |
TST 42 |
JPXX01.0302 |
JPXA26.0183 |
0905PAJPX-1 |
| M09017319001A |
TST 42 |
JPXX01.0302 |
JPXA26.0183 |
0905PAJPX-1 |
| M09019457001A |
TST 42 |
JPXX01.0302 |
JPXA26.0183 |
0905PAJPX-1 |
| M09021164001A |
TST 42 |
JPXX01.0302 |
JPXA26.0183 |
0905PAJPX-1 |
| M09015294001A |
TST 42 |
JPXX01.0047 |
- |
- |
| M09019934001A |
TST 42 |
JPXX01.0781 |
- |
- |
| M09015723001A |
TST 12 |
JPXX01.0604 |
JPXA26.0292 |
- |
| M09019606001A |
TST 12 |
JPXX01.0604 |
JPXA26.0174 |
- |
| M09016911001A |
TST 12 |
JPXX01.1214 |
- |
- |
| 09E00951 |
TST 13 |
JPXX01.0001 |
JPXA26.0530 |
- |
| M09019186001A |
TST 13 |
JPXX01.0946 |
- |
- |
| 09E01471 |
TST 15 |
JPXX01.2095 |
- |
- |
| M09016893001A |
TST 19 |
JPXX01.0146 |
JPXA26.0291 |
- |
| M09017200001A | TST 60 | JPXX01.0359 | - | - |
The 10 isolates without cluster information represent the sporadic, or non-outbreak related, isolates used as controls in the study.
CRISPR-MVLST was able to separate the 2004 isolates, with each isolate bearing the unique TST59 (Tables 4 and 5). These isolates were also analyzed by two-enzyme PFGE, using XbaI and BlnI. Though they had the same TST, two of the isolates, 04E02241 and 04E02239 had different PFGE patterns with BlnI or XbaI, respectively, and are indicated in bold in Table 5. This example shows that CRISPR-MVLST provides an epidemiologic concordance of 1 (E = 1.0) and for PFGE it is less than 1 (E < 1.0). Additionally, the XbaI PFGE pattern associated with this strain, JPXX01.0146, occurred fairly frequently in our initial data set; 12/86 isolates had this pulsotype and we were able to separate these into seven different TSTs.
For the 2009 outbreak isolates, CRISPR-MVLST correctly identified the 10 outbreak isolates (TST42) and these all have the same PFGE pattern, JPXX01.0302, thus for both subtyping methods E = 1.0. Two of the sporadic case control isolates were also TST42 (shown in bold in Table 5) but these had different PFGE pulsotypes from the outbreak strain, suggesting a lack of discrimination by CRISPR-MVLST in this instance. TST42 was seen in two isolates in the initial study of 86 S. Typhimurium isolates. All isolates within each outbreak were identified using CRISPR-MVLST, thus obtaining perfect epidemiological concordance with this subtyping method.
Discussion
Foodborne illness caused by Salmonella enterica species, particularly by S. Typhimurium and S. Heidelberg, accounts for 18.5% of salmonellosis annually in the United States [4]. For accurate outbreak tracking and routine disease surveillance, it is critical that we employ rapid, efficient and robust subtyping methodologies. PFGE is the current gold standard for molecular subtyping of Salmonella and other methods include AFLP, MVLA and CRISPR-MVLST.
CRISPR sequence analysis is one of the cheaper and faster methods for Salmonella subtyping [22]. For the majority of isolates analyzed, CRISPR-MVLST could be completed in less than 24 hours, including DNA isolation and analysis. Additionally, by virtue of their nature, sequencing data are more robust and tractable; this type of data is unequivocal and, with regards to inter-laboratory or database use, is highly consistent. They also provide increased downstream utilities that involve analysis of sequence information, such as phylogenetic studies. This approach is also in line with other high-throughput subtyping approaches, including real-time CRISPR analysis [32] and whole genome sequence analysis [43-47]. Conversely, although protocols exist that allow PFGE to be completed in 24 hours, it can often take 1–3 days, requires skilled personnel, inter-laboratory data analysis can be challenging and the data have no utility beyond subtyping. Given the advancement of whole-genome sequencing technologies, typing methods based on these are in development [48]. While highly discriminatory, limitations to this approach that are not issues with either CRISPR-MVLST or PFGE include the time required for analysis and space required for data storage.
CRISPR spacer analysis alone has been used to analyze several different Salmonella serovars [32]. Fabre and colleagues showed that among 50 isolates of S. Typhimurium and its I,4, [5],12:i- variant, combined CRISPR1 and CRISPR2 sequence information is comparable to PFGE (D = 0.88 and 0.87, respectively). Both methods were more discriminatory than phage typing analysis of the same set of isolates. The same study also analyzed spacer content of S. Typhimurium and S. Enteritidis from 10 outbreaks and in all cases CRISPR sequences exhibited high epidemiologic concordance.
A preliminary investigation showed that addition of CRISPR spacer analysis to an MVLST scheme improves discrimination, beyond that provided by either approach independently, in eight out of nine of the most common illness-causing Salmonella serovars [33]. We wanted to extend our evaluation of CRISPR-MVLST utility among predominant and clinically relevant Salmonella serovars. To date we have tested and compared CRISPR-MVLST to PFGE on large numbers of S. Enteritidis [34], S. Newport [41]S, Heidelberg and S. Typhimurium isolates. Among the total 175 isolates analyzed here, we found significantly fewer alleles of fimH and sseL, compared to alleles of either CRISPR locus (Table 2; Figure 2). Given the reduced contribution of the virulence genes to defining STs, their addition may seem superfluous within this subtyping scheme. However, in this data set, fimH alleles define two STs, HST13 and TST20 and sseL alleles define five STs, TST16, TST19, TST23, TST29 and TST36. This further supports earlier findings showing that addition of MVLST to a CRISPR-based subtyping scheme increases discrimination in S. Enteritidis [34] as well as among a broad set of Salmonella enterica serovars [33].
Though the number of isolates for each serovar was similar, the number of STs within each serovar is surprisingly disparate: among 89 S. Heidelberg isolates we identified 21 HSTs and in 86 S. Typhimurium isolates, we identified 37 TSTs. This presumably reflects varied levels of clonality in different serovars. Independently of the number of STs defined for either serovar, the CRISPR loci are responsible for the vast majority of alleles: (S. Heidelberg – 83.3% and S. Typhimurium – 80%) (Figure 2). In S. Heidelberg, 50% of the different alleles identified were CRISPR1 alleles. Given that CRISPRs are of one of the more dynamic loci in bacteria [30,31], this finding is not unexpected.
Although PFGE was more discriminatory than CRISPR-MVLST among 89 S. Heidelberg isolates (D = 0.81 versus 0.69, respectively), a combination of both techniques provided an improved value of 0.92. This represents a 92% probability that two unrelated strains can be separated. JF6X01.0022 is the most common PFGE pattern in PulseNet for S. Heidelberg [49] and is seen 30–40 times a month by the CDC. In our data set, 42% of the isolates have the JF6X01.0022 pattern and using CRISPR-MVLST, we were able to further separate these into seven distinct CRISPR-MVLST types (Figure 3b and d). Given the frequency at which this PFGE pattern occurs nationally, not all isolates that have this pattern may be associated with a specific outbreak, further enhancing the utility of CRISPR-MVLST as a complement to PFGE analysis. Collectively, these findings in S. Heidelberg show that the JF6X01.0022 pattern is analogous to the JEGX01.0004 pattern in S. Enteritidis, where the latter was observed in 51% of isolates analyzed and was separated into 12 distinct STs [34]. A proposed improvement for discrimination in S. Heidelberg and S. Enteritidis by PFGE is to increase the number of enzymes used for PFGE analysis [50,51], though the concurrent use of PFGE and CRISPR-MVLST would be much more efficient than this approach.
Regarding S. Heidelberg, our data are similar to that observed in a broad set of S. Enteritidis isolates [34]: both serovars exhibit fewer number of STs identified and both require combining CRISPR-MVLST and PFGE to obtain a sufficient discriminatory power. This presumably reflects similar levels of clonality in S. Heidelberg and S. Enteritidis as compared to more heterogenous serovars such as S. Typhimurium where we observed many more STs present within a similar number of isolates examined.
Our data show that in S. Typhimurium, the discrimination provided by either PFGE or CRISPR-MVLST is similar (0.9486 versus 0.9415, respectively). When CRISPR-MVLST was applied to outbreak isolates, we were able to correctly identify the 20 isolates representing the two outbreaks, showing an extremely good epidemiologic concordance with this typing method. The epidemiologic concordance was better by CRISPR-MVLST than PFGE in identifying isolates from the 2004 bus trip outbreak and both methods had equal epidemiological concordance for the 2009 live poultry outbreak. Regarding the 2004 outbreak, the majority of isolates had the JPXX01.0146 pulsotype. In our initial study, this pulsotype was seen frequently, 16% of all isolates analyzed, and the 14 isolates with this pattern could also be represented by 7 distinct TSTs. Conversely, all isolates from this outbreak have TST59, which is unique and not seen in our initial data set showing that in this instance, CRISPR-MVLST may be a better subtyping approach. In analyzing the 2009 live poultry outbreak, it appears that PFGE is more discriminatory than CRISPR-MVLST, as CRISPR-MVLST also identified two non-outbreak related isolates as TST42. Given the available epidemiological data available, these two isolates do not appear to be associated with the outbreak. The fact that CRISPR-MVLST works better in some instances than others is not surprising and can also occur when other subtyping methods are used. ‘Problematic’ PFGE pulsotypes also exist and is one reason that second generation methods like MLVA and CRISPR-MVLST are being developed [33,52]. As a recent example, isolates associated with the 2012 S. Typhimurium cantaloupe outbreak, had a common PFGE pattern so additional subtyping by MLVA was performed to correctly define the outbreak strain [24]. That there is a strong association among closely related sequence types and closely related PFGE patterns for both S. Typhimurium (Figure 5) and S. Newport [41] provides further evidence that CRISPR-MVLST could serve as an appropriate alternative subtyping method.
Beyond the data shown here and in further evaluating the value of CRISPR-MVLST sequence typing, a recent study investigating S. Typhimurium isolates from a variety of animal sources showed an association of CRISPR-MVLST sequence types and resistance to antibiotics [40]. As part of that study, the most frequent TSTs were TST10 and TST42, both of which were found in this current study. TST10 was also the most frequent clinical sequence type seen in this study (16/86 isolates) but only two isolates were TST42.
Conclusion
CRISPR-MVLST is a relatively new subtyping approach with limited studies conducted in Salmonella that demonstrate its utility [33,34,39]. Our data here add to this body of work by demonstrating its functionality in two highly prevalent clinical serovars. Investigation of several more outbreak strains using CRISPR-MVLST will elucidate the true capability of this subtyping method. Our data here show that CRISPR-MVLST can be used in concert with PFGE, as in the case of S. Heidelberg, or potentially as an independent subtyping method, as in the case of S. Typhimurium.
Methods
Bacterial isolates and sample preparation
A summary of all isolates analyzed in this study is listed in Table 5. A total of 89 and 86 clinical isolates of S. Heidelberg and S. Typhimurium, respectively, were obtained from the Pennsylvania Department of Health. These isolates were selected systematically (isolates received closest to the 1st and 15th of each month from 2005 – 2011 were selected) to represent an unbiased collection of human clinical isolates. PFGE-XbaI analysis of these isolates was conducted using standard protocols [7,53]. All isolates were stored at -80°C in 20% glycerol. Isolates were grown overnight in 2 mL LB at 37°C in a shaking incubator. DNA was isolated using the Promega genomic DNA isolation kit, following the manufacturer’s directions (Promega, Madison, WI). DNA samples were stored at -20°C prior to PCR analysis.
PCR amplification
Primers for amplification of all four genomic loci are listed in Table 6. PCR reactions were performed in a total volume of 25 μl: 1.5 μl template, 0.3 μl Taq (1.5 units; New England Bio Labs, Ipswich, MA), 0.2 μl 10 mM dNTPs, 1 μl of each 10 μM primer, 2.5 μl of 10× Taq buffer and 18.5 μl water. PCR conditions were as follows and the annealing temperatures (AT) are listed in Table 6: initial denaturation step of 10 minutes at 94°C followed by 35 cycles of 1 minute at 94°C, 1 minute at AT and extension for 1 minute (fimH and sseL) or 1.5 minutes (CRISPR1 and CRISPR2) at 72°C; a final extension step was done at 72°C for 8 minutes. 5 μl of each PCR product was electrophoretically analyzed on a 1.2% agarose gel and the remaining reaction stored at -20°C.
Table 6.
List of primers used in this study for PCR amplification and sequencing of the four CRISPR-MVLST markers
| Primer | Orientation | Primer sequence (5′-3′) | Annealing temp. | PCR | Sequencing |
|---|---|---|---|---|---|
| CRISPR1-5 |
Forward |
TGAAAACAGACGTATTCCGGTAGATT |
55.5 |
✓ |
✓ |
| CRISPR1-1 |
Reverse |
CAGCATATTGACAAGGCGCT |
✓ |
✓ |
|
| CRISPR2-3 |
Forward |
ATTGTTGCGATTATGTTGGT |
57 |
✓ |
✓ |
| CRISPR2-1 |
Reverse |
TCCAGCTCCCTTATGATTTT |
✓ |
|
|
| CRISPR2-4 |
Reverse |
GCAATACCCTGATCCTTAACGCCA |
|
|
✓ |
| CRISPR2-5 |
Reverse |
CGACGAAATTAAAACCGAACT |
|
|
✓ |
| CRISPR2-6 |
Forward |
CGGATTCCATGCGTTTTCA |
|
|
✓ |
| CRISPR2-7 |
Forward |
CCGGCGAGGTCAATAAAA |
|
|
✓ |
| CRISPR2-8 |
Forward |
TGACGCTGGTCTATACCG |
|
|
✓ |
| CRISPR2-9 |
Forward |
GTGACGTCAGTGCCGAA |
|
|
✓ |
| CRISPR2-10 |
Reverse |
CTCTTCGCACTCTCGATCAA |
|
|
✓ |
| fimH-1 |
Forward |
AGGTGAACTGTTCATCCAGTGG |
56.7 |
✓ |
✓ |
| fimH-2 |
Reverse |
GCGGGCTGAACAAAACACAA |
✓ |
✓ |
|
| sseL-1 |
Forward |
AAAATCAGGTCTATGCCTGATTTAATATATC |
60 |
✓ |
|
| sseL-2 |
Reverse |
GGCTCTAAGTACTCACCATTACT |
✓ |
|
|
| sseL-3 |
Forward |
ACCAGGAAACAGAGCAAAATGAATATATGT |
|
|
✓ |
| sseL-4 | Forward | TTCTCTCGGTAAACTATCCTATTGGGC | ✓ |
DNA sequencing
PCR products were treated with 10 units of Exonuclease (New England Bio Labs, Ipswich, MA) and 1 unit of Antarctic alkaline phosphatase (New England Bio Labs, Ipswich, MA). The mixture was incubated for 40 minutes at 37°C to remove remaining primers and unincorporated dNTPs. The enzymes were inactivated by incubating the samples at 85°C for 15 minutes. Purified PCR products were sequenced at the Huck Institute’s Nucleic Acid Facility at The Pennsylvania State University using 3’ BigDye-labeled dideoxynucleotide triphosphates (v 3.1 dye terminators; LifeTechnoloties, Carlsbad, CA) and run on an ABI 3730XL DNA Analyzer, using ABI Data Collection Program (v 2.0). Data was analyzed with ABI Sequencing Analysis software (Version 5.1.1). The primers used for sequencing are listed in Table 6. In total, four PCR reactions and eight sequencing reactions were conducted for each isolate being typed. Additionally, one internal sequencing reaction was required for 14/26 S. Typhimurium CRISPR2 alleles, due to the increased length of this locus. There were two alleles (only representing 2/86 S. Typhimurium isolates), 181 and 205, which required extra primers due to the presence of a duplicated region of the locus. The positions of these extra primers are shown in Additional file 1: Figure S1. CRISPR2 alleles that were sequenced using more than two primers are indicated in Table 3.
Sequence analysis and sequence type assignment
Sequences were assembled and aligned using SeqMan and MegAlign, respectively (Lasergene 10, DNA Star, Madison, WI) and unique alleles were assigned a unique numerical designation. All sequences from this study were submitted as a batch to NCBI and the accession numbers (KF465853 - KF465929) are shown for each allele in Additional file 2. For each isolate the combination of allelic types at all four loci defines the serovar-designated sequence type (ST) (Tables 2 and 3), with each unique allelic type assigned a different ST number. The presence of a SNP in any marker was sufficient to define a new allele. Analysis of CRISPR1 and CRISPR2 was performed using CRISPR-finder (http://crispr.u-psud.fr/Server/). We did not identify any SNPs within either CRISPR locus that defined any allele. Allelic differences occurred from deletion of one or more spacers, addition of a spacer or duplication/triplication of a spacer. Discriminatory power was calculated using the method described by Hunter and Gaston [54], with strains defined as either unique STs or unique PFGE patterns.
Relationships between TSTs were calculated using BURST (http://www.pubmlst.org/analysis/), with a group definition of n-1. Unique PFGE patterns, or pulsotypes, were defined by PulseNet, using the Dice coefficient with an optimization of 1.5% and a position tolerance of 1.5%. The difference of one band is sufficient to call two PFGE patterns different. PFGE dendrograms were generated using BioNumerics v. 6.6.
S. Typhimurium outbreak study
A summary of 30 S. Typhimurium outbreak isolates that were obtained from the Pennsylvania Department of Health is listed in Table 4. Ten of these isolates associated with an outbreak in 2004 (cluster 0411PAJPX-1c) where affected patients had been on a bus trip together, though no vector was ever identified. Another 10 isolates were linked to an outbreak in 2009 (cluster 0905PAJPX-1), which was associated with live poultry. The remaining 10 isolates represent sporadic case isolates, also from 2009 but were not associated with the 0905PAJPX-1 outbreak and thus served as controls. The isolates were cultured as described above.
Consent and institutional review board (IRB) approval
This study design was reviewed by the Pennsylvania Department of Health IRB and was determined to be exempt under federal regulations as it falls within the category “research that involves the collection or study of existing data, documents, records, pathological specimens, or diagnostic specimens where the information is recorded by the investigator in such a manner that subjects cannot be identified, directly or through identifiers linked to the subjects”.
Competing interests
The authors declare that they have no competing interests.
Authors’ contributions
NS designed, coordinated and carried out the experiments and bioinformatics analyses and wrote the manuscript. CS isolated bacterial cultures and did the PFGE. MD and RB participated in the CRISPR alignment analysis. ED conceived of the study, participated in the design and coordination of the study and helped to write the manuscript. All authors read and approved the final manuscript.
Supplementary Material
Location of CRISPR2 primers used for PCR and sequencing. Representation of CRISPR2 spacers from three alleles (allele numbers shown on the left) with each unique spacer shown as a uniquely colored box. Regions of spacer duplication are indicated above the array with a black line. Allele 164 is the most frequent allele. Alleles 181 and 205 each only occurred in one isolate and given the length and the seven spacers that are duplicated (line 2), required five additional primers for sequencing. These were the only two isolates that required this many primers. The primers are indicated below the array. The PCR primers are shown in bold. With the exception of CR2-4, all were used for PCR and sequencing.
Accession Numbers Table listing the accession numbers for all alleles identified in this study.
Contributor Information
Nikki Shariat, Email: nikki.shariat@psu.edu.
Carol H Sandt, Email: csandt@pa.gov.
Michael J DiMarzio, Email: mjd1051@psu.edu.
Rodolphe Barrangou, Email: rbarran@ncsu.edu.
Edward G Dudley, Email: egd100@psu.edu.
Acknowledgments
The authors would like to thank Margaret Kirchner and Steven Strutt for assistance with DNA isolations and Dr. Stephen Knabel for critically reading the manuscript. We would also like to acknowledge the Huck Institute’s Nucleic Acid Facility at Penn State University.
This study was supported by a United States Army Research Office grant to E.G.D (W911NF-11-1-0442).
References
- Scallan E, Hoekstra RM, Angulo FJ, Tauxe RV, Widdowson M-A, Roy SL, Jones JL, Griffin PM. Foodborne illness acquired in the United States—major pathogens. Emerg Infect Dis. 2011;17:7–15. doi: 10.3201/eid1701.P11101. [DOI] [PMC free article] [PubMed] [Google Scholar]
- Hoffmann S, Batz MB, Morris JG Jr. Annual cost of illness and quality-adjusted life year losses in the united states due to 14 foodborne pathogens. J Food Prot. 2012;75:1292–1302. doi: 10.4315/0362-028X.JFP-11-417. [DOI] [PubMed] [Google Scholar]
- Scharff RL. Economic burden from health losses due to foodborne illness in the United States. J Food Prot. 2012;75:123–131. doi: 10.4315/0362-028X.JFP-11-058. [DOI] [PubMed] [Google Scholar]
- Centers for Disease Control and Prevention. National Salmonella Surveillance Annual Summary 2009. 2009. http://www.cdc.gov/ncidod/dbmd/phlisdata/salmonella.htm [Accessed March 4, 2013]
- Multistate Outbreak of Salmonella Heidelberg Infections Linked to Chicken. http://www.cdc.gov/salmonella/heidelberg-02-13/index.html.
- Multistate Outbreak of Salmonella Typhimurium Infections Linked to Ground Beef. http://www.cdc.gov/salmonella/typhimurium-01-13/ [PubMed]
- Ribot EM, Fair MA, Gautom R, Cameron DN, Hunter SB, Swaminathan B, Barrett TJ. Standardization of pulsed-field gel electrophoresis protocols for the subtyping of Escherichia coli O157:H7, Salmonella, and Shigella for pulsenet. Foodborne Pathog Dis. 2006;3:59–67. doi: 10.1089/fpd.2006.3.59. [DOI] [PubMed] [Google Scholar]
- Lindstedt B-A, Heir E, Vardund T, Kapperud G. Fluorescent amplified-fragment length polymorphism genotyping of Salmonella enterica subsp. enterica serovars and comparison with pulsed-field gel electrophoresis typing. J Clin Microbiol. 2000;38:1623–1627. doi: 10.1128/jcm.38.4.1623-1627.2000. [DOI] [PMC free article] [PubMed] [Google Scholar]
- Torpdahl M, Skov MN, Sandvang D, Baggesen DL. Genotypic characterization of Salmonella by multilocus sequence typing, pulsed-field gel electrophoresis and amplified fragment length polymorphism. J Microbiol Methods. 2005;63:173–184. doi: 10.1016/j.mimet.2005.03.006. [DOI] [PubMed] [Google Scholar]
- Hu H, Lan R, Reeves PR. Fluorescent amplified fragment length polymorphism analysis of Salmonella enterica serovar Typhimurium reveals phage-type- specific markers and potential for microarray typing. J Clin Microbiol. 2002;40:3406–3415. doi: 10.1128/JCM.40.9.3406-3415.2002. [DOI] [PMC free article] [PubMed] [Google Scholar]
- Larsson JT, Torpdahl M, Petersen RF, Sørensen G, Lindstedt B-A, Nielsen EM. Development of a new nomenclature for Salmonella Typhimurium multilocus variable number of tandem repeats analysis (MLVA) Eurosurveillance. 2009;14:1–5. [PubMed] [Google Scholar]
- Torpdahl M, Sørensen G, Lindstedt B-A, Nielsen EM. Tandem repeat analysis for surveillance of human Salmonella Typhimurium infections. Emerg Infect Dis. 2007;13:388–395. doi: 10.3201/eid1303.060460. [DOI] [PMC free article] [PubMed] [Google Scholar]
- Ross IL, Heuzenroeder MW. Discrimination within phenotypically closely related definitive types of Salmonella enterica serovar Typhimurium by the multiple amplification of phage locus typing technique. J Clin Microbiol. 2005;43:1604–1611. doi: 10.1128/JCM.43.4.1604-1611.2005. [DOI] [PMC free article] [PubMed] [Google Scholar]
- Lindstedt BE, Heir E, Gjernes E, Kapperud G. DNA fingerprinting of Salmonella enterica subsp. enterica serovar Typhimurium with emphasis on phage type DT104 based on variable number of tandem repeat loci. J Clin Microbiol. 2003;41:1469–1479. doi: 10.1128/JCM.41.4.1469-1479.2003. [DOI] [PMC free article] [PubMed] [Google Scholar]
- Ramisse V, Houssu P, Hernandez E, Denoeud F, Hilaire V, Lisanti O, Ramisse F, Cavallo J-D, Vergnaud G. Variable number of tandem repeats in Salmonella enterica subsp. enterica for typing purposes. J Clin Microbiol. 2006;42:3849–3854. doi: 10.1128/JCM.42.12.5722-5730.2004. [DOI] [PMC free article] [PubMed] [Google Scholar]
- Witonski D, Stefanova R, Ranganathan A, Schutze GE, Eisenach KD, Cave MD. Variable-number tandem repeats that are useful in genotyping isolates of Salmonella enterica subsp. enterica serovars Typhimurium and Newport. J Clin Microbiol. 2006;44:3849–3854. doi: 10.1128/JCM.00469-06. [DOI] [PMC free article] [PubMed] [Google Scholar]
- Lindstedt B-A, Vardund T, Aas L, Kapperud G. Multiple-locus variable-number tandem-repeats analysis of Salmonella enterica subsp. enterica serovar Typhimurium using PCR multiplexing and multicolor capillary electrophoresis. J Microbiol Methods. 2004;59:163–172. doi: 10.1016/j.mimet.2004.06.014. [DOI] [PubMed] [Google Scholar]
- Young C-C, Ross IL, Heuzenroeder MW. A New methodology for differentiation and typing of closely related Salmonella enterica serovar Heidelberg isolates. Curr Microbiol. 2012;65:481–487. doi: 10.1007/s00284-012-0179-3. [DOI] [PubMed] [Google Scholar]
- Fang N, Huang B, Hiley L, Bates J, Savill J. A rapid multiplex DNA suspension array method for Salmonella Typhimurium subtyping using prophage-related markers. J Microbiol Methods. 2012;88:19–27. doi: 10.1016/j.mimet.2011.10.002. [DOI] [PubMed] [Google Scholar]
- Kérouanton A, Marault M, Lailler R, Weill F-X, Feurer C, Espié E, Brisabois A. Pulsed-field gel electrophoresis subtyping database for foodborne Salmonella enterica serotype discrimination. Foodborne Pathog Dis. 2007;4:293–303. doi: 10.1089/fpd.2007.0090. [DOI] [PubMed] [Google Scholar]
- Goering RV. Pulsed field gel electrophoresis: a review of application and interpretation in the molecular epidemiology of infectious disease. Infect Genet Evol. 2010;10:866–875. doi: 10.1016/j.meegid.2010.07.023. [DOI] [PubMed] [Google Scholar]
- Wattiau P, Boland C, Bertrand S. Methodologies for Salmonella enterica subsp. enterica subtyping: gold standards and alternatives. Appl Environ Microbiol. 2011;77:7877–7885. doi: 10.1128/AEM.05527-11. [DOI] [PMC free article] [PubMed] [Google Scholar]
- Foley SL, Zhao S, Walker RD. Comparison of molecular typing methods for the differentiation of Salmonella foodborne pathogens. Foodborne Pathog Dis. 2007;4:253–276. doi: 10.1089/fpd.2007.0085. [DOI] [PubMed] [Google Scholar]
- Multistate Outbreak of Salmonella Typhimurium and Salmonella Newport Infections Linked to Cantaloupe (Final Update) http://www.cdc.gov/salmonella/typhimurium-cantaloupe-08-12/index.html.
- Multistate Outbreak of Human Salmonella Heidelberg Infections Linked to “Kosher Broiled Chicken Livers” From Schreiber Processing Corporation. http://www.cdc.gov/salmonella/heidelberg-chickenlivers/index.html.
- Investigation Update: Multistate Outbreak of Human Salmonella Heidelberg Infections Linked to Ground Turkey. http://www.cdc.gov/salmonella/heidelberg/111011/index.html.
- Touchon M, Rocha EPC. The small, slow and specialized CRISPR and anti-CRISPR of Escherichia and Salmonella. PLoS ONE. 2010;5:14. doi: 10.1371/journal.pone.0011126. [DOI] [PMC free article] [PubMed] [Google Scholar]
- Bhaya D, Davison M, Barrangou R. CRISPR-Cas systems in bacteria and archaea: versatile small RNAs for adaptive defense and regulation. Annu Rev Genet. 2011;45:273–297. doi: 10.1146/annurev-genet-110410-132430. [DOI] [PubMed] [Google Scholar]
- Andersson AF, Banfield JF. Virus population dynamics and acquired virus resistance in natural microbial communities. Science. 2008;320:1047–1050. doi: 10.1126/science.1157358. [DOI] [PubMed] [Google Scholar]
- Barrangou R, Fremaux C, Deveau H, Richards M, Boyaval P, Moineau S, Romero DA, Horvath P. CRISPR provides acquired resistance against viruses in prokaryotes. Science. 2007;315:1709–1712. doi: 10.1126/science.1138140. [DOI] [PubMed] [Google Scholar]
- Tyson GW, Banfield JF. Rapidly evolving CRISPRs implicated in acquired resistance of microorganisms to viruses. Environ Microbiol. 2008;10:200–207. doi: 10.1111/j.1462-2920.2007.01444.x. [DOI] [PubMed] [Google Scholar]
- Fabre L, Zhang J, Guigon G, Le Hello S, Guibert V, Accou-Demartin M, De Romans S, Lim C, Roux C, Passet V, Diancourt L, Guibourdenche M, Issenhuth-Jeanjean S, Achtman M, Brisse S, Sola C, Weill F-X. CRISPR typing and subtyping for improved laboratory surveillance of Salmonella infections. PLoS One. 2012;7:e36995. doi: 10.1371/journal.pone.0036995. [DOI] [PMC free article] [PubMed] [Google Scholar]
- Liu F, Barrangou R, Gerner-Smidt P, Ribot EM, Knabel SJ, Dudley EG. Novel virulence gene and clustered regularly interspaced short palindromic repeat (CRISPR) multilocus sequence typing scheme for subtyping of the major serovars of Salmonella enterica subsp. enterica. Appl Environ Microbiol. 2011;77:1946–1956. doi: 10.1128/AEM.02625-10. [DOI] [PMC free article] [PubMed] [Google Scholar]
- Shariat N, DiMarzio MJ, Yin S, Dettinger L, Sandt CH, Lute JR, Barrangou R, Dudley EG. The combination of CRISPR-MVLST and PFGE provides increased discriminatory power for differentiating human clinical isolates of Salmonella enterica subsp. enterica serovar Enteritidis. Food Microbiol. 2013;34:164–173. doi: 10.1016/j.fm.2012.11.012. [DOI] [PubMed] [Google Scholar]
- Delannoy S, Beutin L, Burgos Y, Fach P. Specific detection of enteroaggregative hemorrhagic Escherichia coli O104:H4 strains by use of the CRISPR locus as a target for a diagnostic real-time PCR. J Clin Microbiol. 2012;50:3485–3492. doi: 10.1128/JCM.01656-12. [DOI] [PMC free article] [PubMed] [Google Scholar]
- Delannoy S, Beutin L, Fach P. Use of clustered regularly interspaced short palindromic repeat sequence polymorphisms for specific detection of enterohemorrhagic Escherichia coli strains of serotypes O26:H11, O45:H2, O103:H2, O111:H8, O121:H19, O145:H28, and O157:H7 by real-time. J Clin Microbiol. 2012;50:4035–4040. doi: 10.1128/JCM.02097-12. [DOI] [PMC free article] [PubMed] [Google Scholar]
- Hoe N, Nakashima K, Grigsby D, Pan X, Dou SJ, Naidich S, Garcia M, Kahn E, Bergmire-Sweat D, Musser JM. Rapid molecular genetic subtyping of serotype M1 group A Streptococcus strains. Emerg Infect Dis. 1999;5:254–263. doi: 10.3201/eid0502.990210. [DOI] [PMC free article] [PubMed] [Google Scholar]
- Schouls LM, Reulen S, Duim B, Wagenaar JA, Willems RJL, Dingle KE, Colles FM, Van Embden JDA. Comparative genotyping of Campylobacter jejuni by amplified fragment length polymorphism, multilocus sequence typing, and short repeat sequencing: strain diversity, host range, and recombination. J Clin Microbiol. 2003;41:15–26. doi: 10.1128/JCM.41.1.15-26.2003. [DOI] [PMC free article] [PubMed] [Google Scholar]
- Liu F, Kariyawasam S, Jayarao BM, Barrangou R, Gerner-Smidt P, Ribot EM, Knabel SJ, Dudley EG. Subtyping Salmonella enterica serovar enteritidis isolates from different sources by using sequence typing based on virulence genes and clustered regularly interspaced short palindromic repeats (CRISPRs) Appl Environ Microbiol. 2011;77:4520–4526. doi: 10.1128/AEM.00468-11. [DOI] [PMC free article] [PubMed] [Google Scholar]
- DiMarzio MJ, Shariat N, Kariyawasam S, Barrangou R, Dudley EG. Antibiotic resistance in Salmonella Typhimurium associates with CRISPR sequence type. Antimicrob Agents Chemother. 2013;57:4282–4289. doi: 10.1128/AAC.00913-13. [DOI] [PMC free article] [PubMed] [Google Scholar]
- Shariat N, Kirchner MK, Sandt CH, Trees E, Barrangou R, Dudley EG. CRISPR-MVLST subtyping of Salmonella serovar Newport outbreak isolates and determination of the relationship between CRISPR-MVLST and PFGE. J Clin Microbiol. 2013;51:2328–2336. doi: 10.1128/JCM.00608-13. [DOI] [PMC free article] [PubMed] [Google Scholar]
- Struelens MJ. Consensus guidelines for appropriate use and evaluation of microbial epidemiologic typing systems. Clin Microbiol Infect. 1996;2:2–11. doi: 10.1111/j.1469-0691.1996.tb00193.x. [DOI] [PubMed] [Google Scholar]
- Den Bakker HC, Moreno Switt AI, Cummings CA, Hoelzer K, Degoricija L, Rodriguez-Rivera LD, Wright EM, Fang R, Davis M, Root T, Schoonmaker-Bopp D, Musser KA, Villamil E, Waechter H, Kornstein L, Furtado MR, Wiedmann M. A whole-genome single nucleotide polymorphism-based approach to trace and identify outbreaks linked to a common Salmonella enterica subsp. enterica serovar Montevideo pulsed-field gel electrophoresis type. Appl Environ Microbiol. 2011;77:8648–8655. doi: 10.1128/AEM.06538-11. [DOI] [PMC free article] [PubMed] [Google Scholar]
- Allard MW, Luo Y, Strain E, Li C, Keys CE, Son I, Stones R, Musser SM, Brown EW. High resolution clustering of Salmonella enterica serovar Montevideo strains using a next-generation sequencing approach. BMC Genomics. 2012;13:32. doi: 10.1186/1471-2164-13-32. [DOI] [PMC free article] [PubMed] [Google Scholar]
- Lienau EK, Strain E, Wang C, Zheng J, Ottesen AR, Keys CE, Hammack TS, Musser SM, Brown EW, Allard MW, Cao G, Meng J, Stones R. Identification of a salmonellosis outbreak by means of molecular sequencing. N Engl J Med. 2011;364(10):981–982. doi: 10.1056/NEJMc1100443. [DOI] [PubMed] [Google Scholar]
- Okoro CK, Kingsley RA, Quail MA, Kankwatira AM, Feasey NA, Parkhill J, Dougan G, Gordon MA. High-resolution single nucleotide polymorphism analysis distinguishes recrudescence and reinfection in recurrent invasive nontyphoidal Salmonella Typhimurium disease. Clin Infect Dis. 2012;54:955–963. doi: 10.1093/cid/cir1032. [DOI] [PMC free article] [PubMed] [Google Scholar]
- Leekitcharoenphon P, Lukjancenko O, Friis C, Aarestrup FM, Ussery DW. Genomic variation in Salmonella enterica core genes for epidemiological typing. BMC Genomics. 2012;13:88. doi: 10.1186/1471-2164-13-88. [DOI] [PMC free article] [PubMed] [Google Scholar]
- Köser C, Ellington M, Cartwright E. Routine use of microbial whole genome sequencing in diagnostic and public health microbiology. PLoS Pathog. 2012;8:e1002824. doi: 10.1371/journal.ppat.1002824. [DOI] [PMC free article] [PubMed] [Google Scholar]
- Kaldhone P, Nayak R, Lynne AM, David DE, McDermott PF, Logue CM, Foley SL. Characterization of Salmonella enterica serovar Heidelberg from turkey-associated sources. Appl Environ Microbiol. 2008;74:5038–5046. doi: 10.1128/AEM.00409-08. [DOI] [PMC free article] [PubMed] [Google Scholar]
- Xi M, Zheng J, Zhao S, Brown EW, Meng J. An enhanced discriminatory pulsed-field gel electrophoresis scheme for subtyping Salmonella serotypes Heidelberg, Kentucky, SaintPaul, and Hadar. J Food Prot. 2008;71:2067–2072. doi: 10.4315/0362-028x-71.10.2067. [DOI] [PubMed] [Google Scholar]
- Zheng J, Keys CE, Zhao S, Meng J, Brown EW. Enhanced subtyping scheme for Salmonella Enteritidis. Emerg Infect Dis. 2007;13:1932–1935. doi: 10.3201/eid1312.070185. [DOI] [PMC free article] [PubMed] [Google Scholar]
- Hyytiä-Trees EK, Cooper K, Ribot EM, Gerner-Smidt P. Recent developments and future prospects in subtyping of foodborne bacterial pathogens. Future Microbiol. 2007;2:175–185. doi: 10.2217/17460913.2.2.175. [DOI] [PubMed] [Google Scholar]
- Sandt CH, Krouse DA, Cook CR, Hackman AL, Chmielecki WA, Warren NG. The key role of pulsed-field gel electrophoresis in investigation of a large multiserotype and multistate food-borne outbreak of Salmonella infections centered in Pennsylvania. J Clin Microbiol. 2006;44:3208–3212. doi: 10.1128/JCM.01404-06. [DOI] [PMC free article] [PubMed] [Google Scholar]
- Hunter PR, Gaston MA. Numerical index of the discriminatory ability of typing systems: an application of Simpson’s index of diversity. J Clin Microbiol. 1988;26:2465–2466. doi: 10.1128/jcm.26.11.2465-2466.1988. [DOI] [PMC free article] [PubMed] [Google Scholar]
Associated Data
This section collects any data citations, data availability statements, or supplementary materials included in this article.
Supplementary Materials
Location of CRISPR2 primers used for PCR and sequencing. Representation of CRISPR2 spacers from three alleles (allele numbers shown on the left) with each unique spacer shown as a uniquely colored box. Regions of spacer duplication are indicated above the array with a black line. Allele 164 is the most frequent allele. Alleles 181 and 205 each only occurred in one isolate and given the length and the seven spacers that are duplicated (line 2), required five additional primers for sequencing. These were the only two isolates that required this many primers. The primers are indicated below the array. The PCR primers are shown in bold. With the exception of CR2-4, all were used for PCR and sequencing.
Accession Numbers Table listing the accession numbers for all alleles identified in this study.