

Abstract
The solubility of weakly basic drugs within passage though GI tract leads to pH-dependent or even incomplete release of these drugs from extended release formulations and consequently to lower drug absorption and bioavailability. The aim of the study was to prepare and evaluate hydrophilic–lipophilic (hypromellose–montanglycol wax) matrix tablets ensuring the pH-independent delivery of the weakly basic drug verapamil-hydrochloride by an incorporation of three organic acidifiers (citric, fumaric, and itaconic acids) differing in their concentrations, pKa, and solubility. The dissolution studies were performed by the method of changing pH values, which better corresponded to the real conditions in the GI tract (2 h at pH 1.2 and then 10 h at pH 6.8). Within the same conditions, pH of matrix microenvironment was measured. To determine relationships between the above mentioned properties of acidifiers and the monitored effects (the amount of released drug and surface pH of gel layer in selected time intervals—360 and 480 min), the full factorial design method and partial least squares PLS-2 regression were used. The incorporation of the tested pH modifiers significantly increased the drug release rate from matrices. PLS-components explained 75% and 73% variation in the X- and Y-data, respectively. The obtained results indicated that the main crucial points (p < 0.01) were the concentration and strength of acidifier incorporated into the matrix. Contrary, the acid solubility surprisingly did not influence the selected effects except for the surface pH of gel layer in time 480 min.
Key words: gel layer, matrix tablets, pH-independent drug release, pH modifiers, statistical evaluation
INTRODUCTION
In current pharmacotherapy, many weakly basic drugs or their salts are used. These substances are more soluble in the lower pH of the stomach while their solubility significantly decreases with an increase in the pH within the passage though the proximal part of the small intestine [1]. This solubility change leads to a pH-dependent or even to an incomplete release of these drugs from extended release formulations and consequently to lower drug absorption and bioavailability [2]. This group of drugs includes calcium channel blockers (verapamil, nicardipin), inhibitor of platelet aggregation dipyridamole, azole antifungals (ketoconazole, itraconazole, fluconazole), antiarrhythmic propafenone, beta-blocker propranolol, tricyclic antidepressants (amitriptyline, imipramine, desipramine), and morphine and its derivatives (methadone, pentazocine) and others.
Many strategies have been used to achieve a pH-independent dissolution profile of weakly basic drugs. The described approaches include an increased permeability of the dosage form by the incorporation of polymers having pH-dependent solubility and are able to compensate for the poor solubility of weakly basic drugs at a higher pH, such as alginates [3] or enteric polymers such as Eudragits® [4], which can be applied as matrix former, subcoating [5], or part of the extended release coating [6]. Another possibility is to adjust the microenvironment pH (pHM) of the matrix to a constant lower pH value with the addition of pH modifiers. For this purpose, the incorporation of acidic pH modifiers within the formulation seems to be the effective means to obtain a uniform weakly basic drug release from matrix type dosage forms (tablets, pellets). Several organic acids, such as fumaric [7, 8], citric, succinic, ascorbic, adipic, sorbic [6], glutaric, tartaric [9], and malic [4], were used in research studies. The effect of organic acids on the dissolution profile of weakly soluble drugs is influenced by many factors connected with the drug used (solubility, molecular weight, pKB), the composition of the dosage form [10] and the physico-chemical features of the incorporated acid such as the chemical structure, molecular weight, solubility, pKa, and more [11]. Presently, the selection of dissolution media is extremely important [12]. In various research studies, the influence of acidic pH modifiers was monitored mostly on hydrophilic swellable matrices. To avoid the wet granulation process, which is very often used in hydrophilic matrices technology, the melting granulation based on usage of lipophilic binders (fatty acids, fatty alcohols, waxes) is considered as a suitable alternative for the incorporation of water-sensitive drugs. Thus, the field of hydrophilic–lipophilic matrices is also opened for further investigations.
The incorporation of pH-acidifiers into the matrix system adjusts the pH of microenvironment (pHM) resulting in a more acidic pH of the polymer gel layer forming on the tablet surface. pHM significantly influences the drug dissolution characteristics and is considered to be the crucial parameter to achieve a pH-independent release profile.
Several techniques were used to determine pHM. In the group of invasive methods (a cross-section of a hydrated tablet is required), the incorporation of pH indicator dyes into the tablet structure can be used or a contact pH electrode to determine the internal tablet pH after cryosection [3]. Non-invasive methods include measuring the surface pH of the external gel layer by a contact pH electrode, and sophisticated confocal laser scanning microscopy using pH sensitive fluorescent dyes or electron paramagnetic resonance [13]. This last method requires the incorporation of paramagnetic compounds and conveys information not only about pH values, but also about microviscosity and micropolarity [12].
In comparison with previously published works targeted on the preparation of hydrophilic swellable matrices, the present study focuses on the preparation and evaluation of hydrophilic–lipophilic (hypromellose (HPMC)–montanglycol wax) matrix tablets to ensure the pH-independent delivery of weakly basic drug by incorporating three organic acidifiers (citric, fumaric, and less known itaconic acids) differed in their concentrations, pKa, and solubility. The main part is devoted to the expression of the statistical significance of the above- mentioned acids’ properties on the drug dissolution profile and the surface pH of the gel layers. The full factorial design method and partial least squares PLS-2 regression were regarded as the best methods for the evaluation of the impact of otherwise hardly comparable parameters.
MATERIALS AND METHODS
Materials
Verapamil hydrochloride—VH (Chemos, Regenstauf, Germany)—was used as the model drug having pH-dependent solubility; HPMC K4M (Colorcon Limited, Dartford, Great Britain) as the hydrophilic swellable polymer, microcrystalline cellulose (MCC)-type Avicel® PH 101 (FMC Biopolymers, Rockland, United States of America) as the insoluble filler and montanglycol wax (kindly donated by Zentiva, Prague, Czech Republic) as the lipophilic carrier and acting also as a melting binder for thermoplastic granulation. Organic acid—citric (pKa1 = 3.1, solubility20°C in pH 6.8 = 651.9 mg/ml), fumaric (pKa1 = 3.0, solubility20°C in pH 6.8 = 10 mg/ml), and itaconic (pKa1 = 3.85, solubility20°C in pH = 93 mg/ml) acids (all Sigme-Aldrich, GmbH, Steinheim am Albuch, Germany) were used as pH modifiers for adjusting the internal pH of the matrix tablets [1]. Magnesium stearate (Peter Greven, Bad Műnstereifel, Germany) and colloid silica (Degussa, Vicenza, Italy) were used to improve granulate flow properties. All materials were of Ph. Eur. quality.
Methods
Measurement of Acidifiers Particle Size
The particle size of the organic acids sample obtained by sieving ranged between 125 and 250 μm was certified by optical analysis using an optical microscope (DN 45, Lambda, Prague, Czech Republic) connected to a CCD camera (Alphaphot, Nikon, Tokyo, Japan) and operated by Ia32 software. The measurements of 200 particles were taken.
Granulates Preparation, Matrix Tablets Preparation, and Evaluation
The powder blends (171.05 g) containing VH, HPMC K4M, montanglycol wax and the remaining part of either MCC PH 101 or organic acid or their 1:1 combination, were homogenized in a Turbula mixer (TC2, Basel, Switzerland) for 10 min. For the composition of the prepared tablet samples see Table I. The mixtures were oven-heated (RS 401A/1, Chirana, Prague, Czech Republic) at 80°C for 5 min using montanglycol wax (melting point of 79–85°C) to form granules [14]. Magnesium stearate (2.5%) and colloid silica (0.5%) were added to the prepared granules and mixing procedure continued for another 10 min. Matrix tablets weighting approximately 350 mg with similar hardness were compressed using 10 mm diameter flat-faced punches (Korsch, EK 0, Korsch Pressen, Berlin, Germany). Tablets of similar hardness were prepared for more accurate dissolution profiles comparison. Tablet characteristics, i.e., their weight uniformity—n = 20 (analytical balance Kern 870–13, Kern & Sohn GmbH, Germany), drug content—n = 10, spectrophotometric method at 278 nm (Lambda 25, Perkin Elmer, Wellesley, USA), hardness—n = 10 (C50 Tablet Hardness & Compression Tester, Engineering Systems, Notthingham, Great Britain), and friability—n = 1, weight of tested sample close to 6.5 g, 4 min (TAR 10, Erweka, Heusenstamm, TAR 10, Germany) were evaluated according to Ph.Eur.7.
Table I.
Matrix tablet compositions (same composition for prepared granules in g in half amount)
| Samplea | Verapamil-HCl [mg] | HPMC | Montanglycol wax | MCC [mg] | Acid (125–250 μm) [mg] | ||
|---|---|---|---|---|---|---|---|
| K4M [mg] | [mg] | Citric | Fumaric | Itaconic | |||
| R | 100 | 60 | 82.1 | 100 | – | – | – |
| 1A | 100 | 60 | 82.1 | 50 | 50 | – | – |
| 1B | 100 | 60 | 82.1 | – | 100 | – | – |
| 2A | 100 | 60 | 82.1 | 50 | – | 50 | – |
| 2B | 100 | 60 | 82.1 | – | – | 100 | – |
| 3A | 100 | 60 | 82.1 | 50 | – | – | 50 |
| 3B | 100 | 60 | 82.1 | – | – | – | 100 |
aEach sample contains 0.5% of aerosil and 2.5% of magnesium stearate for better flowbility; average weight from 20 measurements 345.7–354.9 mg (max. SD 2.6 mg)
Determination of Dissolution Profiles and Their Variability
Dissolution profiles of the prepared samples were determined (SOTAX AT 7 On-Line System - Donau Lab, Zurich, Switzerland) using dissolution test (paddle method; 100 rpm, 37°C) with by changing pH under the following conditions: at pH 1.2 (900 ml of artificial gastric juice) for 2 h, after a pH adjustment to pH 6.8, for 10 h. Sodium triphosphate (18.7 g) was used for the pH-increasing agent [15]. Samples were analyzed for the released drug amount in a UV spectrophotometer (Lambda 25, Perkin Elmer, Wellesley, USA) at 278 nm for VH [6]. The mean value of the six samples and the standard deviation (SD) of each tablet batch were calculated.
Similarity Factor Analysis
In order to compare the dissolution profiles of the tablet batches, the similarity factor f2 was calculated; these analyses are currently used to evaluate the significance of changes in dissolution curves. Similarity factors were calculated between the prepared samples and the reference sample, respectively, for determining the effect of the type and amount of acid modifiers, and also between the samples containing the same modifier for evaluating of the influence of the acid amount (1A/1B, 2A/2B, 3A/3B). The data were analyzed by Eq. 1 for similarity factor [16]:
 |
1 |
Here, n is number of time points, Ri and Ti are the dissolution data of a reference and tested samples at the time i. The similarity factor takes a value between 0 and 100. When it is 100 the two profiles are identical and when it approaches 0 their dissimilarity increases. Values of 50 or over were accepted as similar [17], and the observed influence is considered as non-significant.
Evaluation of Gel Layer pH
To evaluate the effect of the incorporated pH modifiers, the pH of the gel layer of the tested samples was measured within 8 h by a pH meter (pH 210, Hanna Instruments, Mauritius) equipped with a contact electrode. This test was performed by usage of dissolution apparatus separately from dissolution test but with the same internal conditions. The surface pH of the gel layer of three tablets was measured in 1 h’s time and then hourly. The tested tablet was removed from the dissolution vessel. The rest of the buffer from the tablet surface was bathed with purified water. After draining of excess water form tablet surface, the contact electrode was slightly pressed into the gel layer in the same manner as all the measured samples. For each time point, the average value and standard deviation were calculated. The evaluated samples were subsequently discarded from the test. For the following measurement, the other tablets, i.e., placed in the dissolution medium for the desired time interval, were used.
Drug Release Studies
In order to propose the drug release mechanism from matrix tablets, the experimental data were treated according to the following equations [18]:
 |
2 |
 |
3 |
 |
4 |
 |
5 |
 |
6 |
where Mt is the amount of drug released in time t; M∞ is the absolute cumulative amount of drug released at an infinite time; K0, K1, KH, and KBL are the zero order, first order, Higuchi, Baker–Lonsdale release constants, and KKP is the release constant comprised of the structural and geometrical characteristics of the tablets. Release exponent n characterizes the mechanism of the drug release, in particular, n = 0.5 corresponds to a Fickian diffusion release, 0,5 < n < 1,0 to an anomalous transport, n = 1.0 to zero-order release kinetics, and n > 1.0 to a super Case II transport [18, 19].
Statistical Data Analysis
The full factorial design method and partial least squares PLS-2 regression were used for expressing the statistical significance of the acids’ properties effect including solubility, pKa value and concentration in matrices on the dissolution profiles and the surface pH of the gel layers. Data were analyzed in Unscrambler X (v. 10.2, Camo software).
RESULTS AND DISSCUSSION
Measurement of Acidifiers Particle Size
Mean particle diameters (đ) of acidifiers fractions prepared by sieving were 200.1, 179.3, and 190.6 μm, for citric, fumaric, and itaconic acids, respectively. Particles of different size show the increasing solubility as particle diameter decreases, resulting in a change in the drug dissolution profiles. Therefore, the similar particle size of the acidifiers is necessary to reduce the above-described influence [20].
Matrix Tablets Characteristics
The samples properties are shown in Table II. The drug content of the studied formulations varied between 98.2% and 104.7% (max. SD 3.2%). The average weights of the hydrophilic–lipophilic matrix tablets from different batches varied from 345.7 to 354.9 mg (max. SD 2.6 mg). The hardness and friability of the tablets ranged between 111.2 to 126.9 N (max. SD 4.9 N), 0.17% to 0.23%, respectively. These results showed that all physical parameters of the compressed matrices were within the permissible limits of Ph. Eur. It is obvious that the tablets should have relatively similar properties, which is essential for comparability purposes resulting in the correct evaluation of acidifiers influence on the observed variables. To date, according to the available literature, slight differences in tablet hardness should not influence the drug dissolution profile [21].
Table II.
Matrix tablets characteristics
| Sample | Average drug content | Friabilityb | Hardnessa |
|---|---|---|---|
| a[%] ± SD | [%] | [n] ± SD | |
| R | 98.2 ± 0.6 | 0.18 | 115.7 ± 4.9 |
| 1A | 98.4 ± 1.4 | 0.23 | 123.7 ± 3.1 |
| 1B | 98.4 ± 3.2 | 0.22 | 126.9 ± 2.8 |
| 2A | 100.6 ± 1.2 | 0.22 | 118.1 ± 2.8 |
| 2B | 104.7 ± 0.6 | 0.26 | 111.2 ± 1.7 |
| 3A | 98.5 ± 1.5 | 0.17 | 119.7 ± 13.1 |
| 3B | 100.6 ± 1.6 | 0.23 | 113.7 ± 3.9 |
aAverage value from 10 measurements
bOne measurement
Dissolution, Similarity Factor Analysis, and Drug Release Study
In vitro dissolution studies of samples were performed by the method of changing pH values, which better corresponds to the real conditions in the gastrointestinal tract (2 h in pH 1.2 and following 10 h in pH 6.8) [15]. The sample R containing MCC instead of pH modifiers was used as the reference sample for evaluating acidifier impact on drug release. VH was released faster in simulated gastric juice, almost 37% within 2 h. Predictably, the pH increasing to 6.8 slowed down the VH release and only another 16% was released during the dissolution test (totally 52%). This dissolution behavior is typical for weakly basic drugs with pH-dependent solubility, which for VH, is below a pH of 6.35, is greater than 100 mg/ml; at pH 6.45, it decreases to approximately 50 mg/ml, and at 6.8 pH it equals 2.71 mg/ml [6]. The incorporation of tested pH modifiers significantly changed the dissolution curves; Figs. 1, 2, and 3 demonstrate the in vitro dissolution profiles of VH from matrices.
Fig. 1.

Release amount of verapamil-hydrochloride from the sample containing citric acid A (50 mg/tbl) and 1B (100 mg/tbl) during the dissolution test (2 h in 1.2, 2–12 h, pH 6.8)—comparison with reference sample R
Fig. 2.

Release amount of verapamil-hydrochloride from the sample containing fumaric acid 2A (50 mg/tbl) and 2B (100 mg/tbl) during the dissolution test (2 h in 1.2, 2–12 h, pH 6.8)—comparison with reference sample R
Fig. 3.
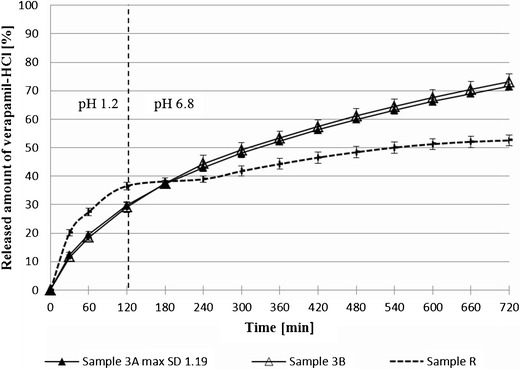
Release amount of verapamil-hydrochloride from the sample containing itaconic acid 3A (50 mg/tbl) and 3B (100 mg/tbl) during the dissolution test (2 h in 1.2, 2–12 h, pH 6.8)—comparison with reference sample R
The typical characteristic for samples containing the acids that can be seen was a slower VH release in the first part of dissolution test (pH 1.2), followed by more a uniform drug release in the second part, for all samples more than 70%. The slower VH release in pH 1.2 can most likely be explained by the formation of a more uniform gel layer on the tablet surface if the insoluble filler—MCC—was not part of the tablets or if its amount decreased. This foundation is in agreement with literature data [22]. From a similarity factor f2 analysis (Table III), it is evident, that the presence of acidifiers in the matrix tablets had a remarkable impact on VH liberation (similarity factor f2 37.5-48.0). The VH release profile was also slightly influenced by the concentration of acids in the matrices. Despite a more noticeable effect for highest soluble citric acid, similarity factor f2 analysis confirmed that this parameter was of no significance. The closer to the pH non-dependent VH dissolution profile was sample 1B with 100 mg of citric acid in its composition, and comparable results were also obtained from sample 2B with 100 mg fumaric acids (both were near 80% of VH). Similar results were achieved in a research paper studying the release behavior of the weakly basic drug cinnarizine hydrochloride [23].
Table III.
Similarity factor analysis
| Sample | Similarity factor f 2 between samples | |||||
|---|---|---|---|---|---|---|
| 1A | 1B | 2A | 2B | 3A | 3B | |
| R | 48.0 | 37.5 | 43.8 | 40.0 | 47.1 | 45.1 |
| A/B | 56.8 | 77.9 | 90.6 | |||
The release data of all samples obtained during the dissolution test were examined according to Eqs. 2–6, and are summarized in Table IV. The dissolution data were in agreement with Higuchi (R2 > 0.98 for sample R, for others R2 ≥ 0.99) and the Baker–Lonsdale model (R2 > 0.99) confirming the Fickian diffusion as the predominant release mechanism of VH. This foundation is in agreement with literature data saying, that diffusion is the typical release mechanism for highly soluble drugs [24], especially when HPMC as matrix carrier controls the drug release by its own swelling mechanism [25]. Despite a decrease in the VH solubility pH 6.8, the diffusion release mechanism probably was maintained also in second phase of dissolution test due to extensive pores formation at pH 1.2. A poor correlation was observed with the zero order model (R2 < 0.967) and first order model (R2 < 0.813) indicating that releasing of VH is not completely according to zero or first order kinetics, even though the zero order correlation is more significant. Interesting results confirming the above conclusions were obtained from Korsmeyer–Peppas kinetic model and the calculated release exponent n was used for predicting the VH release mechanism. Exponent n ranged from 0.520 to 0.589 and it showed the anomalous transport characterized by the minor participation of the erosion process in VH release from samples containing acidifiers. This foundation is supported by literature sources [26]. When comparing samples containing the same acid in different amounts, a decrease of exponent n was observed when higher amounts of acid were used. This observation can be ascribed to the smaller role of erosion when all insoluble MCC in the tablets was replaced either totally or partially by a more soluble acid, which can produce more pores and channels throughout tablets, thus supporting VH diffusion [27]. The decreasing value of release exponent n with an increasing amount of citric acid in the HPMC matrix was also found in research published by Nie et al. Lower n indicated that there was a trend favoring the mechanism of diffusion with the addition of increasing quantities of citric acid [28].
Table IV.
Fittings of verapamil-HCl release data to different kinetic equations
| Model | Zero order | First order | Higuchi | Korsmeyer–Peppas | Baker–Lonsdale | |
|---|---|---|---|---|---|---|
| Sample | R 2 | R 2 | R 2 | R 2 | n | R 2 |
| R | 0.9551 | 0.8129 | 0.9807 | 0.9498 | 1.1490 | 0.9915 |
| 1A | 0.9658 | 0.7696 | 0.9931 | 0.9880 | 0.5864 | 0.9977 |
| 1B | 0.9676 | 0.7697 | 0.9900 | 0.9847 | 0.5370 | 0.9990 |
| 2A | 0.9622 | 0.7844 | 0.9943 | 0.9910 | 0.5888 | 0.9974 |
| 2B | 0.9634 | 0.7923 | 0.9924 | 0.9929 | 0.5201 | 0.9995 |
| 3A | 0.9689 | 0.7899 | 0.9956 | 0.9929 | 0.5694 | 0.9984 |
| 3B | 0.9644 | 0.8001 | 0.9968 | 0.9948 | 0.5407 | 0.9986 |
Tablet Surface pH Measurements Using Contact Electrode
To determine the influence of acidifiers on VH release characteristics, the surface pH of the gel layer was measured every hour during 8 h of the study using a surface pH microelectrode connected with a pH meter (see Fig. 4). The conditions of the test were the same as the evaluation of the dissolution behavior of the prepared tablets. From the results, it was obvious that gel layer pH of all of the samples practically copied the pH value of the dissolution medium, when artificial gastric juice was used (pH 1.2) and ranged in intervals of 1.23–1.65 after 120 min. After the pH change to 6.8, the differences were observed between samples. The surface pH of sample R without any pH modifier took its value from 6.54 to 6.76 and approximated the pH value of the external environment. The increase of gel layer pH, while maintaining the acidification of the gel layer was typical for the samples containing acids. In intervals of 180–480 min, only a slight increase of gel layer pH was observed with the exception of samples 1A and 1B containing citric acid. For these samples, the sharp increase in pH was observable after 360 min of the test. This foundation can be explained by the complete leaking of the most soluble citric acid from the structure of matrix, whereas less soluble acidifiers were released continually. According to literature sources, the gradually increasing gel layer pH was described in a similar matrix [23]. An explanation might be that the presence of lipophilic wax in the matrix could cause the different release behavior of acidifiers. Surprisingly, the significant increase in the gel layer pH of the samples 1A and 1B at time 420 min had no impact on the dissolution profile (Fig. 1) and VH release continued without any observable changes. The explanation of this phenomenon could be seen in the formation of an extensive porous structure inside the matrix after leaking of citric acid and more than half amount of VH, resulting in the sufficient surface area for steady VH release even at significantly lower drug solubility.
Fig. 4.
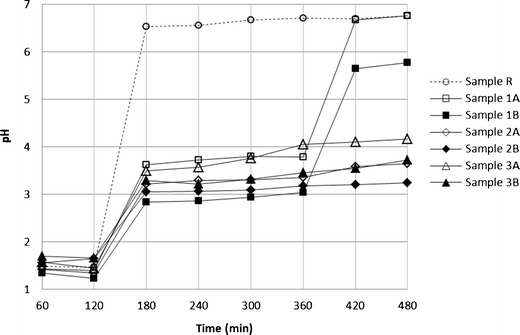
Change of gel layer pH within the dissolution test of the matrix tablets (2 h in 1.2, 2–12 h pH 6.8); max. SD 0.23
The exact influence of the incorporation of pH modifiers, differing in their solubility, strength, and amount, on the surface pH of the gel layer and consequently on VH drug release is very complicated to assess; therefore, the application of multivariate data analysis for obtained data is very suitable.
Statistical Evaluation of Results
The full factorial design was applied on the obtained data for the expression of the statistical significance of the studied variables (used pH modifier—citric vs. fumaric vs. itaconic acids and its concentration in tablets 50 mg vs. 100 mg) on effect parameters (drug release behavior and surface pH of gel layer). The results from 36 tests (6 samples were evaluated six times) were included in the statistical analysis. A statistical significance was found in the concentration of pH modifier (p < 0.01) and the type of pH modifier used (p < 0.05) on VH released from matrix tablets and the surface pH of the gel layer, both in a time interval of 360 and 480 min.
Furthermore, partial least square regression (PLS-2) was used for a more complex description of the effects of pH modifiers on the effect variables. Prior to modeling, the variables were adjusted by autoscaling, which uses mean-centering followed by dividing each variable by its total standard deviation. The obtained model allowed the determination and quantification of the relationships between the studied variables of the X-matrix (pH modifier, its concentration, pKa and solubility) and the effects of the Y-matrix (dissolution characteristics, surface pH of gel layer) resulting in correlation-loading plot (Fig. 5). The presence of variables symbols in the space between outer and inner ellipse indicates a degree of correlation explanation. Position on the inner ellipse means 50% of explained variance and towards outer ellipse rises up to 100%. The location of the studied variable and effect parameters near each other shows the positive correlation, and a position in opposite arcs indicates a negative correlation of variables. Variances located in the inner ellipse are only partially explained. Martens’ uncertainty test (p = 0.05) was used to estimate the approximate uncertainty variance of PLS regression coefficients which is performed by full cross-validation and based on the Jack-knifing principle [29].
Fig. 5.
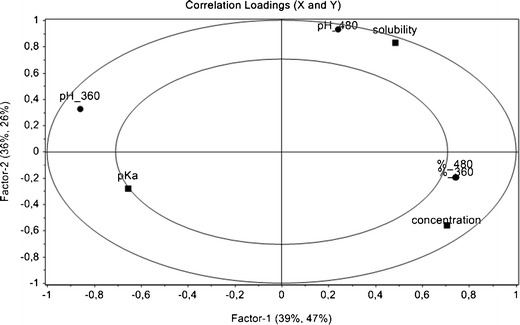
Correlation-loading plot showing the relationships between the studied variables of the X-matrix expressed as boxes (acidifier properties—concentration, pK a, and solubility) and the effects of the Y-matrix expressed as circles (amount of drug release in 360 and 480 min—% 360 and % 480, surface pH of gel layer in 360 and 480 min—pH 360 and pH 480; The first two PLS components describe 75% and 73% variation in the X- and Y-data, respectively)
First, two PLS components were described 75% and 73% variation in the X- and Y-data, respectively. In contrast to the results of similarity analysis f2, the more accurate statistical results indicated that the main critical point (p < 0.01) was the concentration of the acidifier in the matrix tablets which affected all the effect variables. On the one hand, VH release in both selected time intervals was positively correlated; on the other, the pH of gel layer in 360 min was negative with acid concentration. Acid strength expressed as pKa was considered as the crucial parameter (p < 0.01) for drug release in selected intervals, for surface pH only at 360 min (p < 0.01); at 480 min, the significance of studied effect was not confirmed. The acid solubility did not influence the effects except for the surface pH value within 480 min (Fig. 4). These findings are in an agreement with the steady VH dissolution profile in samples 1A and 1B after leaking of citric acid.
CONCLUSION
The incorporation of three organic acidifiers (citric, fumaric, and itaconic acids) with different concentrations, pKa, and solubility into HPMC–montanglycol wax matrix tablets, led to the improvement of verapamil-hydrochloride release near the pH-independent dissolution profile when 100 mg of citric or fumaric acid was used. The full factorial design method and partial least squares were applied to the results, and it was concluded that the main crucial points were the concentration and strength of the acidifier incorporated into the matrix. Surprisingly, the extensive influence of acid solubility was not confirmed.
Acknowledgments
This experimental work was realized by support IGA VFU Brno Czech Republic, project 99/2013/FaF.
References
- 1.Siepe S, Lueckel B, Kramer A, Ries A, Gurny R. Strategies for the design of hydrophilic matrix tablets with controlled microenvironmental pH. Int J Pharm. 2006;316:14–20. doi: 10.1016/j.ijpharm.2006.02.021. [DOI] [PubMed] [Google Scholar]
- 2.Hörter D, Dressman JB. Influence of physicochemical properties on dissolution of drugs in the gastrointestinal tract. Adv Drug Deliv Rev. 2001;45:75–87. doi: 10.1016/S0169-409X(00)00130-7. [DOI] [PubMed] [Google Scholar]
- 3.Gutsche S, Krause M, Kranz H. Strategies to overcome pH-dependent solubility of weakly basic drugs by using different types of alginates. Drug Dev Ind Pharm. 2008;34:1277–84. doi: 10.1080/03639040802032895. [DOI] [PubMed] [Google Scholar]
- 4.Tatavarti AS, Hoag SW. Microenvironmental pH modulation based release enhancement of a weakly basic drug from hydrophilic matrices. J Pharm Sci. 2006;95:1459–68. doi: 10.1002/jps.20612. [DOI] [PubMed] [Google Scholar]
- 5.Körber M, Ciper M, Hoffart V, Pearnchob N, Walther M, Macrae RJ, et al. Enteric polymers as acidifiers for the pH-independent sustained delivery of a weakly basic drug salt from coated pellets. Eur J Pharm Biopharm. 2011;78:447–54. doi: 10.1016/j.ejpb.2011.03.018. [DOI] [PubMed] [Google Scholar]
- 6.Streubel A, Siepmann J, Dashevsky A, Bodmeier R. pH-independent release of a weakly basic drug from water insoluble and soluble matrix tablets. J Control Release. 2000;67:101–10. doi: 10.1016/S0168-3659(00)00200-5. [DOI] [PubMed] [Google Scholar]
- 7.Padhy KK, Swain K, Chowdary KA. Influence of organic acids on drug release pattern of verapamil hydrochloride pellets. J Adv Pharm Res. 2010; 1: 65–73. http://pharmresfoundation.com/JAPR-2010-1(1)-65-73.pdf. Accessed 15 Feb 2013.
- 8.Varma MVS, Kaushal AM, Garg S. Microenvironmental pH modulation in solid dosage forms influence of micro-environmental pH on the gel layer behavior and release of a basic drug from various hydrophilic matrices. J Control Release. 2005;103:499–510. doi: 10.1016/j.jconrel.2004.12.015. [DOI] [PubMed] [Google Scholar]
- 9.Bolourchian N, Dadashzadeh S. pH-independent release of propranolol hydrochloride from HPMC based matrices using organic acids. DARU. 2008;16:36–142. [Google Scholar]
- 10.Espinoza R, Hong E, Villafuerte L. Influence of admixed citric acid on the release profile of pelanserin hydrochloride from HPMC matrix tablets. Int J Pharm. 2000;201:165–73. doi: 10.1016/S0378-5173(00)00406-3. [DOI] [PubMed] [Google Scholar]
- 11.Dvořáčková K. Drug release from oral matrix tablets containing hypromelose. Chem List. 2009;103:66–72. [Google Scholar]
- 12.Eisenächer F, Schädlich A, Mäder K. Monitoring of internal pH gradients within multi-layer tablets by optical methods and EPR imaging. Int J Pharm. 2011;417:204–15. doi: 10.1016/j.ijpharm.2010.10.010. [DOI] [PubMed] [Google Scholar]
- 13.Siepe S, Herrmann W, Borchert HH, Lueckel B, Kramer A, Ries A, et al. Microenvironmental pH and microviscosity inside pH-controlled matrix tablets: an EPR imaging study. J Control Release. 2006;112:72–8. doi: 10.1016/j.jconrel.2005.12.021. [DOI] [PubMed] [Google Scholar]
- 14.Dvořáčková K, Masteiková R, Rabišková M, Vocilková L. Termoplastická granulace jako alternativa přípravy hydrofilně-lipofilních perorálních matricových tablet. Čes Slov Farm. 2007;56:129–34. [PubMed] [Google Scholar]
- 15.Franc A, Sova P. Oral pharmaceutical composition for targeted transport of a platinum complex into the colorectal region, method for producing and use as medicament thereof European Patent Office, Available from: URL: http://v3.espacenet.com. Accessed 20.1.2009.
- 16.Moore JW, Flanner HH. Mathematical comparison of dissolution profiles. Pharmacol Tech. 1996;20:64–74. [Google Scholar]
- 17.Ch L, Lu Y, Chen J, Zhang W, Wu W. Synchronized and sustained release of multiple component in silymarin from erodible glyceryl monostearate matrix tablet system. Eur J Pharm Biopharm. 2007;66:210–9. doi: 10.1016/j.ejpb.2006.11.008. [DOI] [PubMed] [Google Scholar]
- 18.Costa P, Lobo JMS. Modeling and comparison of dissolution profiles. Eur J Pharm Sci. 2001;13:123–33. doi: 10.1016/S0928-0987(01)00095-1. [DOI] [PubMed] [Google Scholar]
- 19.Samani SM, Montaseri, Kazemi A. The effect of polymer blends on the release profiles of diclofenac sodium from matrices. Eur J Pharm Biopharm. 2003;55:351–5. doi: 10.1016/S0939-6411(03)00030-4. [DOI] [PubMed] [Google Scholar]
- 20.Dvořáčková K, Rabišková M, Masteiková R, Muselík J, Krejčová K. Soluble filler as the dissolution profile modulator for slightly soluble drugs in matrix tablets. Drug Dev Ind Pharm. 2009;35:930–40. doi: 10.1080/03639040802710243. [DOI] [PubMed] [Google Scholar]
- 21.Huber HE, Christenson GL. Utilisation of hydrophilic gums for the control of drug substance release from tablet formulations II. Influence of tablet hardness and density on dissolution behavior. J Pharm Sci. 1968;57:164–6. doi: 10.1002/jps.2600570135. [DOI] [PubMed] [Google Scholar]
- 22.Akbari J, Nokhodchi A, Farid D, Adrangui M, Siahi-Shadbad MR, Saeedi M. Development and evaluation of buccoadhesive propranolol hydrochloride tablet formulations: effect of fillers. IL Farmacol. 2004;59:155–61. doi: 10.1016/j.farmac.2003.11.011. [DOI] [PubMed] [Google Scholar]
- 23.Mehta DM, Parejiya PB, Barot BS, Shelat K. Investigation of the drug release modulating effect of acidifiers in modified release oral formulation of cinnarizine. Asian J Pharm Sci. 2012;7:193–201. [Google Scholar]
- 24.Kojima H, Yoshihara K, Sawada T, Kondo H, Sako K. Extended release of a large amount of highly water-soluble diltiazem hydrochloride by utilizing counter polymer in polyethylene oxides (PEO)/polyethylene glycol (PEG) matrix tablets. Eur J Pharm Biopharm. 2008;70:556–62. doi: 10.1016/j.ejpb.2008.05.032. [DOI] [PubMed] [Google Scholar]
- 25.Baviskar D, Sharma R, Jain D. Modulation of drug release by utilizing pH-independent matrix system comprising water soluble drug verapamil hydrochloride. Pak J Pharm Sci. 2013;26:137–44. [PubMed] [Google Scholar]
- 26.Chakraborty S, Khandai M, Sharma A, Patra CN, Patro VJ, Sen KK. Effects of drug solubility on the release kinetics of watersoluble and insoluble drugs from HPMC based matrix formulations. Acta Pharma. 2009;59:313–23. doi: 10.2478/v10007-009-0025-8. [DOI] [PubMed] [Google Scholar]
- 27.Maderuelo C, Aránzazu Z, Lanao JM. Critical factors in the release of drugs from sustained release hydrophilic matrices. J Control Release. 2011;154:2–19. doi: 10.1016/j.jconrel.2011.04.002. [DOI] [PubMed] [Google Scholar]
- 28.Nie S, Pan W, Li X, Wu X. The effect of citric acid added to hydroxypropyl methylcellulose (HPMC) matrix tablets on the release profile of vinpocetine. Drug Dev Ind Pharm. 2004;30:627–35. doi: 10.1081/DDC-120037664. [DOI] [PubMed] [Google Scholar]
- 29.Martens H, Martens M. Modified jack-knife estimation of parameter uncertainty in bilinear modeling by partial least squares regression (PLSR) Food Qual Prefer. 2000;11:5–16. doi: 10.1016/S0950-3293(99)00039-7. [DOI] [Google Scholar]