

Abstract
The aim of the study was to investigate the factors affecting the stability and performance of ipratropium bromide and fenoterol hydrobromide in a pressurized-metered dose inhaler (pMDI). A factorial design was applied to investigate the effects of three parameters (propellant, water, and ethanol) on the performance of 27 designed formulations of a solution-based pMDI. The formulations that contained a hydrofluoroalkane (HFA) propellant lower than 72% v/v and an ethanol concentration higher than 27% v/v remained as clear solutions. Nine formulations that contained the HFA propellant higher than 74% v/v precipitated. The results indicated that it was not only the HFA propellant content of the formulations that was related to the formulation instability but also ethanol content. Only six formulations from the 18 formulations, that did not precipitate, produced drug contents that were within the acceptable range (80–120%). These six formulations generated aerosols with mass median aerodynamic diameters (MMAD) of approximately 2 μm with a fine particle fraction (FPF; particle size, <6.4 μm) between 45% and 52%. The MMAD and FPF did not change significantly after 6 months of storage (P > 0.05).
KEY WORDS: fenoterol hydrobromide, ipratropium bromide, pressurized metered dose inhaler, stability
INTRODUCTION
Pressurized-metered dose inhalers (pMDIs) are dosage vehicles that deliver drugs to the respiratory tract. There are two types of pMDI formulations: suspension and solution. A typical suspension formulation contains a drug, a surfactant, a co-solvent, and a propellant. The solution formulations contain the active drug completely solubilized in the propellant and co-solvent mixtures (1).
In a solution system, it is necessary for the drug to have a high solubility in the propellant and co-solvent system and the drug must have sufficient chemical stability to allow for therapeutic doses to be repeatedly delivered sometimes over a long period of time. Hydrofluoroalkane (HFA) propellants have been used in pMDIs since the 1990s (2). Their vapor pressure and density are two important physicochemical characteristics that greatly impact the characteristics of the aerosol and their overall formulations characteristics (3–6). The solvent properties of HFA propellants are dramatically different from those of the previously used chlorofluorocarbons, as the HFA propellants are poor solvents for many of the currently available anti-asthma drugs (7). Moreover, many of the normal excipients are also poorly soluble in HFA propellants, yet the physical/chemical stability and solubility of the drug has to be proven to be maintained throughout their shelf life. Co-solvents are therefore required to dissolve the active ingredients to produce a completely soluble active drug in the formulation (8). Sometimes, a co-solvent can cause a disagreeable taste and produce changes to the aerosol characteristics. The addition of nonvolatile and semivolatile compounds also affects the aerosol characteristics (9) so these factors also have to be considered. There are some difficulties for development of a low-propellant soluble drug to obtain a high physical and chemical stability with suitable aerosol properties. Information on the solubility of a drug alone may not provide sufficient information to design a formulation. This study has developed a basic knowledge that will allow one to justify the use of a suitable solvent and an inhaler system for a metered dose inhaler (MDI) formulation.
As for the other active chemicals, ipratropium bromide is an anticholinergic bronchodilator, a synthetic quaternary ammonium compound chemically related to atropine. It is a white or almost white, crystalline powder, soluble in water, freely soluble in methanol, and slightly soluble in ethanol. Ipratropium bromide is poorly absorbed from the respiratory system (6%) and gastrointestinal tract (2%; 5,10,11). Fenoterol hydrobromide is a direct acting sympathomimetic agent with a predominantly β-adrenergic activity and a selective action on β2-receptors. It is a white, crystalline powder, soluble in water and in alcohol (11–13). Ipratropium bromide and fenoterol hydrobromide have been used as model drugs in this study due to their low solubility in the propellant system. The high values of the dielectric constant (ε) of ipratropium bromide and fenoterol hydrobromide (ε = 45.9 and 59.1, respectively) compared with the low dielectric constant of the HFA 134a propellant (ε = 9.5) confirmed that the active ingredients could not dissolve in the propellant system. The key components of pMDIs consist of a metering valve, actuator, propellant, and formulation. All play key roles in producing the most efficient delivery systems for the aerosol. The pMDI should deliver an accurate dose from the first until the last dose for consistent performance to be achieved (3,14,15).
Even though ipratropium bromide and fenoterol hydrobromide inhaler formulations are available in the market today, very few manufacturers have provided rational explanations for the development of their pMDI-based products (16,17). The patents describing the inventions of the above formulations have revealed a wide range of possibilities for the compositions and indicate some important parameters such as the stability of the active ingredients and aerosol properties that need to be considered (14). However, several factors that can affect the stability of these two drugs in the MDI formulation are still unclear.
For example, there is a relationship between the pH and the solubility of weak electrolytes as described by the Henderson–Hasselbalch equation. In this case, those two drugs are weak bases. A base is predominantly ionic at low pH values and therefore highly soluble in an aqueous medium. More undissociated base forms occur as the pH is increased and the proportions of the various forms with respect to the total API concentration can be calculated by the Henderson–Hasselbalch equation (18). When the amount of base exceeds the limited water solubility of this form, the free base precipitates from the solution. Therefore, the solution should be kept at a sufficiently low pH so that the concentration of the base in equilibrium with its salt is calculated to be less than the solubility of the free base (18). Stabilization against precipitation can be maintained by also adjusting to a suitable dielectric constant for the solvent system (19). The dielectric constants of the solvent system can be related to the drug solubility as described by Gorman and Hall (19).
The aim of this study was to investigate factors that affected the stability of ipratropium bromide and fenoterol hydrobromide pMDI in an HFA propellant. In addition, the influence of the composition of the propellant and co-solvents on the performance of the formulations was studied using a factorial experimental design. The dielectric constant was chosen as the main parameter to select a suitable solvent system for these two drugs. The other parameters included physical stability of the finished products and their aerosolization properties.
MATERIALS AND METHODS
Materials
Ipratropium bromide BP (Lusochimica, Lomagna, Italy), fenoterol hydrobromide BP (Lusochimica), and the HFA 134a propellant (ZEPHEXTM 134a, Mexichem Fluor Limited, Cheshire, UK) were gifts from Impact Pharma Co., Ltd., Thailand. Absolute ethanol was obtained from Lab-Scan Analytical Sciences, Thailand. Chemicals used in the analytical processes were from local suppliers in Thailand. All chemicals were of analytical grade and used as received.
Experimental Design
The compositions of the 27 designed formulations are shown in Table I. The overall composition of the formulations included fenoterol hydrobromide and ipratropium bromide as the active ingredients. The content of water was varied from 1.0% to 2.5% v/v, the content of the absolute ethanol was varied from 21.3% to 34.4% v/v, and the concentrations of the HFA 134a propellant was changed from 63.8% to 77.3%. All values were calculated from the total content of the pMDI. A three-level full factorial design was applied to investigate the effects of the three factors on the stability and performance of the pMDI. Hydrochloric acid (1 N) was used to adjust the pH (0.01% w/w in each formulation).
Table I.
Contents, Vapor Pressure, pH and Dielectric Constant of Solution-Based pMDI
| Formulations | Water (% v/v) | EtOH (% v/v) | HFA 134a (% v/v) | Vapor pressure (kPa) | pH | ε of solvent system |
|---|---|---|---|---|---|---|
| #1 | 1.1 | 21.6 | 77.3 | 385.40 | 3.30 | 13.5+ |
| #2 | 1.2 | 22.6 | 76.2 | 377.87 | 3.40 | 13.7+ |
| #3 | 1.3 | 24.0 | 74.7 | 367.94 | 3.40 | 13.9+ |
| #4 | 1.1 | 26.9 | 72.0 | 353.57 | 3.40 | 14.2 |
| #5 | 1.1 | 28.1 | 70.8 | 345.44 | 3.40 | 14.4 |
| #6 | 1.2 | 29.7 | 69.1 | 334.82 | 3.38 | 14.7 |
| #7 | 1.0 | 31.3 | 67.7 | 327.98 | 3.40 | 14.8 |
| #8 | 1.0 | 32.7 | 66.3 | 319.55 | 3.57 | 15.0 |
| #9 | 1.1 | 34.4 | 64.5 | 308.61 | 3.57 | 15.4 |
| #10 | 1.7 | 21.4 | 76.9 | 376.66 | 3.23 | 13.8+ |
| #11 | 1.8 | 22.4 | 75.8 | 368.94 | 3.27 | 14.1+ |
| #12 | 1.9 | 23.9 | 74.2 | 358.78 | 3.23 | 14.3+ |
| #13 | 1.6 | 26.7 | 71.7 | 346.21 | 3.26 | 14.6 |
| #14 | 1.7 | 27.9 | 70.4 | 337.98 | 3.33 | 14.8 |
| #15 | 1.8 | 29.5 | 68.7 | 327.25 | 3.42 | 15.1 |
| #16 | 1.5 | 31.2 | 67.3 | 321.66 | 3.42 | 15.2 |
| #17 | 1.6 | 32.4 | 66.0 | 313.18 | 3.49 | 15.4 |
| #18 | 1.6 | 34.3 | 64.1 | 302.18 | 3.37 | 15.7 |
| #19 | 2.2 | 21.3 | 76.5 | 368.62 | 3.30 | 14.2+ |
| #20 | 2.3 | 22.4 | 75.3 | 360.74 | 3.40 | 14.4+ |
| #21 | 2.5 | 23.7 | 73.8 | 350.40 | 3.40 | 14.7+ |
| #22 | 2.1 | 26.6 | 71.3 | 339.43 | 3.48 | 14.9 |
| #23 | 2.2 | 27.8 | 70.0 | 331.11 | 3.48 | 15.1 |
| #24 | 2.3 | 29.4 | 68.3 | 320.28 | 3.30 | 15.4 |
| #25 | 2.0 | 31.0 | 67.0 | 315.81 | 3.36 | 15.5 |
| #26 | 2.0 | 32.4 | 65.6 | 307.28 | 3.36 | 15.7 |
| #27 | 2.2 | 34.0 | 63.8 | 296.25 | 3.37 | 16.1 |
+ Precipitation
Preparation of the pMDIs
The micronized ipratropium bromide (1.0 mg) and micronized fenoterol hydrobromide (2.5 mg) were first dissolved in absolute ethanol and water, respectively. Hydrochloric acid (1 N, 1.2 mg per formulation or 6 × 10⁻³ mg per dose) was used to adjust the pH to 3.5, then solutions were mixed homogeneously until a clear solution was obtained as a concentrated stock solution. Aliquots of the stock solution, enough to obtain 220 doses, were pipetted into clear glass canisters with a 20 mm neck diameter (Schott AG, Mainz, Germany). The glass canisters were made for filling with the HFA propellant and were able to withstand a pressure of around 100 psig to avoid the risk of shattering in use under ordinary conditions. Then a 50 μL metering valve was crimp-sealed onto the canister with the laboratory aerosol crimping machine (model 2016, Pamasol Willi Mäder, Zurich, Switzerland) and the canister was filled with the desired amount of liquefied propellant under pressure through the crimped valve with the same machine (model 2016, Pamasol Willi Mäder, Zurich, Switzerland). The variability of the gas filling machine was within 0.5 mL. The fill volume for each canister was 12 mL. The ipratropium bromide and fenoterol hydrobromide were completely dissolved in the propellant system as observed through the clear glass canisters. The valve was able to deliver simultaneously 20 and 50 μg of ipratropium bromide and fenoterol hydrobromide per actuation, respectively.
Dielectric Constant Measurement
The ε were measured using an Agilent 4284A precision Inductance Capacitance Resistance meter with lead zirconate titanate and a four terminal cell Agilent 16451A Dielectric Test Fixtures as cell electrical capacitance determinations with and without the sample. The sample was filled in the spectrometer chamber to about 3.44 mL. Values of the ε of the samples (water, ethanol, and 50% ethanol in water) were determined by using the capacitive measurement method at an alternating current (AC) frequency that ranged from 75 kHz to 30 MHz (20). In addition, the dielectric constant of a mixed solvent (εmixt) was calculated according to the ε value of each component, A and B in Eq. (1).
 |
1 |
Where εmixt is the ε of the mixture solvent, εA, εB, are the ε values of the solvents A and B, respectively and the %A and %B are the concentrations of solvent in the mixed solution (in percent v/v).
In addition, the dielectric constant values for ipratropium bromide and fenoterol hydrobromide powders were measured separately by a similar method as for a liquid sample except the powder was compressed into a cylindrical disk with a diameter of 10 mm and a thickness of 3 mm. The disk sample was placed in the capacitance chamber to measure the capacitance within a similar frequency range to that used for the liquid measurements. The dielectric constant was determined when the curve of the permittivity versus the AC frequency reached a plateau. Dielectric constants were extracted from the values that were midpoints in the plateau range (21,22).
Analysis of Ipratropium Bromide and Fenoterol Hydrobromide Produced by the pMDI Formulations
The HPLC system used for analysis consisted of a Spectra System SCM 1000 and Spectra System Pump P2000, plus an auto sampler, a Spectra System AS 3000 equipped with a Spectra System SN4000 and a Spectra System UV 1000 detector (ThermoElectron Corporation, California, USA). A BDS Hypersil C18 column (150 × 4.6 mm id, 5 μm; Thermo Scientific, UK) was used as the stationary phase. The mobile phase consisted of acetonitrile and aqueous 50 mM H3PO4 pH 3.2 (35:65) containing 12 mM 1-heptanesulfonic acid sodium salt (Pic®B-7, Waters, Milford, MA, USA) as an ion pair reagent. The mobile phase was set at a flow rate of 1.2 mL/min at ambient temperature. The UV detector was operated at 210 nm (11). The injection volume was set at 100 μL.
Assessment of Physical Stability
A physical stability assessment was performed after the formulations were stored for a short period (initially and after 3 and 6 months at 25°C). This experiment avoided the testing using accelerated conditions because the formulation contained propellant gas and at a higher temperature the internal pressure may build up and cause an explosion. The physical stability of the solution formulation was determined by visual examination for the appearance of a precipitate. The glass canisters used in this study enabled the formulation contained therein to be inspected visually. Each formulation was assessed for aerosol characteristics initially and again after 3 and 6 months storage.
Contents of the Active Ingredients Delivered by Actuation of the Valve
The content of the active ingredient delivered through the metering valve was determined by discharging the pressurized container through the central hole of a stainless steel base plate (made in house as described in BP (23) and shown in Fig. 1) after being placed in a vessel to capture the spray. A volume of 20 mL of the mobile phase was added into the vessel before the experiment. The inhaler was discharged in the inverted position under the surface of the solvent that was then adjusted to a volume of 50 mL in a volumetric flask with the mobile phase. The pressurized inhaler was shaken for 30 s prior to collection of the dose and the first two doses were discharged to waste. Ten deliveries at the beginning, mid, and the end of the calculated number of doses were analyzed for the amount of the active ingredients by HPLC as previously described. The result was calculated as the amount of active ingredient delivered from each actuation of the valve.
Fig. 1.
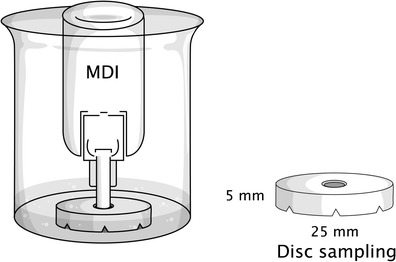
Schematic diagram showing the method used to assay active pharmaceutical ingredients by depositing the formulation onto a centrally located disk sampler
Uniformity of Delivered Dose
The formulations were tested for uniformity of their dose using the sampling apparatus as specified in BP (23) (the amount of drug that the user actually received) from the MDI. The pMDIs were connected to the apparatus by a vacuum pump capable of continuously drawing 28.3 L/min (±5%) through the assembled system (including the filter and inhaler). The pressurized container was shaken for 30 s, discharged to waste, and then actuated for delivery of one dose consecutively into the apparatus. The collection tube together with the filter was removed, solvent added, capped, and then agitated to assist in dissolution of the drug prior to recovery. The volume was adjusted to 25 mL in a volumetric flask with the mobile phase and analyzed for the amount of active ingredient by HPLC-UV spectrophotometry. This test involved determining the dose content at the beginning dose (2–4), mid dose (100–103), and the end dose (198–200) of the calculated number of doses. The percentage coefficient of variation (%CV) of the ten doses was calculated as a measure of uniformity of the delivered dose.
Assessment of the Fine Particle Fraction
The fine particle fraction was assessed using a glass twin stage liquid impinger (TSI, Copley Scientific Ltd., Nottingham, UK) (23). In this study, the TSI was employed to determine the FPF (aerodynamic diameters less than 6.4 μm) as a quality-controlled procedure for aerosol products although it was operated at a fixed flow rate that did not mimic the actual breathing patterns of patients. A volume of 7 and 30 mL of the mobile phase was introduced into the upper and lower impingement chambers, respectively. The pressurized container was shaken for 5 s and five doses were discharged to waste. The pMDI was connected to the TSI using an actuator adapter. One dose was discharged into the impinger at the operation flow rate of 60 L/min (±5%) for 5 s. The drug deposited on the inner surface of the throat and neck was rinsed with the mobile phase into the upper impingement chamber. The drug deposited in the inlet tube was rinsed into the lower impingement chamber. The amounts of the active drug collected in the upper and lower impingement chambers were adjusted to a volume of 50 mL in a volumetric flask with the mobile phase used in the column and analyzed by HPLC. The FPF was calculated as the percentage of active drug that reached the lower impingement chamber based on the emitted dose.
Assessment of Aerodynamic Particle Size Distribution
The measurement of the assessment of aerodynamic particle size distribution (APSD) was performed on an eight-stage Andersen cascade impactor (ACI; Graseby Andersen, Atlanta, GA, USA) designated in the BP2011 as apparatus D (23). The pressurized inhaler was shaken for 5 s and the first delivery was discharged to waste. The pMDI was connected to the metal inlet of the ACI using an adaptor. Air was drawn through the apparatus at a flow rate of 28.3 L/min (±5%) for 5 s for each delivery. Then, the inverted inhaler was discharged into the apparatus for two consecutive doses. A shaking time of 5 s was required between each delivery. The metal inlet and stages were washed with the mobile phase. Each fraction was adjusted to a volume of 25 mL in a volumetric flask with the mobile phase and analyzed for the amount of drug by HPLC. The mass median aerodynamic diameter (MMAD) and geometric standard deviation (GSD) were calculated according to an established method (24).
Statistical Analysis of Data
Data are expressed as a mean ± SD. Statistical comparisons were carried out using one-way analysis of variance (ANOVA) followed by a Student’s t test. The differences were considered to be statistically significant when p values <0.05.
RESULTS
Physical Stability Assessment
All formulations were tested for their physical stability, their content of active ingredients delivered by actuation of the valve, and their aerosol characteristics. The ε values of the water, ethanol, 50% ethanol in water, ipratropium bromide, and fenoterol hydrobromide were 75.3, 27.1, 52.2, 45.7, and 60.1, respectively. The 27 ipratropium bromide and fenoterol hydrobromide MDI formulations contained different amounts of co-solvent and propellant (Table I). In a solution-based formulation, if the ε value of the drug was close to that for the solvent system, so the drug would be completely dissolved. The results for the ε values of the different solvent systems of the 27 formulations are also shown in Table I. The formulations containing ethanol lower than 24% v/v, and an HFA propellant higher than 74% v/v precipitated. The nine formulations (#1, #2, #3, #10, #11, #12, #19, #20, and #21) that precipitated were excluded from further studies. The pH values of all formulations were in the range 3.4 ± 0.2 and both ipratropium bromide and fenoterol hydrobromide formulations were stable at this pH (data not shown).
Content of the Active Ingredients Delivered by Actuation of the Valve
Only the 18 formulations that showed no precipitate were tested for their content of the active ingredients delivered by actuation of the valve initially and after 3 and 6 months storage. The amounts of the active ingredients delivered by actuation of the valve in respect of formulations #22–27 were within the acceptable range (80–120%) as described in the pharmacopoeia (23). The acceptable results for the contents of fenoterol hydrobromide and ipratropium bromide are presented in Fig. 2. For the other 12 formulations (#4, #5, #6, #7, #8, #9, #13, #14, #15, #16, #17, and #18) the amounts of both drugs fluctuated from between 65% and 100% (Table II), but most of these formulations had much lower values of dose content that were not within either of the acceptable ranges. The six acceptable formulations had vapor pressures in the range of 296–340 kPa (Table I). However, the content of the active ingredients tended to decrease during the last ten doses that were obtained (1.3–12.6% for fenoterol hydrobromide and 2.4–28.9% for ipratrpium bromide).
Fig. 2.
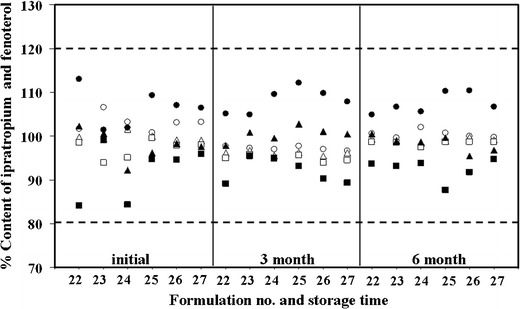
Contents of the active ingredients delivered by actuation of the valve at initial and after storage at 25°C after 3 and 6 months of selected formulations. Doses were collected at the beginning, mid, and end of the ipratropium bromide (white circle, white triangle, white square) and fenoterol hydrobromide (black circle, black triangle, black square). The dashed lines are the upper limit (120%) and the lower limit (80%) of the drug content stated in the British Pharmacopoeia
Table II.
Contents by Actuation of the Valve of the 12 Design Formulations at Initial (mean ± SD, n = 10)
| Formulation | % Content of active ingredient | |||||
|---|---|---|---|---|---|---|
| Fenoterol hydrobromide | Ipratropium bromide | |||||
| Beginning | Middle | End | Beginning | Middle | End | |
| #4 | 76.5 ± 0.7 | 70.3 ± 1.0 | 70.2 ± 0.8 | 99.1 ± 1.1 | 96.3 ± 0.7 | 76.5 ± 1.3 |
| #5 | 73.0 ± 0.6 | 70.1 ± 1.0 | 69.3 ± 1.0 | 77.4 ± 1.1 | 76.6 ± 0.8 | 76.5 ± 0.8 |
| #6 | 80.6 ± 0.6 | 71.9 ± 0.8 | 70.6 ± 0.4 | 96.0 ± 1.1 | 93.3 ± 1.2 | 89.1 ± 1.1 |
| #7 | 72.8 ± 0.7 | 71.6 ± 1.5 | 70.9 ± 1.4 | 92.6 ± 1.1 | 89.5 ± 1.4 | 84.2 ± 1.1 |
| #8 | 72.6 ± 0.5 | 70.6 ± 1.0 | 70.4 ± 0.8 | 93.1 ± 0.9 | 92.4 ± 1.3 | 91.0 ± 1.3 |
| #9 | 79.0 ± 0.6 | 74.3 ± 0.8 | 70.1 ± 1.4 | 77.9 ± 0.7 | 74.5 ± 0.8 | 69.3 ± 0.8 |
| #13 | 71.8 ± 0.4 | 71.3 ± 0.7 | 70.8 ± 1.1 | 100.0 ± 1.1 | 99.8 ± 0.8 | 75.1 ± 0.7 |
| #14 | 80.9 ± 0.5 | 71.9 ± 1.6 | 71.6 ± 1.2 | 81.3 ± 1.3 | 70.7 ± 1.1 | 64.4 ± 1.1 |
| #15 | 78.9 ± 0.6 | 71.8 ± 0.8 | 70.9 ± 1.6 | 73.9 ± 1.3 | 65.4 ± 0.8 | 44.5 ± 0.9 |
| #16 | 100.5 ± 0.3 | 100.3 ± 0.8 | 99.1 ± 1.2 | 116.1 ± 3.7 | 96.3 ± 0.4 | 86.8 ± 1.0 |
| #17 | 101.2 ± 0.7 | 99.8 ± 1.1 | 98.6 ± 1.3 | 105.8 ± 1.1 | 101.0 ± 0.9 | 93.0 ± 1.1 |
| #18 | 83.0 ± 0.6 | 72.8 ± 1.1 | 71.3 ± 0.8 | 85.3 ± 1.3 | 74.8 ± 1.1 | 72.6 ± 0.9 |
Uniformity of the Delivery Dose
Eighteen formulations were tested for uniformity of the delivered dose initially and after 3 and 6 months of storage. The uniformity of the content of fenoterol hydrobromide and ipratropium bromide for the six selected formulations was within ± 12.5% (%CV = 10.6%; Fig. 3) and the other 12 formulations are shown in Table III. Thus, a uniform delivered dose was obtained from formulations (#22, #23, #24, #25, #26, and #27) containing between 64% and 71% HFA propellant. The other 12 formulations (#4, #5, #6, #7, #8, #9, #13, #14, #15, #16, #17, and #18) failed the acceptance criteria as the contents were lower than 80%.
Fig. 3.
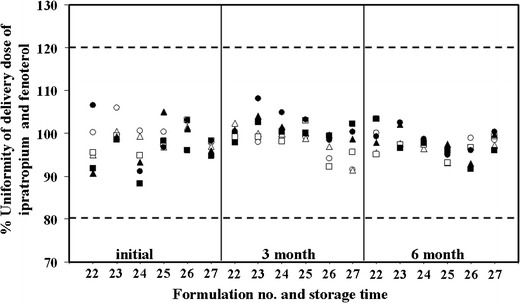
Uniformity of the delivery dose at initial and after storage at 25°C after 3 and 6 months of selected formulations. Doses were collected at the beginning, mid, and end of the total dose of ipratropium bromide (white circle, white triangle, white square) and fenoterol hydrobromide (black circle, black triangle, black square). The dashed lines are the upper limits (120%) and lower limits (80%) of the drug content stated in British Pharmacopoeia
Table III.
The Uniformity of the Delivery Dose of the 12 Design Formulations at Initial (mean ± SD, n = 3)
| Formulation | % Uniformity of delivery dose | |||||
|---|---|---|---|---|---|---|
| Fenoterol hydrobromide | Ipratopium bromide | |||||
| Beginning | Middle | End | Beginning | Middle | End | |
| #4 | 42.9 ± 0.5 | 43.2 ± 1.6 | 44.6 ± 0.4 | 85.4 ± 3.6 | 79.0 ± 3.5 | 74.1 ± 1.8 |
| #5 | 51.3 ± 0.9 | 51.9 ± 0.8 | 50.1 ± 2.9 | 77.0 ± 2.1 | 75.0 ± 2.2 | 70.8 ± 3.1 |
| #6 | 47.3 ± 0.7 | 45.2 ± 0.8 | 44.1 ± 1.3 | 89.7 ± 1.9 | 85.8 ± 2.9 | 78.8 ± 4.9 |
| #7 | 45.4 ± 1.7 | 44.2 ± 0.7 | 43.6 ± 0.9 | 78.8 ± 1.8 | 80.6 ± 3.5 | 85.0 ± 6.6 |
| #8 | 45.7 ± 1.0 | 43.9 ± 0.7 | 42.8 ± 0.9 | 90.5 ± 1.3 | 90.0 ± 4.1 | 85.5 ± 2.2 |
| #9 | 44.9 ± 0.8 | 45.7 ± 0.7 | 44.4 ± 0.4 | 75.2 ± 1.9 | 74.5 ± 2.0 | 72.5 ± 2.0 |
| #13 | 44.2 ± 0.5 | 44.3 ± 0.4 | 44.5 ± 0.2 | 83.0 ± 1.9 | 82.9 ± 4.0 | 82.2 ± 0.7 |
| #14 | 46.0 ± 0.4 | 46.0 ± 0.8 | 45.7 ± 0.5 | 78.9 ± 0.4 | 79.6 ± 3.0 | 66.0 ± 2.7 |
| #15 | 45.0 ± 0.3 | 45.2 ± 0.3 | 45.4 ± 0.2 | 69.4 ± 1.2 | 71.4 ± 1.7 | 64.5 ± 9.2 |
| #16 | 101.4 ± 0.3 | 94.7 ± 0.5 | 95.1 ± 0.3 | 112.4 ± 1.2 | 99.1 ± 3.8 | 101.9 ± 0.8 |
| #17 | 100.6 ± 1.2 | 100.2 ± 0.7 | 99.1 ± 0.7 | 101.8 ± 2.3 | 98.9 ± 4.4 | 102.1 ± 3.6 |
| #18 | 77.4 ± 0.3 | 76.9 ± 0.7 | 77.2 ± 1.4 | 77.0 ± 5.6 | 76.4 ± 2.9 | 72.3 ± 1.8 |
Fine Particle Fraction
The results of the FPF are shown in Table IV. The FPFs of formulations #4, #5, #6, #7, #8, #9, #13, #14, #15, #16, #17, and #18 varied from 12% to 33% hence the FPF was monitored only for the initial sample. The six formulations having acceptable uniformity of delivered dose (#22, #23, #24, #25, #26, and #27) exhibited FPFs that ranged between 45% and 52%, and these met the criteria specified in the British Pharmacopoeia (>25% mass < 6.4 μm aerodynamic diameter). These six formulations were evaluated for their FPF not only initially but also after 3 and 6 months of storage. After storage for 3 and 6 months, the FPF value did not change significantly (p > 0.05).
Table IV.
Fine Particle Fraction (FPF) of Some Metered Dose Inhaler Formulations (Mean ± SD, n = 3)
| Formulations | % FPF Fenoterol hydrobromide | % FPF Ipratropium bromide | ||||
|---|---|---|---|---|---|---|
| Storage | At initial | 3 Months | 6 Months | At initial | 3 Months | 6 Months |
| #4 | 18.1 ± 0.7 | – | – | 32.5 ± 0.1 | – | – |
| #5 | 16.1 ± 1.6 | – | – | 24.2 ± 0.9 | – | – |
| #6 | 13.7 ± 1.2 | – | – | 32.2 ± 0.8 | – | – |
| #7 | 14.9 ± 0.4 | – | – | 30.5 ± 1.2 | – | – |
| #8 | 17.3 ± 0.3 | – | – | 24.0 ± 0.6 | – | – |
| #9 | 18.3 ± 0.2 | – | – | 26.3 ± 1.2 | – | – |
| #13 | 14.2 ± 1.0 | – | – | 28.2 ± 0.4 | – | – |
| #14 | 23.8 ± 1.0 | – | – | 32.1 ± 1.3 | – | – |
| #15 | 12.1 ± 0.1 | – | – | 29.2 ± 1.2 | – | – |
| #16 | 24.2 ± 1.2 | – | – | 24.5 ± 0.1 | – | – |
| #17 | 24.3 ± 0.3 | – | – | 24.2 ± 1.0 | – | – |
| #18 | 12.0 ± 0.4 | – | – | 24.0 ± 0.1 | – | – |
| #22 | 49.7 ± 1.5 | 50.5 ± 0.2 | 49.1 ± 0.5 | 54.5 ± 0.2 | 50.9 ± 0.1 | 45.4 ± 2.2 |
| #23 | 49.6 ± 0.7 | 51.1 ± 0.1 | 49.6 ± 0.2 | 53.7 ± 1.4 | 50.2 ± 0.4 | 46.7 ± 2.3 |
| #24 | 51.1 ± 2.9 | 48.8 ± 0.2 | 49.5 ± 0.4 | 52.0 ± 0.6 | 49.0 ± 1.0 | 45.9 ± 1.5 |
| #25 | 50.3 ± 0.9 | 48.8 ± 0.1 | 49.3 ± 0.4 | 59.6 ± 0.2 | 48.7 ± 0.3 | 45.3 ± 1.5 |
| #26 | 51.3 ± 2.2 | 48.4 ± 0.1 | 49.3 ± 0.4 | 50.8 ± 1.4 | 48.4 ± 1.0 | 44.9 ± 1.4 |
| #27 | 49.1 ± 1.2 | 48.9 ± 0.1 | 49.2 ± 0.3 | 48.4 ± 2.2 | 48.4 ± 1.1 | 44.7 ± 1.3 |
− Not determined
APSD
The APSDs of the selected formulations having acceptable delivered dose uniformity were assessed using the ACI after 3 and 6 months of storage. In addition, the drug that passed through the metal inlet or induction port (Copley Scientific Ltd., Nottingham, UK) did reach the lower stage of the ACI. Ipratropium bromide and fenoterol hydrobromide reached stages 5–7 to indicate that both drugs were available at the size required to reach the airways of the lungs. It is important to note that the amount of fenoterol hydrobromide (28–35%) that traveled to the lower stages (stages 6–7) was much greater than for the ipratropium bromide (20–23%) that deposited mainly on stages 4–5. This would provide for a better peripheral delivery of the beta-2 adrenergic agonist. The MMAD results are shown in Table V. The MMAD values were around 2 μm for the six acceptable formulations after 3 and 6 months of storage and the particle size distribution stayed in a similar size range (2.1–2.3 μm for 3 months and 2.1–2.3 μm for 6 months, p > 0.05). The results of an ANOVA revealed that there were no significant differences in their MMADs. In addition, all GSD values were > 1.2, and confirmed that the formulations delivered polydisperse aerosols.
Table V.
The Mass Median Aerodynamic Diameter (MMAD) and Geometric Standard Deviation (GSD) of the Metered Dose Inhaler Formulations #22–27 at Initial and After 3 and 6 Months Storage (mean ± SD, n = 3)
| Formulations | At initial | 3 months storage | 6 months storage | |||||||||
|---|---|---|---|---|---|---|---|---|---|---|---|---|
| MMAD (μm) | GSD | MMAD (μm) | GSD | MMAD (μm) | GSD | |||||||
| Fenoterol | Ipratropium | Fenoterol | Ipratropium | Fenoterol | Ipratropium | Fenoterol | Ipratropium | Fenoterol | Ipratropium | Fenoterol | Ipratropium | |
| #22 | 2.20 ± 0.02 | 2.22 ± 0.05 | 3.08 | 2.94 | 2.26 ± 0.13 | 2.19 ± 0.01 | 3.08 | 2.94 | 2.12 ± 0.07 | 2.26 ± 0.07 | 2.92 | 3.15 |
| #23 | 2.33 ± 0.12 | 2.28 ± 0.09 | 3.38 | 3.07 | 2.19 ± 0.00 | 2.19 ± 0.00 | 3.38 | 3.07 | 2.09 ± 0.10 | 2.18 ± 0.05 | 3.05 | 2.84 |
| #24 | 2.20 ± 0.02 | 2.20 ± 0.03 | 3.08 | 2.95 | 2.19 ± 0.00 | 2.24 ± 0.09 | 3.08 | 2.95 | 2.12 ± 0.06 | 2.06 ± 0.11 | 2.85 | 2.90 |
| #25 | 2.25 ± 0.06 | 2.55 ± 0.31 | 3.19 | 3.11 | 2.19 ± 0.00 | 2.13 ± 0.09 | 3.19 | 3.11 | 2.16 ± 0.03 | 2.16 ± 0.10 | 2.91 | 3.15 |
| #26 | 2.16 ± 0.04 | 2.20 ± 0.01 | 3.06 | 3.02 | 2.19 ± 0.00 | 2.18 ± 0.04 | 3.06 | 3.02 | 2.18 ± 0.05 | 2.18 ± 0.06 | 2.92 | 2.82 |
| #27 | 2.13 ± 0.05 | 2.13 ± 0.05 | 2.96 | 2.96 | 2.18 ± 0.02 | 2.17 ± 0.04 | 2.96 | 2.96 | 2.16 ± 0.02 | 2.09 ± 0.08 | 2.90 | 2.89 |
DISCUSSION
Ipratropium bromide and fenoterol hydrobromide easily dissolved in water (freely soluble) and both were sparingly soluble in ethanol and they also dissolved in a 50% ethanol/water solution (13,23). As these two drugs are in hydrobromide salt forms, they will dissolve in pure ethanol only partially or with a limited solubility. When either of the polar or the semipolar solvents was added to the MDI formulation, the solubility of the drugs in ethanol improved significantly. This was due to a certain degree of polarity being induced in the nonpolar solvent (propellant). Ethanol acted as an intermediate solvent (co-solvent) that can induce miscibility of the polar compounds in the nonpolar solvents. In this case, when HFA 134a propellant was rendered polarizable by the ethanol/water solution, it became soluble and either drug dissolved easily. Hence, those formulations that contained suitable amounts of the solvent system produced a clear solution. If the active ingredients precipitated because of their low solubility in the mixed solvents (water, ethanol, and HFA propellant) then these formulations were deemed to be unacceptable. When fenoterol hydrobromide and ipratropium bromide were dissolved in the mixed solvent this resulted in a reduced ε of the system because of the pairing of the ionic species (25). Based on the “like dissolves like” principle, the concentration of the co-solvent and the ε values were the crucial factors required to dissolve the active drugs, and the ε value of the solvent systems must be close to those values of the drugs (26). The dielectric constants were used to choose an appropriate solvent system. A solvent system with a ε value close to that of the drug can provide a stable solution for use with the MDI.
From this observation, nine formulations (#1, #2, #3, #10, #11, #12, #19, #20, and #21) that contained the HFA propellant at a concentration higher than 74% v/v and a percentage of ethanol lower than 24% v/v precipitated. However, 18 formulations in which the concentration of the co-solvent system dissolved the propellant system produced a clear solution in the solution-based pMDI. The physical stability of the formulation was directly related to the HFA propellant content or in other words its ε value and the drug solubility. The solubility of the drug in the HFA propellants was strongly affected by the ability to form dipole–dipole interactions between the solute and solvent. Thus, the addition of water was in this case able to induce polarization. Because the ipratropium bromide and fenoterol hydrobromide are weakly basic drugs they have poor solubility in the HFA propellant. The presence of ethanol and water were therefore found to be essential to induce polarization to achieve solubilization for the fenoterol hydrobromide and the ipratropium bromide in the relatively nonpolar HFA propellant.
HFA propellants are nonpolar solvents and at the same time do not have a high solubilization capacity in comparison with polar compounds. For the ionizable compounds, such as ipratropium bromide and fenoterol hydrobromide, they are soluble in water and alcohol (11). Hence, co-solvents with a high polarity were required to dissolve ipratropium bromide and fenoterol hydrobromide, by producing an increase of the solubility of the drugs in the formulation. The solubility was highly pH-dependent whereby the ionized species always possessed a higher solubility than the unionized species (26). In other words, appropriate pH adjustments to the solution modified the solubility of the fenoterol or ipratropium. Precipitation of an acidic or basic drug may occur if an inappropriate solvent is used. This can be correlated to the pH with the solubility occurring according to the Henderson–Hasselbalch equation (2), for a weak base and its salt. The precipitation pH (pH ppt) was that above which the weak base would precipitate from the solution:
 |
2 |
Where S is the total concentration (molar) and So is the concentration (molar) of the free base.
Equation (2) indicated that the solubility of a weak base increases with decreasing pH. Based on the Henderson–Hasselbalch equation, the precipitation pH of ipratropium bromide was about 8.4 and for fenoterol hydrobromide was about 6.3, both values of which were much higher than the formulation pH value of 3.4 for the two basic drugs. Therefore, formulations of both drugs (ipratropium bromide and fenoterol hydrobromide) did not precipitate as a result of the pH of the formulations. The formulations precipitated when the pH was lower than 3.4 but some formulations showed no precipitation even at a pH less than this value (i.e. formulations #4, #5, #6, #7, #13, #14, #18, #24, #25, #26, and #27, as indicated in Table I). The Henderson–Hasselbalch equation by itself may not be sufficient to predict the precipitation of the formulations. The ε values may also be involved in this situation.
It should be noted that any putative adverse effects of minor quantities of HCl inhaled along with the formulation would have to be investigated when used in clinical studies. The vapor pressure of the propellant system may affect the content of the active ingredients delivered by actuation of the valve. Therefore, the vapor pressure for a mixture of liquids A and B was calculated according to Raoult’s law.
 |
3 |
 |
4 |
In this equation, PA and PB were the partial vapor pressures of the constituents over the solution when the mole fraction concentrations were XA and XB, respectively. The results of the calculated vapor pressure for all formulations are shown in Table I. It was observed that formulations with different amounts of propellant and concentrations of co-solvent produced significant differences in the amount of the drug deposited into the lower impingement chamber, representing the fine particle fraction of <6.4 μm aerodynamic diameter. The FPF of all satisfied formulations ranged between 45% and 52%. All selected formulations had a vapor pressure about 296–339 with a high water and ethanol content (2.0–2.3% of water and 26.6–34.0% of ethanol content) which generated a high FPF. Although some formulations showed vapor pressure within these ranges, the FPF were found to be low. Hence, it was not only a vapor pressure factor but other factors may be involved in this observation. After 6 months of storage values of FPF for all formulations, there were no significant differences observed from the values obtained initially and after 3 months of storage (p > 0.05). The concentrations of the co-solvents were sufficient to generate an aerosol cloud and the vapor pressure range (290–340 kPa) was expected to be suitable to provide a satisfactory FPF. Although a higher vapor pressure may provide a finer aerosol, its emission from the inhaler at higher velocities will likely be accompanied by an increase in oropharyngeal deposition due largely to the inertial effects.
CONCLUSION
The dielectric constant of the mixed solvent of the pMDI predicted the solubility of the products. The content of ethanol, water, and the HFA 134a propellant were optimized for the physical stability of ipratropium bromide and fenoterol hydrobromide in these solution-based formulations. In order to obtain physical stability, the HFA 134a propellant concentration was greater than 72% by volume of the two component solution with the ethanol concentration therefore less than 27% v/v. When the vapor pressure and dielectric constants of the propellant and co-solvents mixtures were chosen to be appropriate for the drugs being aerosolized, the formulation of the pMDI provided satisfactory aerosol properties and physical stability. We found that formulation #23 had the lowest content variability and the best delivered dose uniformity.
ACKNOWLEDGMENTS
We gratefully acknowledge the support from the Higher Education Research Promotion and National Research University Project of Thailand, Office of the Higher Education Commission and Inpact pharma Co., Ltd. Thailand. Thanks to Dr Brian Hodgson for assistance with the English.
REFERENCES
- 1.Shrikhande SS, Rao A, Ambekar A, Bajaj AN. Metered dose inhalation formulations for salbutamol sulphate using non-CFC propellant tetrafluoroethane. Int J Pharmaceut Drug Res. 2011;3(4):292–296. [Google Scholar]
- 2.Ibiapina CC, Cruz ÁA, Camargos PAM. Hydrofluoroalkane as a propellant for pressurized metered-dose inhalers: history, pulmonary deposition, pharmacokinetics, efficacy and safety. J Pediatr. 2004;80:441–446. [PubMed] [Google Scholar]
- 3.Bell J, Newman SP. The rejuvenated pressurized metered dose inhaler. Expert Opin Drug Del. 2007;4:215–234. doi: 10.1517/17425247.4.3.215. [DOI] [PubMed] [Google Scholar]
- 4.Lewis DA, Ganderton D, Meakin BJ, Brambilla G. Modulite: a simple solution to a difficult problem. Respiration. 2005;72:S3–S5. doi: 10.1159/000083686. [DOI] [PubMed] [Google Scholar]
- 5.Lewis D. Metered-dose inhalers: actuators old and new. Expert Opin Drug Del. 2007;4:235–245. doi: 10.1517/17425247.4.3.235. [DOI] [PubMed] [Google Scholar]
- 6.Lewis D, Ganderton D, Meakin B, Delcanale M, Pivetti F. 2008. US Patent no.7,381,402.
- 7.Smyth HD. The influence of formulation variables on the performance of alternative propellant driven metered dose inhalers. Adv Drug Deliv Rev. 2003;55:807–828. doi: 10.1016/S0169-409X(03)00079-6. [DOI] [PubMed] [Google Scholar]
- 8.Mohanachandran SP, Sindhumo PG, Kiran TS. Enhancement of solubility and dissolution rate: an overview. Pharmacie Globale (IJCP) 2010;4:1–10. [Google Scholar]
- 9.Gupta A, Stein SW, Myrdal PB. Balancing ethanol cosolvent concentration with product performance in 134a-based pressurized metered dose inhaler. J Aerosol Med. 2003;16:167–174. doi: 10.1089/089426803321919924. [DOI] [PubMed] [Google Scholar]
- 10.Gross NJ. Anticholinergic agents in asthma and COPD. Eur J Pharmacol. 2006;533:36–39. doi: 10.1016/j.ejphar.2005.12.072. [DOI] [PubMed] [Google Scholar]
- 11.The United State Pharmacopeial Convention, United State Pharmacopeia 34—National Formula 29. Rockville, MD, USA; 2011.
- 12.Barnes PJ. Drugs for airway disease. Medicine. 2008;36:181–190. doi: 10.1016/j.mpmed.2008.01.007. [DOI] [Google Scholar]
- 13.Budavari S (editor). The Merck Index, 12th edition, Merck&Co., Inc., Whitehouse station, NJ, USA; 1996.
- 14.Newman SP. Principle of metered-dose inhaler design. Resp Care. 2005;50:1177–1190. [PubMed] [Google Scholar]
- 15.Dolovich MB, Dhand R. Aerosol drug delivery: developments in device design and clinical use. Lancet. 2011;377:1032–1045. doi: 10.1016/S0140-6736(10)60926-9. [DOI] [PubMed] [Google Scholar]
- 16.Sinko PJ. Martin’s physical pharmacy. 6. USA: Lippincott; 2011. [Google Scholar]
- 17.Jager PD, Kontny MJ, Nagel JH. Stabilized medicinal aerosol solution formulations containing ipratropium bromide. US Patent 5955058, 21 September 1999
- 18.Vega JC. Stable non-corrosive formulations for pressurized metered dose inhalers. US Patent 2012/0204871 A1, 16 August 2012.
- 19.Gorman WG, Hall GD. Dielectric constant correlations with solubility and solubility parameters. J Pharm Sci. 1964;53:1017–1020. doi: 10.1002/jps.2600530905. [DOI] [PubMed] [Google Scholar]
- 20.Rahman SN, Khatun N, Hossain MT. Dielectric studies of cerium doped barium titanate at different frequencies. J Bangladesh Acad Sci. 2008;32(2):79–85. [Google Scholar]
- 21.Chang KC, Yeh YC, Lue JT. Measurement of the dielectric constant of zinc metallic nanoparticles at various frequencies. Measurement. 2012;45:808–813. doi: 10.1016/j.measurement.2011.06.021. [DOI] [Google Scholar]
- 22.Hyun J, Lee S, Cho S, Paik K. Frequency and temperature dependence of dielectric constant of epoxy/BaTiO3 composite embedded capacitor film (FCFs) for organic substrate. Electronic Components and Technology Conference. 2005;1241–47.
- 23.British Pharmacopeial Commission, BP2011, London, UK; 2011.
- 24.Srichana T, Suedee R, Det M, Tanmanee N. The study of in vitro–in vivo correlation: pharmacokinetics and pharmacodynamics of albuterol dry powder inhalers. J Pharm Sci. 2005;94:220–230. doi: 10.1002/jps.20218. [DOI] [PubMed] [Google Scholar]
- 25.Wang P, Anderko A. Computational of dielectric constants of solvent mixtures and electrolyte solutions. Fluid Phase Equilibr. 2001;186:103–122. doi: 10.1016/S0378-3812(01)00507-6. [DOI] [Google Scholar]
- 26.Allen LV, Popovich N, Ansel HC. Ansel’s pharmaceutical dosage forms and drug delivery systems. 9. China: Lippincott; 2011. [Google Scholar]