Abstract
Curcumin (CUR) has various pharmacological effects, but its extensive first-pass metabolism and short elimination half-life limit its bioavailability. Therefore, transdermal application has become a potential alternative to delivery CUR. To increase CUR solubility for the development of a transparent homogenous gel and also enhance the permeation rate of CUR into the skin, β-cyclodextrin–curcumin nanoparticle complex (BCD–CUR-N) was developed. CUR encapsulation efficiency was increased by raising the percentage of CUR to BCD up to 20%. The mean particle size of the best CUR loading formula was 156 nm. All evaluation data using infrared spectroscopy, Raman spectroscopy, powder X-ray diffractometry, differential thermal analysis and scanning electron microscopy confirmed the successful formation of the inclusion complex. BCD–CUR-N increased the CUR dissolution rate of 10-fold (p < 0.01). In addition, the improvement of CUR permeability acrossed skin model tissue was observed in gel containing the BCD–CUR-N and was about 1.8-fold when compared with the free CUR gel (p < 0.01). Overall, CUR in the form of the BCD–CUR-N improved the solubility further on the penetration of CUR.
KEY WORDS: β-cyclodextrin, curcumin, diffusion kinetic, hydrophilic gel, nanoparticle, skin permeation
INTRODUCTION
Curcumin (CUR), a natural compound with a hydrophobic structure obtained from the herb Curcuma longa, exerts diverse pharmacological effects such as anti-inflammation, antioxidant, anticancer and antimicrobial [1, 2]. Despite these properties, phase I clinical trials have shown that CUR has poor systemic bioavailability when administered orally [3]. The dissolution rate limits absorption and its rapid first-pass metabolism hampers its use as a potential therapeutic agent. CUR is practically insoluble in water (≈20 μg/mL), resulting in a low dissolution rate after oral administration [4]. Once absorbed, CUR is subjected to extensive first-pass metabolism (>90%), conjugating with glucuronide and sulphate in both humans and animals, mainly in the liver [3, 5, 6]. Therefore, transdermal application has become a potential interest for delivering CUR as hepatic first-pass metabolism avoidance, being applied in the form of gel. Gel delivery systems have several advantages such as transparency, the ease of administration and patient compliance, as well as the fact that it is not greasy. Water in the gel hydrates the stratum corneum, resulting in changes in the permeability of the stratum corneum, which becomes more permeable to the active substance [7, 8]. Unfortunately, when a water-insoluble drug like CUR is added to the gel, it can only be dispersed and a transparent gel cannot be obtained. Furthermore, better solubility of CUR is required for it to be applied effectively. An approach reported here was complexing the CUR into the hydrophobic cavity of β-cyclodextrin (BCD). BCD, acyclic oligosaccharide, consists of a hydrophilic outside and an apolar cavity that provides a hydrophobic matrix. As a result, BCD can form inclusion complexes with a wide variety of hydrophobic guest molecules [9]. The inner cavity of BCD is fortunately more appropriate for CUR loading over other forms of cyclodextrin: α- and γ-cyclodextrins [10].
There are several studies reporting BCD–CUR inclusion complex [10–12]. However, none of them focused on their preparation at the nanoparticle scale and gel form. Our form of BCD–CUR inclusion complex for gel formulation therefore is the first report.
The aim of nanonization of the BCD–CUR inclusion complex for gel preparation was due to the fact that because of their hydrophilicity, only insignificant amounts of BCD and drug/BCD complexes can penetrate into lipophilic biological barriers, such as the stratum corneum [13]. Previous studies suggested that polar and small solutes can penetrate through the polar intercellular lipid pathway [14]. So, by decreasing the particle size of the inclusion complex down to nanometre scale, amount of the CUR penetrating through the stratum corneum is suggested to be improved. Several physical characteristics as well as in vitro dissolution and diffusion studies were performed to confirm successful complex formation.
MATERIALS AND METHODS
Materials
Curcumin was purchased from PT. Phytochemindo Lestari (Indonesia). β-Cyclodextrin was obtained from PT Sanbe Farma (Indonesia). Analytical grade acetone, dimethyl sulphoxide (DMSO), triethanolamine and potassium dihydrogen phosphate were supplied by Merck (Germany). Glycerin, propylene glycol, methyl paraben and propyl paraben were from Brataco (Indonesia). Viscolam AT 100P was purchased from Nardev Chemie (Singapore). Methanol and analytical grade acetonitrile were obtained from J.T Baker (USA). Double distilled water was from Ippha Laboratories (Indonesia). Deionised water was obtained from the School of Life Sciences and Technology (Bandung Institute of Technology, Indonesia). Shed snake skins of Phyton reticulatus was purchased from Bandung Zoo (Indonesia).
Methods
Preparation of Nanoparticle Inclusion Complexes
β-Cyclodextrin (200 mg) was dissolved in 40 mL of deionised water, and varying amounts of curcumin 4%, 5%, 10%, 20% and 30% in 400 μL, 500 μL, 1 mL, 2 mL and 3 mL of acetone, respectively, were added. The solutions were mixed in a closed dark glass container and then sonicated for 5 min to reduce the particle size. The solution was stirred with a magnetic stirrer at 200 rpm for 5 h without a cap to allow the acetone to evaporate. After that time, the solution was centrifuged at 3,000 rpm for 15 min to precipitate the fraction of non-complexed drug. The supernatant containing BCD–CUR inclusion nanoparticle complexes (BCD–CUR-N) was filtered through a 0.45-μm filter to remove any CUR present. The inclusion complexes were recovered by freeze drying (freeze-dryer Christ 336 Osterode Harz Kar Kolb, West Germany; −35°C, 0.01 Torr) and then stored at 4°C until further use.
Determination of Particle Size, Polydispersity Index and Zeta Potential
The particle size and polydispersity index (PDI) of BCD–CUR-N were measured by photon correlation spectroscopy (Delsa™ Nano C Particle Analyzer, Beckman Coulter, USA). The zeta potential of CUR–BCD was determined using the electrophoretic light scattering method (Delsa™ Nano C Zeta Potential Analyzer, Beckman Coulter, USA). The filtered supernatant sample obtained from preparation procedure was transferred into cuvette and then was placed inside the sample holder of the particle size analyser. Once the required intensity was reached, analysis was performed to obtain the mean particle size and PDI of the sample. The zeta potential of BCD–CUR-N sample was determined in the same way, but different sample holder with particle size and PDI measurement, using the electrophoretic light scattering method (Delsa™ Nano C Zeta Potential Analyzer, Beckman Coulter, USA). PCS measurements were performed at 25°C, and each sample was analysed three times.
Determination of Curcumin Loading
BCD–CUR-N (1 mg) was dissolved in 5 mL of DMSO to extract CUR. CUR concentration was determined by the UV–vis spectrophotometer method (Beckman DU 7500i, USA) at 430 nm. A standard plot of CUR in DMSO (2–6 μg/mL) was prepared.
In Vitro Dissolution Studies
In vitro dissolution studies were performed for pure CUR, physical mixture (PM) and the selected BCD–CUR-N formulation showing the best CUR loading into its cavity (Vision G2 Elite 8™, Hanson Research, USA, USP Dissolution Test Type II Apparatus). All samples contained 200 mg of CUR. These parameters for the dissolution process were as follows: 900 mL of distilled sodium lauryl sulphate 1% (w/v), at temperature of 37 ± 0.10°C and agitation speed at 100 rpm. The samples (5 mL) were withdrawn at various time intervals (5, 10, 15, 20, 25, 30, 35, 40, 45, 50, 55 and 60 min) and then filtered through Whatman filter paper no. 1. The filtrate was made up to 3 mL with DMSO. The absorbance of the samples was read by a UV–vis spectrophotometer at 430 nm against blank.
Characterisation of the Inclusion Complex
The curcumin–β-cyclodextrin nanoparticle complex formation was confirmed by Fourier transform infrared (FTIR) spectroscopy, Raman spectroscopy, differential thermal analysis (DTA), X-ray diffraction and scanning electron microscopy (SEM).
Fourier Transform Infrared Spectroscopy
FTIR spectra of the KBr pellets of BCD, CUR and BCD–CUR-N were obtained using FTIR-Shimadzu 8501 (USA). Data were acquired between 4,000 and 400 cm−1.
Raman Spectroscopy
Raman spectra were recorded on the Bruker Senterra Raman spectrometer (Germany) using a diode pump solid state laser with the excitation wavelength of 785 nm. Laser power of the source was maintained at 25 mW for 10 s (CUR sample) and 120 s (BCD, PM and BCD–CUR-N sample). Data were acquired between 2,000 and 1,200 cm−1.
Differential Thermal Analysis
DTA studies of BCD, CUR, PM and BCD–CUR-N were performed using the differential thermal analyser Mettler Toledo (USA). The samples were placed in scaled aluminium pans. The samples were scanned at 10°C/min from 30°C to 300°C.
X-ray Diffraction
X-ray diffraction patterns of BCD, CUR, PM and BCD–CUR-N were determined using a Philips Analytical X-Ray model PW1710 BASED diffractometer (Germany). The X-ray source was Cu-Kα radiation. The range (2θ) of scans was from 5° to 45° at a speed of 0.02° every 0.8 s.
Scanning Electron Microscopy
The surface morphology of BCD, CUR, PM and BCD–CUR-N was studied using a JSM-6510LV Jeol (USA) scanning electron microscope at an accelerating voltage of 15 kV (BCD, CUR and PM samples) and 10 kV (BCD–CUR-N sample). Dry samples were spread onto carbon tabs (double-adhesive carbon-coated tape) adhered to aluminium stubs.
These sample stubs were then coated with a thin layer of gold. Samples were subsequently scanned by SEM and photographed under various magnifications with direct data capture of the images onto a computer.
Preparation of Curcumin Gels
The composition of gel formulations is shown in Table I. CUR–BCD-N powder was dissolved in purified water and then stirred at 500 rpm for 10 min. Viscolam AT 100P, a water emulsion of acrylic polymer, was mixed into the solution. The mixture of methyl paraben, propyl paraben, propylene glycol and glycerin (MPPgG) was transferred to the polymer drug solution and homogenised using a stirrer at 500 rpm for 5 min. After this, the mixture was neutralised with triethanolamine until the pH reached the 6.0–7.0 range followed by further homogenisation. Meanwhile, the CUR gel was made by mixing the CUR with MPPgG before Viscolam AT 100P was added.
Table I.
Composition of Gel Formulation Containing Both Curcumin and Curcumin–β-Cyclodextrin Nanoparticle
| Ingredients | CUR gel (%, b/b) | CUR–BCD-N gel (%, b/b) |
|---|---|---|
| Curcumin | 0.01 | 0.01 |
| Viscolam | 5 | 5 |
| Methyl paraben | 0.2 | 0.2 |
| Propyl paraben | 0.05 | 0.05 |
| Glycerin | 5 | 5 |
| Propylene glycol | 15 | 15 |
| Triethanolamine for pH 6.0–7.0 | q.s | q.s |
| Water q.s to make | 100 | 100 |
CUR curcumin, CUR–BCD-N curcumin–β-cyclodextrin nanoparticle, q.s quantity sufficient
In Vitro Permeation Studies
The in vitro permeation of CUR from the CUR or BCD–CUR-N gel was evaluated using avertical diffusion cell with a 0.95-cm2 diffusion surface area of the shed skins of Python reticulatus snakes. The skins were cut to size and hydrated by allowing them to soak overnight in phosphate buffer pH 7.4, in a covered Petri dish. The outer surface of the skin was placed in contact with the gel. Permeation was monitored over a period of 24 h. The receptor solution was 6.2 mL phosphate buffer, pH 7.4, maintained at 37°C and stirred at 100 rpm. A temperature of 37°C and pH 7.4 were chosen as this formulation was designed for transdermal use. One gram of the gel was used in each diffusion cell. Samples (1 mL) were withdrawn for analysis at 5, 15 and 60 min and at 1.5, 2, 3, 4, 4.5, 5.5, 6.5, 7.5, 8 and 24 h. The receptor solution was replaced after each withdrawal. The CUR levels in the receptor solution were determined by high-performance liquid chromatography (HPLC).
High-Performance Liquid Chromatography System
The HPLC system for curcumin was developed according to Jayaprakasha et al. with modification [15]. The Agilent HPLC system (USA) was used with a Phenomenex® Luna C18 reverse-phase column 250 × 4.6 mm (5 μm). The detection wavelength was set at 425 nm. The mobile phase was acetonitrile/phosphate buffer (0.045 M, pH 4.5) (60:40), applied at a flow rate of 1 mL/min. Samples were injected manually in a volume of 50 μL. The CUR contained in the gel form and in the receptor solution from the permeation studies was extracted with the mobile phase by vortexing the tubes for 1 min. All samples were filtered before injection using 0.2-μm cellulose acetate membrane filters. The retention time for CUR was 8 min. The method was linear at a CUR concentration range from 0.625–10 ppm.
Statistical Analysis
All results were processed with the Microsoft Excel 2010 software and expressed as mean ± standard error of the mean. Statistical analyses were performed using unpaired and paired, two-tailed Student’s t test. Values of p < 0.05 and p < 0.01 were considered significant.
RESULTS AND DISCUSSION
Inclusion Complexes
The main focus of the present study was to develop BCD–CUR-N in the gel form to avoid the first-pass metabolism after oral administration that results in low systemic bioavailability of CUR. In addition, formation of BCD–CUR-N was to increase the amount of CUR penetrating through the stratum corneum. A molecular inclusion complex was formed via the solvent evaporation technique from two materials that reduced the size of the particles by sonication. During the inclusion complex formation, high-energy water molecules released from the cavity of the BCD and CUR molecules enter the BCD cavity to give apolar–apolar associations.
The BCD–CUR-N complexes studied were designated as CUR4, CUR5, CUR10, CUR20 and CUR30 based on the percent amount of CUR added to the formula. As the ability of cyclodextrin to form an inclusion complex with a compound is a function of several key factors, we evaluated the influence of the amount of curcumin on the percentage of curcumin encapsulated in the cyclodextrin cavity. Our results showed that by only increasing the amount of CUR from 5% to 30%, while maintaining a constant concentration of BCD and other process parameter, the size of the nanoparticles increased. The loading capacity of CUR in the BCD cavities increased from the CUR5 to CUR20 inclusion complex (Table I). When the CUR amount increased above 20%, the increases of loading capacity were less. This might have been because the inner cavity of beta-cyclodextrin was no longer sufficient to load bigger amount of CUR, which explains the fact that BCD–CUR-N is capable of molecular packing at interfaces at 20% of CUR. For this reason, CUR4 and CUR30 were not used for further characterisation.
Table II shows the value of polydispersity index, a dimensionless number indicating the range of size distribution in formulation. As seen, the resulting value of under 0.2 suggested a narrow dispersion of our system. Therefore, this polydispersity index is considered a homogenous formulation or uniform particle size distribution. These BCD–CUR-Ns have a negative surface charge (Table III) reflecting by the zeta potential value, as also reported by other group [16]. Negative charge at the surface indicates that the molecular aligning of the amphiphilic BCDs are such that the unsubstituted –OH groups are pointing towards the aqueous surrounding rendering a potential surface hydrophilicity. The more the CUR incorporated, the lower the zeta potential value. This is explainable by blocking the –OH group by the presence of CUR molecules. Zeta potential is an indicator of the charge presence on the surface of the nanoparticle, thereby indicating the degree of stability. Better dispersion system stability is possible when the zeta potential value is near −30 or +30 mV [17]. As presented in Table III, CUR5 shows the highest zeta potential value suggesting the most stable formulation in the dispersion system. However, long-term trials are required to further confirm these results.
Table II.
Characteristics of BCD–CUR-N Inclusion Complexes
| Inclusion complexes | Particle size (nm)a | Polydispersity indexa | % CUR loadinga |
|---|---|---|---|
| CUR4 | 110.77 ± 14.66 | 0.160 ± 0.018 | 14.29 ± 0.13 |
| CUR5 | 121.90 ± 5.83 | 0.164 ± 0.048 | 21.95 ± 2.53 |
| CUR10 | 126.37 ± 2.66 | 0.192 ± 0.041 | 22.20 ± 1.73 |
| CUR20 | 156.8 ± 38.3 | 0.174 ± 0.026 | 24.91 ± 0.26 |
| CUR30 | 238.73 ± 3.09 | 0.232 ± 0.005 | 12.87 ± 3.57 |
CUR curcumin
aMeasurements were performed from three different samples
Table III.
Zeta Potential of Optimized Inclusion Complexes
| Inclusion complexes | Zeta potential (mV)a |
|---|---|
| CUR5 | −39.61 ± 0.12 |
| CUR10 | −18.67 ± 0.24 |
| CUR20 | −17.26 ± 0.21 |
CUR curcumin
aMeasurements were performed from three different samples
In Vitro Dissolution Studies
In vitro dissolution profiles of CUR, PM and CUR20 (BCD–CUR-N) are shown in Fig. 1a. As seen in the figure, BCD–CUR-N exhibited the fastest dissolution rates. At 45 min, 100 ± 0.02% (n = 3) of CUR from BCD–CUR-N was released, whereas the percentages of CUR released from PM and CUR were very low of only 8.64 ± 0.13% (n = 3) and 7.73 ± 0.39% (n = 3), respectively. At the end of 1 h, 13.56 ± 0.14% (n = 3) and 10.04 ± 0.41% (n = 3) of CUR were released from PM and CUR, respectively. BCD–CUR-N showed a significant improvement in the CUR dissolution rate, which increased approximately 10-fold (p < 0.01). Confirmation of almost unsoluble CUR in the PM and CUR samples is seen in Fig. 1b. The increased solubility of CUR in BCD–CUR-N could be attributed to the fact that in the inclusion complex, CUR is converted into the amorphous form as confirmed by X-ray data below.
Fig. 1.
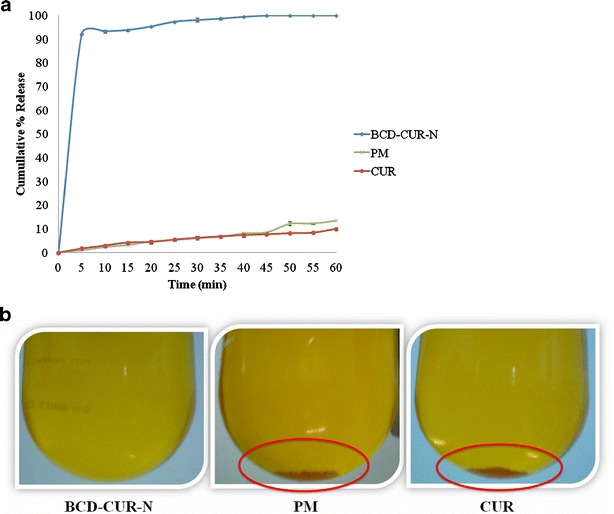
a Dissolution profiles of curcumin (CUR), physical mixture (PM) and β-cyclodextrin–curcumin inclusion complex nanoparticle (BCD–CUR-N). b Physical appearance of BCD–CUR-N, PM and CUR after dissolution protocol
Characterisation of Inclusion Complexes
FTIR Spectroscopy
FTIR spectroscopy was used to estimate the formation of BCD–CUR-N in the solid state. The FTIR spectrum of CUR (red line), BCD (black line) and the selected BCD–CUR-N formulations: CUR5 (light blue line), CUR10 (green line) and CUR20 (dark blue line)) are presented in Fig. 2. The FTIR spectrum of CUR exhibited a broad peak at 3,286 cm−1 and a sharp peak at 3,513 cm−1 indicating phenolic O–H stretching. Sharp absorption bands at 1,627 cm−1 corresponded to C=C and C=O conjugation. Another strong band at 1,597 cm−1 was attributed to the stretching of the benzene ring of CUR. The 1,508-cm−1 peak corresponded to the C=O vibration, while the enol C–O peak was represented at 1,276 cm−1. Sharp absorption bands at 1,029 and 860 cm−1 corresponded to C–O–C stretching in CUR. The FTIR spectrum of BCD showed a characteristic peak at 3,300–3,400 cm−1 due to the O–H group stretching. An intense peak at 2,854 cm−1 due to C–H assymetric/symmetric stretching was also seen. In addition, a peak at 1,650 cm−1 represented the H–O–H deformation bands of water present in BCD. Peaks at 1,153 and 1,029 cm−1 indicated C–H overtone stretching and that at 1,029 cm−1 C–H, C–O stretching. Absorption of the C–O–C vibration was seen at 1,153 cm−1.
Fig. 2.
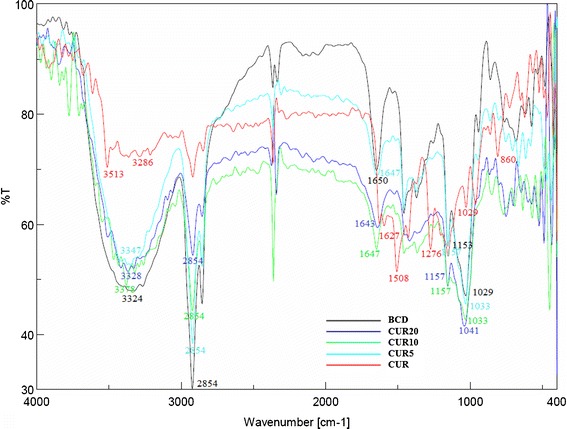
FTIR spectra of β-cyclodextrin (BCD), curcumin (CUR) and β-cyclodextrin–curcumin inclusion complexes nanoparticle (CUR20, CUR10 and CUR5)
As expected, all the FTIR spectra of the inclusion complexes were identical with the BCD spectrum. All the sharp peaks belonging to BCD were observed. The characteristic peaks of CUR disappeared (especially the absorption band at 1,597 cm−1 corresponding to the benzene ring of CUR and aromatic C–O stretching at 1,276 cm−1). Based on these results, we inferred that the benzene rings of CUR were contained within the BCD cavity by van der Waals forces and hydrophobic interactions. In addition, CUR could form hydrogen bonds within the BCD cavity because of its electron donor groups. Since CUR was included in BCD, all the related BCD peaks were shifted to higher or lower wave numbers, i.e., 3,343–3,328, 1,650–1,643, 1,538–1,511, 1,458–1,454, 1,153–1,157 and 1,029–1,041 cm−1. This confirmed the presence of CUR in the inclusion complex. All these data indicated the successful formation of BCD–CUR-N inclusion complexes.
Raman Spectroscopy
Raman spectroscopy has been suggested to be an excellent tool to estimate inclusion complex formation [18]. The presence of the guest molecules within the host cavity is mostly detected by Raman scattering in the region 1,600–1,700 cm−1 [19, 20]. The Raman spectra of CUR, BCD, PM and CUR20 (BCD–CUR-N) are shown in Fig. 3a. CUR has been identified as a bis-α, β-unsaturated β-diketone that exhibits keto-enol tautomerism [21]. In our study, CUR primarily existed in the enol form than in the ketone form, indicated by the absence of peaks at 1,650–1,800 cm−1 attributed to C=O vibration. The peak at 1,627 cm−1 shifted from the normal values (1,650–1,800 cm−1) because of the conjugation between C=C and C=O. Another strong peak at 1,602 cm−1 indicated aromatic C=C ring vibration in CUR. Since the Raman intensities of the BCD were very low, the spectrum of PM was very similar to that of CUR. In the case of BCD–CUR-N, the peak at 1,602 cm−1 shifted towards 1,600 cm−1 and the intensity reduced. This supports the previous FTIR spectroscopy result demonstrating that the aromatic ring of CUR was contained in the cavity of BCD. The reduction in intensity may have been due to the aromatic vibration of CUR being restricted by the BCD cavity. The BCD–CUR-N spectra displayed a frequency shift from 1,627 to 1,634 cm−1. This shift could have been influenced by hydrogen bonding between the hydroxyl group of BCD and the enolic OH at one of end of CUR (Fig. 3b). These shifted peaks were consistent with that postulated by Sanphui et al. [22]. They suggested that the aromatic group at the other end of CUR was not entrapped in the CD cavity and interacted with neighbouring CUR molecules via their phenolic OH groups, forming O–H · · · O linkages. This produced a linear pattern and existed in a water-soluble orthorombic polymorphic form. In our study, this was confirmed by the presence of the CUR peak at 1,252 cm−1 corresponding to the C–O aromatic vibration in the BCD–CUR-N spectra. The Raman spectra of CUR and PM exhibited no peak shifts like those observed in the BCD–CUR-N spectra, proving that the complex was not formed in the PM sample and that BCD–CUR-N was the result of a molecular interaction between CUR and BCD.
Fig. 3.
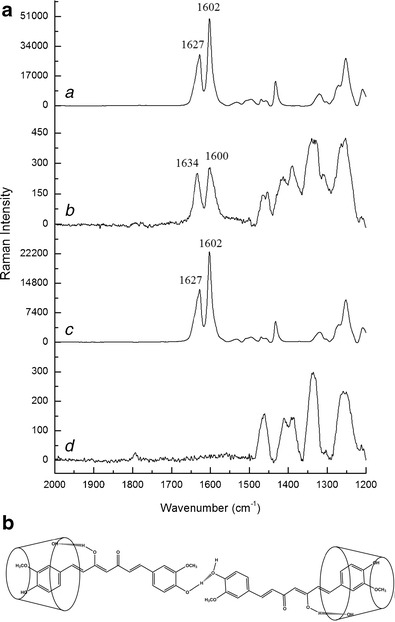
a Raman spectra of a curcumin, b β-cyclodextrin–curcumin inclusion complex nanoparticle, c physical mixture, d β-cyclodextrin. b The proposed structure of β-cyclodextrin–curcumin inclusion complex nanoparticle
X-ray Diffraction
The X-ray diffraction patterns of CUR, BCD, PM and CUR20 (BCD–CUR-N) are shown in Fig. 4. CUR showed the characteristic crystalline peaks of 2θ = 8.80°, 14.46°, 17.24°, 17.78°, 18.00°, 21.06°, 23.30°, 24.58°, 27.38° and 29.20°, whereas BCD displayed peaks of 2θ = 12.66°, 15.96°, 16.12°, 18.24°, 19.00°, 21.14°, 23.00°, 24.22°, 25.7° and 27.10°. The CUR crystalline peaks disappeared in the patterns of BCD–CUR-N, especially the peak of 2θ = 8.80°, whereas the CUR peak of 2θ = 17.78° still appeared, but was less sharp than that in the diffraction pattern of CUR. The results confirmed the successful formation of the inclusion complex. In the case of PM, the characteristic peaks of CUR and BCD were visible, but less intense. X-ray diffraction only allows the differentiation between crystalline data and amorphous material. Reduction in the intensity of BCD–CUR-N compared to CUR and PM endothermic peaks indicated that the complex may have been converted from the crystalline into the amorphous form, thereby increasing the rate of CUR dissolution.
Fig. 4.
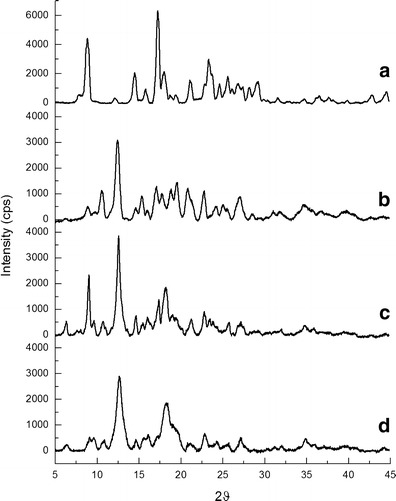
X-ray diffraction patterns of a curcumin, b β-cyclodextrin, c physical mixture and d β-cyclodextrin–curcumin inclusion complex nanoparticle
Differential Thermal Analysis
DTA allowed us to determine the differences between the thermal stability of CUR in the free form and in the form of an inclusion complex. In general, inclusion complexation results in the absence of the endothermic peak or a shift to different temperatures, indicating a change in the crystal lattice, melting, boiling or sublimation points [10]. The thermograms obtained for CUR, BCD, PM and CUR20 (BCD–CUR-N) were presented in Fig. 5. BCD displayed an endothermic peak at 176.9°C and CUR two endothermic peaks at 177.1°C and 283.3°C due to their melting points. PM showed the sum of the endothermic peak of the two components. After the inclusion complex was formed, the peak appeared to be like that of the BCD melting point, but lower (170.1°C). This lower endothermic peak was due to the exchange of CUR for the water molecules located in the BCD cavity. All the prominent peaks corresponding to the CUR melting point completely disappeared, implying that CUR was included in the BCD cavity. These changes at the molecular level prevented the crystallisation of the CUR molecule. Moreover, this behaviour was an indication of stronger interactions between BCD and CUR at the molecular level. This was in contrast to when the two powders were just mixed, which resulted in no association between CUR and BCD at all.
Fig. 5.
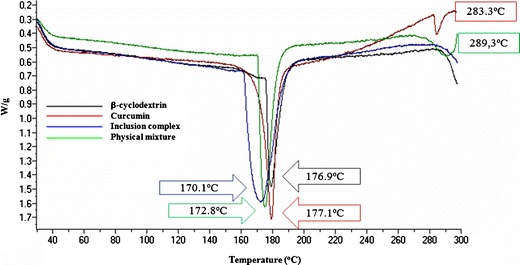
Differential thermal analysis endothermic curves of β-cyclodextrin, curcumin, β-cyclodextrin–curcumin inclusion complex nanoparticle and physical mixture
Scanning Electron Microscopy
Figure 6 illustrates the surface morphology of BCD, CUR, PM and CUR20 (BCD–CUR-N) under different SEM magnifications. BCD was observed to be irregular in shape (Fig. 6a), while CUR was rather spherical (Fig. 6b). PM was seen as a combination of the morphology of the parent compounds (Fig. 6c). In the case of BCD–CUR-N, the morphology was parallelogram, in which the original morphology of both the components had disappeared (Fig. 6d). These changes suggested the formation of BCD–CUR-N inclusion complexes. Moreover, the SEM of BCD–CUR-N showed a uniform particle size distribution with no aggregation, and there was a gap between the particles, thus suggesting good redispersibility.
Fig. 6.
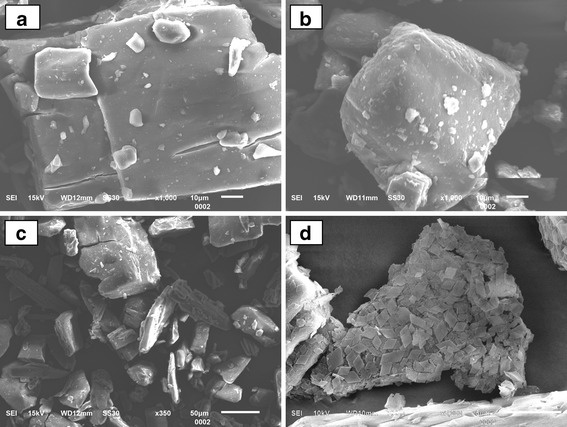
Scanning electron microscope images of a β-cyclodextrin (×1,000), b curcumin (×1,000), c physical mixture (×350) and d β-cyclodextrin–curcumin inclusion complex nanoparticle (×5,000)
Gel Formulation
To the best of our knowledge, this is the first study of a curcumin–β-cyclodextrin nanoparticle inclusion complex formulated in gel form. In this study, Viscolam AT 100P was selected as the gelling agent to formulate the CUR and BCD-CUR-N gels. Viscolam AT 100P is a ready-to-use liquid polymer based on the “Hydro Swelling Droplets” concept. When added to polar systems, it hydrates and swells with the necessity to modify the pH (using triethanolamine). The polyacryloyl dimethyl taurate polymer of Viscolam AT 100P reacted with triethanolamine up to the desired pH (6.2–6.8), with complete ionisation of the polymeric backbone. This in turn resulted in repulsion between the native charges, which added to the swelling of the polymer, and as a consequence, a strong gel was formed. Viscolam AT 100P was chosen based on our previous study which demonstrated that out of the gelling agents HPMC, CMC-Na, carboxymethyl chitosan, carbopol 940 and Viscolam AT 100P, Viscolam AT 100P showed the best stability in terms of pH and viscosity (data not shown) and was also transparent in appearance and smooth. The prepared CUR and BCD–CUR-N gels were yellow in colour with a pleasant and smooth texture, displaying a homogeneous appearance.
In Vitro Skin Permeation Studies
The in vitro permeation studies of CUR were performed with the CUR and BCD–CUR-N gels on the shed skins of P. reticulatus snakes. Snake skin was proposed as a membrane in the skin permeation experiments because differential scanning calorimetry thermograms and IR spectra showed that the stratum corneum of snakes share some similarities with the human stratum corneum structure and components [23]. The distinguishing feature of the shed snake membrane is its lack of follicles. Furthermore, the thickness of the snake membrane was 20–30 μm, similar to that of the human stratum corneum in the upper arm, which is 22.6 μm [24].
The low concentration of CUR used in the formulation of BCD–CUR-N gel (0.01%, w/w) was aimed to mimic the conditions under which the CUR gel has low water solubility and to avoid the use of any organic solvent. The cumulative amount of CUR and the flux after 24 h of gel application per unit square area was investigated using the vertical in vitro diffusion cell. The cumulative amounts of CUR permeating from the CUR and BCD–CUR-N gels were 8.78 ± 0.11 μg/cm2 (n = 3) and 13.80 ± 0.01 μg/cm2 (n = 3) (Fig. 7) or about 34.16 ± 0.03% (n = 3) and 21.73 ± 0.27% (n = 3) of the applied amount of CUR, respectively. These results were relatively constant for 5 and 8 h for the BCD–CUR-N and CUR gels, respectively. The permeation profiles of CUR through the skin from the BCD–CUR-N gel showed no lag time. It was concluded that the BCD–CUR-N or free CUR was immediately released from the vehicle (gel base), then diffused through the membrane and dissolved in receiving fluid. In contrast, the CUR gel permeation profile did demonstrate a lag time due to the difficult penetration through the stratum corneum.
Fig. 7.
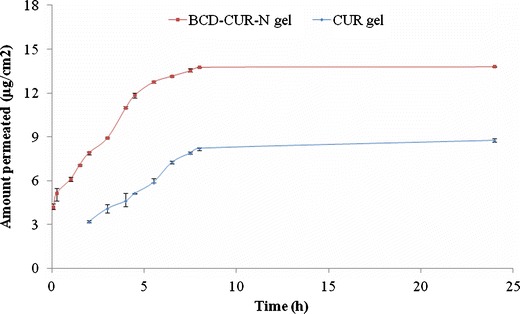
Permeation profiles of curcumin (CUR) gel and β-cyclodextrin–curcumin inclusion complex nanoparticle (BCD–CUR-N) gel
The corresponding CUR fluxes were 1.56 ± 0.03 μg/(cm2 jam) (n = 3) and 0.86 ± 0.01 μg/(cm2 jam) (n = 3) for the BCD–CUR-N and CUR gels, respectively. This showed that the permeation of CUR significantly increased by 1.8-fold (p < 0.01), clearly indicating that the developed inclusion complex formulation had a great potential to deliver CUR across the skin. Although we did not attempt to establish the mechanism of CUR permeation through the skin, we believe that the higher permeation of CUR from the BCD–CUR-N gel was a result of its higher solubility in the aqueous vehicle than that of CUR in the CUR gel. In the first step of the transport process, molecules must be in solution in the gel base to partition from the gel base into the outermost part of the stratum corneum, before diffusing through it. From the last in vitro dissolution studies (Fig. 1a), it was evident that BCD was a potent solubiliser of CUR. This increased solubility caused the higher concentration of CUR (free CUR or CUR in the cyclodextrin complex), resulting in the increased CUR availability at the stratum corneum surface.
The small particle size of BCD–CUR-N of about 156.8 ± 38.3 nm also played a role in increasing the diffusion flux of CUR. In saturated aqueous solutions, guest/cyclodextrin complexes frequently consist of a mixture of inclusion and non-inclusion complexes [25]. Therefore, in the presence of water in the skin, the CUR penetrating into the skin could be either free CUR or CUR in the BCD complex. Due to the small particle size, CUR in the form of the inclusion complex could penetrate into the skin. The small and polar inclusion complex might follow an intercellular pathway comprising of aqueous regions surrounded by polar lipids. The inclusion complex may form hydrogen bonds with the polar lipid at the stratum corneum due to the presence of H-bond donor and acceptor (0.6:0.4) [26].
In general, due to hydrophilicity, only insignificant amounts of the hydrated cyclodextrin molecules and drug/cyclodextrin complexes can penetrate into lipophilic biological barriers such as the intact skin. Only modified methylated cyclodextrins, such as PMBCD, DMBCD and RMBCD, can significantly increase the flux permeation of a drug due to the combined effect of increased aqueous solubility of the guest molecule and reduced barrier function of skin [13, 27]. In addition, in our current study, CUR permeation did not take a long time, not seen in previous inclusion complex permeation studies. To strengthen these in vitro permeability data, the release kinetics was also analysed. To do so, in vitro permeation data were applied to zero-order, first-order, Higuchi kinetics and Korsmeyer–Peppas models. The best fit with the highest regression coefficient values (r2) was predicted by the zero order model (r2 0.9907 and r2 0.9901 for CUR and BCD–CUR-N, respectively) (Table IV). This clearly indicated that the release of CUR or BCD–CUR-N from the Viscolam AT 100P gel followed zero-order kinetics. Drug delivery systems with permeation following zero-order kinetics suggest an increased amount of CUR permeating constantly over time and a more predictable pharmacokinetic and pharmacodynamic profile of CUR release.
Table IV.
Permeation Kinetic Models of Gel Formulations
| Formulation | Model | r 2 | Equation |
|---|---|---|---|
| BCD–CUR-N gel | Zero order | 0.9901 | y = 1.5629x + 4.5393 |
| First order | 0.9514 | y = 0.0843x + 0.6887 | |
| Higuchi | 0.9651 | y = 4.1537x + 2.5034 | |
| Peppas | 0.9159 | y = 0.2595x + 0.8567 | |
| CUR gel | Zero order | 0.9907 | y = 0.8612x + 1.3619 |
| First order | 0.9859 | y = 0.0680x + 0.3926 | |
| Higuchi | 0.9730 | y = 3.6858x − 2.3931 | |
| Peppas | 0.9808 | y = 0.6986x + 0.2724 |
Calculations were performed from three different samples
BCD–CUR-N β-cyclodextrin–curcumin nanoparticle, CUR curcumin
CONCLUSIONS
Curcumin–β-cyclodextrin nanoparticle inclusion complexes prepared by sonication, solvent evaporation and freeze-drying methods were resulted in remarkably improved CUR dissolution. All evaluation data using infrared spectroscopy, powder X-ray diffractometry, differential thermal analysis and scanning electron microscopy confirmed the successful formation of BCD–CUR-N. BCD–CUR-N formulated into gel also exhibited better CUR permeation in in vitro diffusion model.
Acknowledgments
This work was financially supported by the Indonesia Managing High Education for Relevance and Efficiency Program, Bandung Institute of Technology 2012.
Conflict of Interest
There is no conflict of interest to declare.
References
- 1.Maheswari RK, Singh AK, Gaddipati J, Srimal RC. Multiple biological activities of curcumin: a short review. Life Sci. 2006;78(18):2081–7. doi: 10.1016/j.lfs.2005.12.007. [DOI] [PubMed] [Google Scholar]
- 2.De R, Kundu P, Swarnakar S, Ramamurthy T, Chowdhury A, Nair GB, et al. Antimicrobial activity of curcumin against Helicobacter pylori isolates from India and during infections in mice. Antimicrob Agents Chemother. 2009;53(4):1592–7. doi: 10.1128/AAC.01242-08. [DOI] [PMC free article] [PubMed] [Google Scholar]
- 3.Shoba G, Joy D, Joseph T, Majeed M, Rajendran R, Srinivas PS. Influence of piperine on the pharmacokinetics of curcumin in animals and human volunteers. Planta Med. 1998;64(4):353–6. doi: 10.1055/s-2006-957450. [DOI] [PubMed] [Google Scholar]
- 4.Anand P. Biological activities of curcumin and its analogues (Congeners) made by man and Mother Nature. Biochem Pharma. 2008;76:1590–611. doi: 10.1016/j.bcp.2008.08.008. [DOI] [PubMed] [Google Scholar]
- 5.Pan MH, Huang TM, Lin JK. Biotransformation of curcumin through reduction and glucuronidation in mice. Drug Metab Dispos. 1999;27(4):486–94. [PubMed] [Google Scholar]
- 6.Garcea G, Jones DJ, Singh R, Dennison AR, Farmer PB, Sharma RA, et al. Detection of curcumin and its metabolites in hepatic tissue and portal blood of patients following oral administration. Br J Cancer. 2004;90(5):1011–5. doi: 10.1038/sj.bjc.6601623. [DOI] [PMC free article] [PubMed] [Google Scholar]
- 7.Alonso A, Meirelles NC, Yushmanov VE, Tabak M. Water increases fluidity of intercellular membranes of stratum corneum: correlation with water permeability, elastic, and electrical resistance properties. J Invest Dermatol. 1996;106:1058–63. doi: 10.1111/1523-1747.ep12338682. [DOI] [PubMed] [Google Scholar]
- 8.Sparr E, Wennerström H. Responding phospholipid membranes—interplay between hydration and permeability. Biophys J. 2001;81:1014–28. doi: 10.1016/S0006-3495(01)75759-1. [DOI] [PMC free article] [PubMed] [Google Scholar]
- 9.Loftsson T, Brewster ME. Pharmaceutical applications of cyclodextrins. 1. Drug solubilization and stabilization. J Pharm Sci. 1996;85(10):1017–25. doi: 10.1021/js950534b. [DOI] [PubMed] [Google Scholar]
- 10.Vivek RY, Sarasija S, Kshama D, Seema Y. Effect of cyclodextrin complexation of curcumin on its solubility and antiangiogenic and anti-inflammatory activity in rat colitis model. AAPS Pharm Sci Tech. 2009;10(3):752–62. doi: 10.1208/s12249-009-9264-8. [DOI] [PMC free article] [PubMed] [Google Scholar]
- 11.Kazemi F, Zaraghami N, Fekri aval S, Monfaredan A. β-Cyclodextrin–curcumin complex inhibit telomerase gene expression in T47-D breast cancer cell line. African J Biotechnol. 2011;10(83):19481–8. [Google Scholar]
- 12.Yallapu MM, Jaggi M, Chauhan SC. β-Cyclodextrin–curcumin self-assembly enhances curcumin delivery in prostate cancer cells. Colloids Surf. B: Biointerfaces. 2010;79:113–25. doi: 10.1016/j.colsurfb.2010.03.039. [DOI] [PubMed] [Google Scholar]
- 13.Loftsson T, Masson M. Cyclodextrins in topical drug formulations: theory and practice. Int J Pharm. 2001;225:15–30. doi: 10.1016/S0378-5173(01)00761-X. [DOI] [PubMed] [Google Scholar]
- 14.Sznitowska M, Janicki S, Williams AC. Intracellular or intercellular localization of the polar pathway of penetration across stratum corneum. J Pharm Sci. 1998;87:1109–14. doi: 10.1021/js980018w. [DOI] [PubMed] [Google Scholar]
- 15.Jayaprakasha GK, Rao LJM, Sakariah KK. Improved HPLC method for the determination of curcumin, demethoxycurcumin, and bisdemethoxycurcumin. J Agric Food Chem. 2002;50(13):3668–72. doi: 10.1021/jf025506a. [DOI] [PubMed] [Google Scholar]
- 16.Darandale SS, Vavia PR. Cyclodextrin-based nanosponges of curcumin: formulation and physicochemical characterization. J Incl Phenom Macrocycl Chem. 2012;74(1–4):145–55. [Google Scholar]
- 17.Sourabhan S, Kaladhar K, Sharma CP. Method to enhance the encapsulation of biologically active molecules in PLGA nanoparticles. Trends Biomater Artif Organs. 2009;22(3):211–5. [Google Scholar]
- 18.Spivey R, Swofford RL. Inclusion complexes of N-benzoyl-d-leucine and N-benzoyl-l-leucine with beta-cyclodextrin by Raman spectroscopy. Appl Spectrosc. 1999;53:435–8. doi: 10.1366/0003702991946893. [DOI] [Google Scholar]
- 19.Frank CJ. Review of pharmaceutical applications of Raman spectroscopy. In: Pelletier MJ, editor. Analytical applications of Raman spectroscopy. UK: Blackwell Science; 1999. pp. 224–71. [Google Scholar]
- 20.Rossi B, Verrocchio P, Villiani G. Vibrational dynamics of inclusion complexes by Raman scattering: an experimental and numerical study. Phil Mag. 2007;87:559. doi: 10.1080/14786430600887657. [DOI] [Google Scholar]
- 21.Aggarwal BB, Kumar A, Bharti AC. Anticancer potential of curcumin: preclinical and clinical studies. Anticancer Res. 2003;23:363–98. [PubMed] [Google Scholar]
- 22.Sanphui P, Goud NR, Khandavilli UBR, Bhanoth S, Nangia A. New polymorphs of curcumin. Chem. Commun. 2011;47:5013–5. doi: 10.1039/c1cc10204d. [DOI] [PubMed] [Google Scholar]
- 23.Lin SY, Hou SJ, Hsu TH, Yeh FL. Comparisons of different animal skins with human skin in drug percutaneous penetration studies. Methods Find Exp Clin Pharmacol. 1992;14:645–54. [PubMed] [Google Scholar]
- 24.Egawa M, Hirao T, Takahashi M. In vivo estimation of stratum corneum thickness from water concentration profiles obtained with Raman spectroscopy. Acta Derm Venereol. 2007;87:4–8. doi: 10.2340/00015555-0183. [DOI] [PubMed] [Google Scholar]
- 25.Loftsson T, Masson M, Brewster ME. Self-association of cyclodextrins and cyclodextrin complexes. J Pharm Sci. 2004;93:1091–9. doi: 10.1002/jps.20047. [DOI] [PubMed] [Google Scholar]
- 26.Pugh WJ, Hadgraft J, Roberts MS. Physicochemical determinants of stratum corneum permeation. In: Roberts MS, Walters KA, editors. Dermal absorption and toxicity assessment. New York: Marcel Dekker; 1998. pp. 245–68. [Google Scholar]
- 27.Babu RJ, Pandit JK. Effect of cyclodextrins on the complexation and transdermal delivery of bupranolol through rat skin. Int J Pharm. 2004;271:155–65. doi: 10.1016/j.ijpharm.2003.11.004. [DOI] [PubMed] [Google Scholar]


