Abstract
A high-throughput thermal-scanning method to rank-order formulation conditions for therapeutic proteins is described. Apparent transition temperatures for unfolding and aggregation of four different proteins are determined using the dyes SYPRO Orange and thioflavin T (ThT) under a variety of buffer conditions. The results indicate that the ThT-based thermal scanning method offers several advantages over the previously described SYPRO Orange-based thermal scanning and allows rapid rank ordering of solution conditions relevant toward long-term storage of therapeutic molecules. The method is also amenable to high protein concentration and does not require sample dilution or extensive preparation. Additionally, this parallel use of SYPRO Orange and ThT can be readily applied to the screening of mutants for their unfolding and aggregation propensities.
Electronic supplementary material
The online version of this article (doi:10.1208/s12249-013-0026-2) contains supplementary material, which is available to authorized users.
KEY WORDS: aggregation, high-throughput, thermal-scanning, thioflavin T, unfolding
INTRODUCTION
Maintaining the long-term physical stability of bio-therapeutics over a desired shelf-life is one of the most important challenges in pharmaceutical development (1,2). Physical instability, particularly protein aggregation, can dramatically reduce product potency, impart immunogenicity, and compromise product elegance (3). Aggregation is a commonly observed degradation pathway in the development of therapeutic proteins, and thus, a central goal of formulation selection is to mitigate both the rate and extent of aggregation in the final product. Generally, protein aggregation is a complex phenomenon involving multiple steps and species (4). Non-native aggregation, a well-studied and characterized pathway of aggregation, occurs via partially or fully unfolded states of a polypeptide. These aggregates are usually soluble, but may grow large enough to form insoluble protein precipitates which could potentially elicit an immune response upon injection (4). Currently, there are a variety of high-throughput methods including intrinsic and extrinsic fluorescence spectroscopy to study protein unfolding and detect soluble aggregates (5). A few of the most commonly used fluorescent dyes to probe protein unfolding include SYPRO Orange and 1-anilino-8-naphthalene sulfonate (6–8). Similarly, aggregate formation has been studied using thioflavin T (ThT), Nile Red, and Congo Red which have been known to bind specifically to amyloid-type fibrils (9–13). In the context of rapidly assessing the physical stability of proteins, a high-throughput approach using SYPRO Orange dye was previously described for examining unfolding propensity of protein mutants as well as rank-ordering protein formulations for their conformational stability (14). Although conformational stability is generally a good indicator of protein stability in the context of non-native aggregation, it provides an incomplete picture of the downstream processes contributing to aggregation, e.g., the association of aggregation-prone intermediates into higher-order species (15). Moreover, there are instances where unfolding does not necessarily correlate with the propensity towards aggregation, and there are examples of proteins that unfold reversibly (16,17). Here, we report a novel high-throughput approach using ThT (to follow progression of amyloid forming aggregates) in parallel with SYPRO Orange (to follow protein unfolding) to rank-order formulation conditions. We illustrate broad utility of this method using four different proteins, three of which are pharmaceutically relevant. These proteins represent diverse structural scaffolds—a globular single domain protein (α-chymotrypsinogen), fusion proteins with multiple domains and a monoclonal antibody. Additionally, in this paper, we discuss the merits and potential limitations of this approach towards its application across wider range of polypeptides.
MATERIALS AND METHODS
Thermal-Scanning Assay
A step-wise thermal ramp from 25°C to 95°C was achieved using a CFX96 Real-Time PCR (RT-PCR) Detection System (Bio-Rad, Hercules, CA). A series of temperature steps (0.7°C increment) and hold times (15 s hold; 13.8 s read times) maintained an effective scan rate of 90°C/h. The dyes SYPRO Orange (Invitrogen) and ThT (Calbiochem) were used as in situ probes of protein unfolding and aggregation fluorescence, respectively. A 1-μL aliquot of Sypro was spiked into each well containing 40 μL of 1 mg/mL (or at other protein concentration where specified) protein solution to yield a final SYPRO Orange concentration of five times (the absolute dye concentration is not published by the manufacturer). In separate well containing another aliquot of the same protein solution, 2 μL of ThT was added to the final concentration of 102 μM. It is important to note that the two dyes are not added to the same well; rather the instrument allows parallel acquisition of the multiple emission wavelength signals upon excitation. The range of excitation wavelengths for the ThT-containing samples was 450–490 nm, whereas emission was monitored within 510–530 nm. SYPRO Orange samples were excited at 515–535 nm, and the emission range was 560–580 nm. The raw fluorescence data were normalized for each condition for comparative purposes and fit to Eq. 1 (below) to obtain the mid-point of the thermal transition (TM.app) with SYPRO Orange (the mid-point of thermal transition for “unfolding” (TM.u)) and ThT (the mid-point of thermal transition for “aggregation” (TM.agg)).
 |
1 |
Where m is the slope of the transition, I, the normalized fluorescence intensity, and T is the temperature. In some of the examples described in this manuscript, experiments were conducted in triplicates and standard deviation (SD) of the mid-points of thermal transitions was determined from individual fittings to the above equation.
Temperature-Scanning Monomer Loss
This method was adapted from a recent publication dealing with aggregation prediction from a temperature scanning monomer loss approach (18). Samples were pipetted into a 1 × 1-cm quartz cuvette and placed into the temperature-controlling block within a Varian Cary Eclipse Fluorescence Spectrophotometer (Agilent, Santa Clara, CA). The system was programmed to thermally ramp from 25°C to 85°C at a scan rate of 90°C/h. A Teflon stir bar was used to ensure sample homogeneity throughout the run. Aliquots (80 μL) were taken from each cuvette at predetermined temperatures throughout the thermal ramp. These aliquots were placed in Waters QSert vials and quenched on an ice bath for a minimum of 5 min before being analyzed by size-exclusion chromatography (SEC). A Waters Alliance 2695 separations module with a Waters 996 photodiode array detector (Milford, MA) equipped with a TSKgel G3000SWxl size-exclusion column (Tosoh Bioscience, King of Prussia, PA) was used to quantify the amount of monomer remaining in each sample. Monomer peak area for each temperature point was normalized against the initial, total monomer value. The module auto-sampler was maintained at 4°C while the column was left at room temperature (21°C). The mobile phase used was 0.2 M potassium phosphate with 0.9% sodium chloride at pH 6.8. The injection volume, run time, and flow rate were set to 20 μL, 20 min, and 1 mL/min, respectively.
Effect of Presence of ThT on Aggregation of Proteins Used in This Study
To assess if ThT influenced the levels of aggregates, protein samples at 1 mg/mL, with (100 μM final ThT concentration) or without the dye were incubated in 96-well plates and subjected to the thermal ramp (25°C to 80°C at 90°C/h) in the RT-PCR machine. The samples were rapidly cooled to 4°C and were analyzed by SEC. A Waters Alliance 2695 separations module with a Waters 996 photodiode array detector (Milford, MA) equipped with a TSKgel G3000SWxl size-exclusion column (Tosoh Bioscience, King of Prussia, PA) was used to quantify the amount of monomer as well as total aggregates. The module auto-sampler was maintained at 4°C while the column was left at room temperature (21°C). The mobile phase used was 1×phosphate buffered saline. The injection volume, run time, and flow rate were set to 20 μL, 20 min, and 1 mL/min, respectively. In the cases where significant level of precipitation occurred, prohibiting aggregate analysis using size exclusion-HPLC (SE-HPLC), a dynamic light scattering (DLS) experiment was conducted to show formation of higher-order species. Samples (50 μL) were loaded onto a 384-well plate and analyzed using Wyatt, DynaPro (Santa Barbara, CA) plate reader system.
Unfolding of proteins was verified using intrinsic fluorescence experiments under thermal ramp conditions (25°C to 95°C at 90°C/h). Protein samples (1 mg/mL, 2 mL) were incubated in quartz cuvette and placed into the temperature-controlling block. Intrinsic protein fluorescence was measured by exciting the samples at 280 nm and collecting the emission fluorescence signal at 340 nm. A Teflon stir bar was used to ensure sample mixing throughout the run.
RESULTS AND DISCUSSION
In this study, a high-throughput thermal-scanning method has been implemented to probe simultaneously the unfolding and aggregation of proteins using two fluorescent dyes that respond to the physicochemical microenvironment via changes in emission properties. SYPRO Orange and ThT were separately added to the protein solutions in a 96-well plate, and unfolding as well as aggregation was monitored as a function of temperature on a RT-PCR instrument. The amount of protein required for each sample was less than 100 μg, and the runtime of 96 samples was less than an hour. Figures 1 and 2 show results from a thermal-scanning assay for a multi-domain protein (MDP) using SYPRO Orange and ThT. Under the three solution conditions studied, sharp and reproducible melting transitions were observed for both the Sypro (Fig. 1) and the ThT (Fig. 2) scans. A SD of less than 0.2°C across three repeats was calculated from the mid-point of thermal transitions obtained from the fitting to Eq. 1. To confirm that the observed increase in fluorescence intensity was due to the binding of ThT to the aggregates and not a result of association between the dye and unfolded monomers, changes in fluorescence intensity of the protein solutions held at room temperature was measured in the presence of increasing urea concentration. In the presence of 1 mg/mL of MDP, there is only a minor increase in the ThT fluorescence intensity as a function of increasing urea concentration (Fig. 3). By contrast, there is ∼15-fold increase in the intensity during thermal scanning under identical solution condition (Fig. 3, inset). The results in Fig. 3 show that the changes in fluorescence intensity of ThT under chemical denaturing conditions is minimal in comparison to the change observed with increasing temperature, suggesting that there was little to no binding of ThT to the unfolded monomers. It is well known that ThT binds aggregates or aggregation competent species (distinct from the unfolded species) as well as amyloid-type fibrils with cross-beta sheet structures except, in few instances where this dye is known to bind the native state of the protein (19–22). Additionally, for another protein that was previously shown to undergo a reversible thermal transition, no significant change in the intensity of ThT fluorescence signal was observed as a function of increasing temperature (data not shown). By contrast, a robust increase in the intensity of SYPRO Orange fluorescence was evident with a similar temperature ramp (data not shown).
Fig. 1.
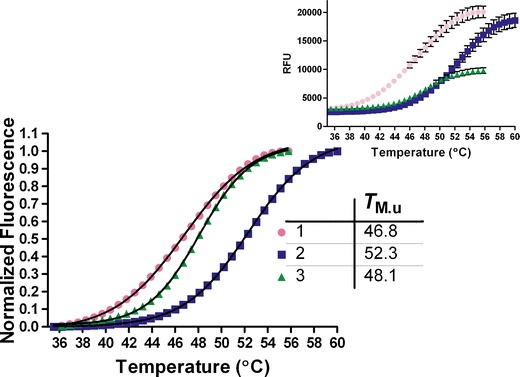
Thermal scanning of MDP (1 mg/mL) under three different solution conditions using SYPRO Orange. The relative fluorescence units (RFU; Inset) were normalized and fit to Eq. 1 to obtain the mid-point of the thermal transitions. Inset shows the plot of the fluorescence intensity change as a function of temperature, and the error bars in black are the SD of the triplicate runs. The SD in T M.u measurement under these conditions in this case was ≤0.2°C
Fig. 2.
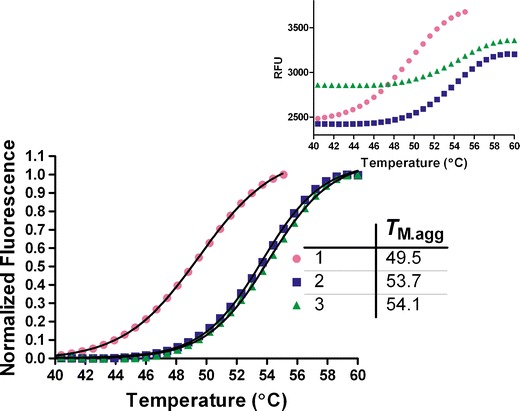
Thermal scanning of MDP (1 mg/mL) under three different solution conditions using ThT. The relative fluorescence units (RFU; Inset) were normalized and fit to Eq. 1 to obtain the mid-point of the thermal transitions. Inset shows the plot of the fluorescence intensity change as a function of temperature, and the error bars in black are the SD of the triplicate runs. The SD in T M.agg measurement under these conditions in this case was ≤0.1°C
Fig. 3.
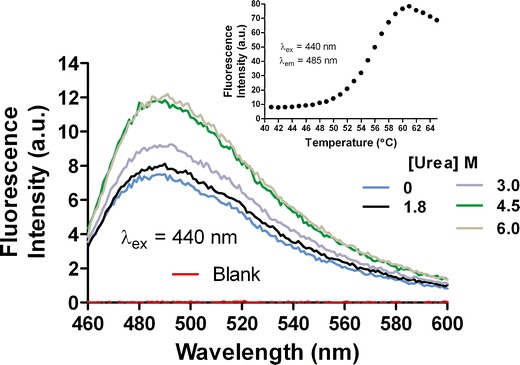
Comparison of fluorescence intensity changes under urea unfolding and thermal scanning experiment. In the presence of 1 mg/mL of MDP, there is only a minor increase in the ThT fluorescence intensity as a function of increasing urea concentration. By contrast, there is ∼15-fold increase during thermal scanning under identical solution condition (inset)
In Figs. 1 and 2, it is interesting to note that condition 3, which is relatively less stable in comparison with condition 1 based upon the TM.u (obtained from SYPRO Orange thermal scan) value is the one with the highest TM.agg value in the ThT thermal scan. Under these solution conditions, the long-term stability data as well as the monomer loss data obtained from the SEC analysis suggests that TM.agg value, compared with TM.u value, is a better indicator of the aggregation propensity. Figure 4 shows a comparison of temperature-scanning monomer loss (TSML) for the same three conditions shown in Figs. 1 and 2. We postulate that the sensitivity of SYPRO Orange to solution conditions likely leads to unexpected shifts in the TM.u values. Although there is a significant difference in the apparent melting temperatures between methods (TSML and thermal scans using ThT), the overall trends hold very well for different conditions. The reasons for the apparent discrepancy in mid-points of the transitions could be manifold; the sensitivity of the fluorescence signal change upon ThT binding is higher than the UV detection method used for SEC and/or ThT binding to species (aggregation competent species) occurring earlier in the aggregation process than those detected by SE-HPLC (21,22). Further investigations will be required to unravel the contributions of each of these factors. However, it is evident from the unfolding experiments using urea that ThT does not bind unfolded polypeptides and more likely interacts with other species having structures akin to aggregates or other aggregation prone intermediates (Fig. 3, inset). To confirm that the MDP does undergo unfolding and aggregation at high-temperature intrinsic protein fluorescence, SE-HPLC and DLS experiments were conducted (Supplemental Figs. S1, S2, and S3).
Fig. 4.
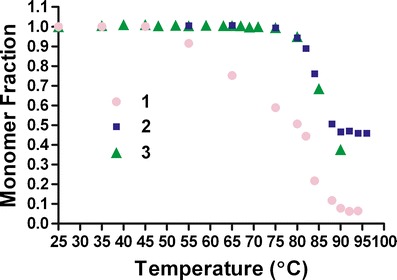
Monomer loss experiment for MDP (1 mg/mL) under the three different solution conditions as in Fig. 1, analyzed using SE-HPLC (details in “Materials and Methods”)
To investigate the effect of protein concentration on the utility of using ThT as a rank-ordering tool in formulation development, additional studies were conducted with the MDP at higher protein concentrations (Fig. 5). The data show that this approach can be readily applied to high protein concentration solutions, without need for dilution. In fact, there is a significant improvement in the signal at higher protein concentration in thermal scans using ThT. This is particularly relevant in the context of high concentration protein formulations where dilution may have significant effect on the rates of aggregation or potential to reverse aggregates that have not yet undergone nucleation, which is a limitation of other commonly used analytical techniques (e.g., DSC and SE-HPLC).
Fig. 5.
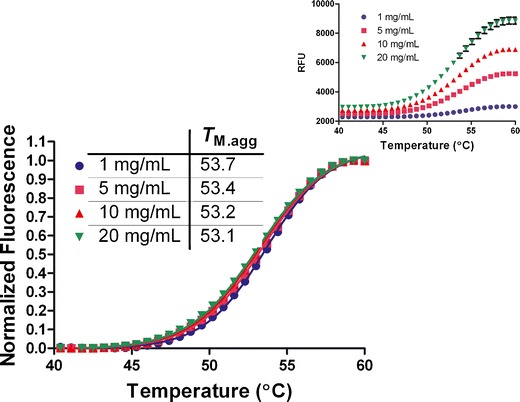
Thermal scanning of MDP (1 mg/mL) at different protein concentrations in the presence of ThT. The relative fluorescence units (RFU; inset) at each concentration was normalized and fit to Eq. 1 to obtain the mid-point of the thermal transitions. Inset shows the plot of the fluorescence intensity change as a function of temperature, and the error bars in black are the SD of the quadruplicate runs. The SD in T M.agg measurement at each protein concentration in this case was ≤ 0.1°C
To assess the broader application of this approach, similar studies were conducted on three other proteins–α-chymotrypsinogen (aCgn)—a small globular protein, a monoclonal antibody (mAb), and a fusion protein (FP) under various solution conditions. The mid-points of the thermal transitions for these proteins are listed in Tables I, II, and III. In all the cases, there is a good correlation between the apparent unfolding and aggregation mid-points determined from SYPRO Orange and ThT thermal scans. Additionally, as expected, unfolding precedes protein aggregation as evident by the lower mid-point of thermal transitions of SYPRO Orange. This is consistent with most mechanisms of non-native aggregation (4). Importantly, the excellent reproducibility of the experimental data evident from the small errors in the measurement (standard deviation for triplicate measurements, ≤0.2°C) highlights the ability of the method to discriminate small shifts in the in the mid-point of thermal transitions, TM.app. In the case of the FP, there is also a good correspondence between the differential scanning fluorescence measurements and the long-term physical stability under storage conditions (data not shown). The mAb was rather insensitive to changes in the buffer conditions as indicated by only minor changes in the transition temperatures.
Table I.
Mid-points of Thermal Transition for Under Different Solution Conditions for aCgn (1 mg/mL)
| aCgn | ||
|---|---|---|
| Solution conditions | T m.u (°C) | T m.agg (°C) |
| 20 mM Citrate Buffer (100 mM NaCl; pH 4.6) | 56.2 | 57.4 |
| 20 mM Citrate Buffer (100 mM NaCl; pH 3.5) | 50.0 | 51.8 |
| 20 mM Citrate Buffer (100 mM NaCl; pH 2.5) | 43.9 | 44.3 |
| 20 mM Citrate Buffer (pH 4.6) | 56.6 | 58.3 |
| 20 mM Citrate Buffer (300 mM NaCl; pH 4.6) | 55.2 | 56.8 |
| 20 mM Citrate Buffer (500 mM NaCl; pH 4.6) | 55.2 | 56.5 |
aCgn α-chymotrypsinogen, T M.u temperatures for unfolding, T M.agg temperatures for aggregation
Table II.
Mid-points of Thermal Transition for mAb (1 mg/mL) Under Different Solution Conditions
| mAb | ||
|---|---|---|
| Solution conditions | T m.u (°C) | T m.agg (°C) |
| 20 mM succinate (pH 5.5) | 62.9 | 64.9 |
| 20 mM succinate (pH 6.0) | 62.6 | 64.4 |
| 20 mM succinate (pH 6.5) | 62.7 | 64.1 |
| 20 mM histidine (pH 5.7) | 62.4 | 64.8 |
| 20 mM histidine (pH 6.2) | 62.6 | 64.9 |
| 20 mM histidine (pH 6.6) | 62.9 | 64.8 |
| 20 mM citrate (pH 5.4) | 62.3 | 63.9 |
| 20 mM citrate (pH 6.0) | 62.0 | 63.5 |
| 20 mM citrate (pH 6.5) | 61.7 | 62.8 |
mAb monoclonal antibody, T M.u temperatures for unfolding, T M.agg temperatures for aggregation
Table III.
Mid-points of Thermal Transition for FP (1 mg/mL) Under Different Solution Conditions
| FP | ||
|---|---|---|
| Solution conditions | T m.u (°C) | T m.agg (°C) |
| 20 mM histidine (pH 7.7) | 44.8 | 49.3 |
| 20 mM histidine (pH 7.0) | 41.9 | 47.0 |
| 20 mM histidine (pH 6.5) | 35.1 | 45.7 |
| 20 mM histidine (10 mM NaCl; pH 7.7) | 41.7 | 47.0 |
| 20 mM histidine (50 mM NaCl; pH 7.7) | 38.1 | 46.7 |
FP fusion protein, T M.u temperatures for unfolding, T M.agg temperatures for aggregation
It is important to note that the proteins used in this study have significant beta-sheet content and possibly aggregate to form amyloid-type species. As it is known that ThT specifically binds to amorphous and fibrillar aggregates with cross beta-sheet motifs, it is likely that this approach may not apply in instances where ThT does not have affinity for aggregate species. However, this approach is expected to be widely applicable to therapeutic antibodies (most have high beta-sheet content) and a handful of globular proteins. ThT-based thermal scans may not work in instances where the protein unfolds reversibly or instances where the kinetics of aggregate formation is slower on the timescales of thermal ramps. However, in the latter cases modulating the ramp rates may circumvent this potential limitation. It should also be noted that fluorescent dyes have been shown to promote unfolding and aggregate formation in many instances and the unfolding and aggregation parameters do not always correspond to those measured by label-free techniques. In fact, our SE-HPLC and DLS results with FP show that presence of ThT does increase the level of protein aggregates in comparison to the solution without the dye. By contrast, there is minimal change in the aggregate levels for MDP and mAb (Supplementary Figs. S2 and S3). However, despite the potential for the dye to alter the thermal transitions of the proteins, it is important to note that the goal of this assay is relative rank ordering of solution conditions with the assumption that there will be little change in the effect of dye across different solution conditions for a given molecule. As noted for the MDP, the FP, aCgn, and the mAb were also confirmed to undergo unfolding and aggregation (Supplemental Figs. S1, S2, and S3) (23).
Overall, ThT-based thermal scans offer more direct assessment of the colloidal stability of proteins versus indirect inference derived from using SYPRO Orange, a dye primarily reporting on protein unfolding. In addition, the fact that ThT can be applied to higher protein concentrations is a significant advantage. Importantly, ThT is not expected to be influenced by the presence of formulation excipients such as surfactants, which are commonly known to interfere with SYPRO Orange signal. This contrast between ThT and SYPRO Orange was highlighted by the example of MDP protein used in this study (Figs. 1 and 2).
As mentioned earlier, a handful of articles describe application of high-throughput methods to study protein aggregation and unfolding (5,24,25). Recently, differential static light scattering was developed to follow protein aggregation in a high-throughput format in combination with differential scanning flurimetry for screening of protein formulation conditions (6). However, this approach requires use of a different set of equipments. Thus, meaningful interpretation of the data necessitates utmost care in terms of instrument calibrations and choice of operational conditions (e.g., the temperature ramp rate). A recent kinetic study showed that binding of ThT was a good indicator of the antibody stability, which was also correlated with the aggregation propensity predicted by computational modeling (26). As the approach presented here utilizes a real-time PCR instrument that allows concomitant reading of fluorescence signal from the two distinct dyes, it offers robust control over the experimental conditions. Overall, this thermal-scanning method allows rapid rank ordering of solution conditions for unfolding and aggregation therefore greatly facilitating the formulation development efforts. One potential extension of this approach would be in stability screening of protein mutants, thereby improving efficiency in the biologic discovery space (8). Importantly, in combination with other biophysical and structural data, this thermal scanning approach may provide important mechanistic insight on the complex pathways of non-native protein aggregation. Finally, the observations in this study highlight the significance of methods that directly reports on aggregation over an indirect approach based upon the projections of thermal unfolding.
Electronic Supplementary Material
(DOCX 2628 kb)
ACKNOWLEDGMENTS
The authors are grateful to Dr. Rajesh B. Gandhi and Dr. Venkatramana Rao for their support and valuable discussions.
REFERENCES
- 1.Frokjaer S, Otzen DE. Protein drug stability: a formulation challenge. Nat Rev Drug Discov. 2005;4:298–306. doi: 10.1038/nrd1695. [DOI] [PubMed] [Google Scholar]
- 2.Wang W. Protein aggregation and its inhibition in biopharmaceutics. Int J Pharm. 2005;289:1–30. doi: 10.1016/j.ijpharm.2004.11.014. [DOI] [PubMed] [Google Scholar]
- 3.Kumar S, Singh SK, Wang X, Rup B, Gill D. Coupling of aggregation and immunogenicity in biotherapeutics: T- and B-cell immune epitopes may contain aggregation-prone regions. Pharm Res. 2011;28:949–961. doi: 10.1007/s11095-011-0414-9. [DOI] [PubMed] [Google Scholar]
- 4.Roberts CJ, Das TK, Sahin E. Predicting solution aggregation rates for therapeutic proteins: approaches and challenges. Int J Pharm. 2011;418:318–333. doi: 10.1016/j.ijpharm.2011.03.064. [DOI] [PubMed] [Google Scholar]
- 5.Hawe A, Sutter M, Jiskoot W. Extrinsic fluorescent dyes as tools for protein characterization. Pharm Res. 2008;25:1487–1499. doi: 10.1007/s11095-007-9516-9. [DOI] [PMC free article] [PubMed] [Google Scholar]
- 6.Goldberg DS, Bishop SM, Shah AU, Sathish HA. Formulation development of therapeutic monoclonal antibodies using high-throughput fluorescence and static light scattering techniques: role of conformational and colloidal stability. J Pharm Sci. 2011;100:1306–1315. doi: 10.1002/jps.22371. [DOI] [PubMed] [Google Scholar]
- 7.Ghosh U, Das M, Dasgupta D. Association of fluorescent probes 1-anilinonapthalene-8-sulfonate and 4,4′-dianilino-1,1′-binapthly-5,5′-disulfonic acid with T7 RNA polymerase. Biopolymers. 2003;72:249–255. doi: 10.1002/bip.10376. [DOI] [PubMed] [Google Scholar]
- 8.Lavinder JJ, Hari SB, Sullivan BJ, Magliery TJ. High-throughput thermal scanning: a general, rapid dye-binding thermal shift screen for protein engineering. J Am Chem Soc. 2009;131:3794–3795. doi: 10.1021/ja8049063. [DOI] [PMC free article] [PubMed] [Google Scholar]
- 9.Ferrao-Gonzales AD. Controlling -amyloid oligomerization by the use of naphthalene sulfonates: trapping low molecular weight oligomeric species. J Biol Chem. 2005;280:34747–34754. doi: 10.1074/jbc.M501651200. [DOI] [PubMed] [Google Scholar]
- 10.Ahmad B, Winkelmann J, Tiribilli B, Chiti F. Searching for conditions to form stable protein oligomers with amyloid-like characteristics: the unexplored basic pH. Biochim Biophys Acta Protein Proteomics. 2010;1804:223–234. doi: 10.1016/j.bbapap.2009.10.005. [DOI] [PubMed] [Google Scholar]
- 11.Dusa A, Kaylor J, Edridge S, Bodner N, Hong DP, Fink AL. Characterization of oligomers during alpha-synuclein aggregation using intrinsic tryptophan fluorescence. Biochemistry. 2006;45:2752–2760. doi: 10.1021/bi051426z. [DOI] [PubMed] [Google Scholar]
- 12.Uversky VN. Amyloidogenesis of natively unfolded proteins. Curr Alzheimer Res. 2008;5:260–287. doi: 10.2174/156720508784533312. [DOI] [PMC free article] [PubMed] [Google Scholar]
- 13.Voropai ES, Samtsov MP, Kaplevskii KN, Maskevich AA, Stepuro VI, Povarova OI, et al. Spectral properties of thioflavinT and its complexes with amyloid fibrils. J Appl Spectrosc. 2003;70:868–873. doi: 10.1023/B:JAPS.0000016303.37573.7e. [DOI] [Google Scholar]
- 14.Ericsson U, Hallberg B, Detitta G, Dekker N, Nordlund P. Thermofluor-based high-throughput stability optimization of proteins for structural studies. Anal Biochem. 2006;357:289–298. doi: 10.1016/j.ab.2006.07.027. [DOI] [PubMed] [Google Scholar]
- 15.Sahin E, Jordan JL, Spatara ML, Naranjo A, Costanzo JA, Weiss WF, et al. Computational design and biophysical characterization of aggregation-resistant point mutations for γD crystallin illustrate a balance of conformational stability and intrinsic aggregation propensity. Biochemistry. 2011;50:628–639. doi: 10.1021/bi100978r. [DOI] [PubMed] [Google Scholar]
- 16.Derrick T, Grillo AO, Vitharana SN, Jones L, Rexroad J, Shah A, et al. Effect of polyanions on the structure and stability of repifermin™ (keratinocyte growth factor-2) J Pharm Sci. 2007;96:761–776. doi: 10.1002/jps.20797. [DOI] [PubMed] [Google Scholar]
- 17.Raibekas AA, Bures EJ, Siska CC, Kohno T, Latypov RF, Kerwin BA. Anion binding and controlled aggregation of human interleukin-1 receptor antagonist. Biochemistry (Mosc) 2005;44:9871–9879. doi: 10.1021/bi050388g. [DOI] [PubMed] [Google Scholar]
- 18.Brummitt RK, Nesta DP, Roberts CJ. Predicting accelerated aggregation rates for monoclonal antibody formulations, and challenges for low-temperature predictions. J Pharm Sci. 2011;100(10):4234–4243. doi: 10.1002/jps.22633. [DOI] [PubMed] [Google Scholar]
- 19.Kuznetsova IM, Sulatskaya AI, Uversky VN, Turoverov KK. Analyzing thioflavin T binding to amyloid fibrils by an equilibrium microdialysis-based technique. PLoS ONE. 2012;7:e30274. doi: 10.1371/journal.pone.0030274. [DOI] [PMC free article] [PubMed] [Google Scholar]
- 20.De Ferrari GV. Thioflavin T is a fluorescent probe of the acetylcholinesterase peripheral site that reveals conformational interactions between the peripheral and acylation sites. J Biol Chem. 2001;276:23282–23287. doi: 10.1074/jbc.M009596200. [DOI] [PubMed] [Google Scholar]
- 21.Wang G, Fersht AR. First-order rate-determining aggregation mechanism of p53 and its implications. PNAS. 2012;109:13590–13595. doi: 10.1073/pnas.1211557109. [DOI] [PMC free article] [PubMed] [Google Scholar]
- 22.Wilcken R, Wang G, Boeckler FM, Fersht AR. Kinetic mechanism of p53 oncogenic mutant aggregation and its inhibition. PNAS. 2012;109:13584–13589. doi: 10.1073/pnas.1211550109. [DOI] [PMC free article] [PubMed] [Google Scholar]
- 23.Yi L, Ogunnaike BA, Roberts CJ. Multi-variate approach to global protein aggregation behavior and kinetics: effects of pH, NaCl, and temperature for alpha-chymotrypsinogen A. J Pharm Sci. 2010;99:645–662. doi: 10.1002/jps.21869. [DOI] [PubMed] [Google Scholar]
- 24.Aucamp JP, Cosme AM, Lye GJ, Dalby PA. High-throughput measurement of protein stability in microtiter plates. Biotech Bioeng. 2005;89:599–607. doi: 10.1002/bit.20397. [DOI] [PubMed] [Google Scholar]
- 25.He F, Hogan S, Latypov RF, Narhi LO, Razinkov VI. High throughput thermostability screening of monoclonal antibody formulations. J Pharm Sci. 2009;99:1707–1720. doi: 10.1002/jps.21955. [DOI] [PubMed] [Google Scholar]
- 26.Kayser V, Chennamsetty N, Voynov V, Helk B, Trout BL. Conformational stability and aggregation of therapeutic monoclonal antibodies studied with ANS and thioflavin T binding. MAbs. 2011;3:408–411. doi: 10.4161/mabs.3.4.15677. [DOI] [PMC free article] [PubMed] [Google Scholar]
Associated Data
This section collects any data citations, data availability statements, or supplementary materials included in this article.
Supplementary Materials
(DOCX 2628 kb)


