

Abstract
Extracellular polysaccharides comprise a major component of the biofilm matrix. Many species that are adept at biofilm formation have the capacity to produce multiple types of polysaccharides. Pseudomonas aeruginosa produces at least three extracellular polysaccharides, alginate, Pel and Psl, that have been implicated in biofilm development. Non-mucoid strains can use either Pel or Psl as the primary matrix structural polysaccharide. In this study, we evaluated a range of clinical and environmental P. aeruginosa isolates for their dependence on Pel and Psl for biofilm development. Mutational analysis demonstrates that Psl plays an important role in surface attachment for most isolates. However, there was significant strain-to-strain variability in the contribution of Pel and Psl to mature biofilm structure. This analysis led us to propose four classes of strains based upon their Pel and Psl functional and expression profiles. Our data also suggest that Pel and Psl can serve a redundant function as a structural scaffold in mature biofilms. We propose that redundancy could help preserve the capacity to produce a biofilm when exopolysaccharide genes are subjected to mutation. To test this we used PAO1, a common lab strain that primarily utilizes Psl in the matrix. As expected, a psl mutant strain initially produced a poor biofilm. After extended cultivation, we demonstrate that this strain acquired mutations that up-regulated expression of the Pel polysaccharide, demonstrating the utility of having a redundant scaffold exopolysaccharide. Collectively, our studies revealed both unique and functionally redundant roles for two distinct biofilm exopolysaccharides.
Introduction
Pseudomonas aeruginosa thrives in diverse environments, including soil, water, insects, plants and animals (26). In humans, P. aeruginosa is an opportunist, capable of causing both acute and chronic infections. Examples of acute infection include, urinary track infections, respiratory infections, soft tissue infections, bone and joint infections, bacteremia and a variety of systemic infections (2). P. aeruginosa is also well known for the chronic infections it causes in individuals with the genetic disease, cystic fibrosis (CF) (25). It is widely believed that biofilm growth within the lungs of CF patients is a hallmark for the facilitation of disease (49, 55). Biofilm bacteria exhibit reduced susceptibility to antimicrobials, detergents and the host immune system compared to planktonic cells (18, 27, 46). As a result biofilm infections (including CF airway infections) tend to be chronic and difficult to eradicate (13).
Biofilms are surface associated communities embedded within an extracellular matrix (46, 49, 59). The extracellular matrix consists of polysaccharides, proteins, nucleic acids and lipids and is a distinguishing feature of biofilms, capable of functioning as both a structural scaffold and protective barrier (28). Extracellular polysaccharides are a crucial component of the matrix, and carry out a range of functions including promoting attachment to surfaces and other cells, building and maintaining biofilm structure, as well as protecting the cells from antimicrobials and host defenses (58, 59).
P. aeruginosa produces at least three extracellular polysaccharides that can be important in biofilm development (51). Alginate is an important biofilm exopolysaccharide that is over-produced in mucoid variants, which are often isolated from lungs of chronically-colonized CF patients (25). In mucoid strains, alginate is the predominant extracellular polysaccharide of the matrix (29). Non-mucoid strains utilize primarily the Pel and Psl polysaccharides for biofilm formation (65). The pel locus contains seven genes encoding functions involved in the synthesis and export of an uncharacterized polysaccharide (19). The pel locus was identified in a transposon mutagenesis screen for loss of pellicle formation, a biofilm formed at the air-liquid interface of a static liquid culture (20). The loss of biofilm formation is specifically attributed to the capability of Pel to initiate and maintain cell-cell interactions (12). The polysaccharide synthesis locus (psl) contains 12 genes, 11 of which are necessary for synthesis and export of the Psl polysaccharide (7). Recently, the structure of Psl was identified as repeating units of a neutral, branched pentasaccharide consisting of D-glucose, D-mannose and L-rhamnose monosaccharides (7).
Depending on the strain studied, the role of Pel and Psl in biofilm formation can vary drastically (22, 66). For example, the two most commonly studied non-mucoid laboratory strains, PAO1 and PA14, differ in the primary polysaccharide used to maintain biofilm structure (12). PAO1 relies primarily on Psl, while Pel production is required for mature biofilm development in PA14 (12, 22, 66). Collectively, these studies suggest that Pel and Psl are each capable of functioning as a structural scaffold involved in maintaining biofilm integrity.
Regulation of Pel and Psl expression is complex, with multiple levels of intricate control. Recent studies have demonstrated multiple pathways of transcriptional control for both pel and psl. FleQ represses transcription of the pel and psl operons. This repression is relieved in the presence of the intracellular signaling molecule c-di-GMP (30). RpoS acts as a positive transcriptional regulator of psl gene expression and quorum sensing has been suggested to positively regulate pel and psl expression as well (23, 34, 52). Another regulatory system controlling pel and psl gene expression is the Gac-Rsm signal transduction pathway (24, 62). Translation of psl is inhibited by the RNA binding protein, RsmA (34). Finally, c-di-GMP can act as a positive allosteric regulator of Pel synthesis through PelD binding (40).
Rugose small colony variants (RSCVs) of P. aeruginosa have been isolated from CF sputum and in vitro biofilm reactors (3, 56). RSCVs are characterized by hyperadherence and hyperaggregation that result from elevated expression of Pel and Psl (16, 34, 57). In addition, c-di-GMP signaling is linked to the RSCV phenotype (57). To date, the RSCVs described in P. aeruginosa all have elevated levels of c-di-GMP, and depletion of c-di-GMP suppresses the RSCV phenotype (30, 34, 57, 60). One common genetic route to the RSCV phenotype is a mutation in the wspF gene (56, 57). This mutation activates the diguanylate cyclase WspR and results in elevated c-di-GMP, which in turn results in the RSCV phenotype (30).
In this study, we evaluated a range of clinical and environmental P. aeruginosa isolates for their dependence on the Pel and Psl polysaccharides for biofilm development. Mutational analysis demonstrates that for most strains Psl plays an important role in surface attachment. However, there was significant strain-to-strain variability in the contribution of Pel and Psl to mature biofilm structure. Our study led us to propose four classes of strains based upon their dependence for and expression patterns of Pel and Psl. These data demonstrate that the relative importance of Pel and Psl is highly variable. We conclude that both Pel and Psl can each serve as the primary biofilm matrix polysaccharide, while only Psl is an important surface attachment determinant. To examine the significance of producing two exopolysaccharides, we performed biofilm evolution experiments and discovered in the absence of the one structural polysaccharide, the evolved biofilm population selects for the up-regulation of a secondary structural polysaccharide.
Results
P. aeruginosa can use either Psl or Pel as the primary biofilm matrix polysaccharide
Two common laboratory strains, PAO1 and PA14, differ in the primary polysaccharide used as a structural scaffold for the biofilm (12). PAO1 primarily uses Psl, while PA14, which has a three-gene deletion in the psl operon, uses Pel (12, 39). For the purpose of this study, we validated this observation using two distinct biofilm culturing formats. The first being a microtiter dish assay which measures biofilm biomass that forms at the air-liquid interface after static incubation. The second method utilizes confocal laser scanning microscopy (CLSM) to visually monitor live biofilms growing in dilute medium under conditions of continuous flow using a flow-cell reactor.
PAO1 and PA14 and their corresponding pel, psl, and pelpsl mutant strains were compared for initial attachment and biofilm formation in the microtiter dish assay (Figure 1A and 1B). A pel mutation did not have a surface attachment phenotype in either PAO1 or PA14 backgrounds. As expected, a PAO1 psl mutant strain was completely deficient in attachment.
Figure 1. PAO1 and PA14 attachment and biofilm analysis.
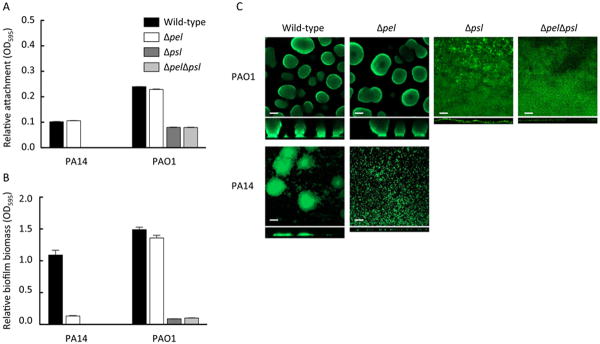
The effect of pel and psl mutations in static microtiter dish assays and flow cell experiments were analyzed. Attachment after 1 h of incubation (A) and biofilm formation after 24 h of incubation (B) were assessed by crystal violet staining for PAO1 and PA14 and the corresponding mutants. Flow cell images were acquired after 5 d of growth. Representative top down and side view CLSM images are shown using 20× objective (C). Scale bars represent 50 μm. Error bars represent standard deviation.
Unlike surface attachment, Pel had a significant impact on later stages of biofilm development, but this result was strain dependent (Figure 1B). A PA14 pel mutant strain produced a substantially reduced level of biofilm biomass compared to PA14, while a PAO1 pel biofilm was indistinguishable from PAO1. In contrast, the PAO1 psl and a PAO1 pelpsl double mutant strain were impaired for biofilm formation. Similar to the microtiter dish assays, flow-cell grown PAO1 biofilms were dependent on Psl and PA14 biofilms on Pel (Figure 1C). PA14 pel, PAO1 psl and PAO1 pelpsl strains are arrested at the monolayer stage of biofilm development, showing an absence of microcolony growth and relatively reduced biomass compared to the parent strain. These data confirm previous observations and serve as a reference for the subsequent analysis of environmental and clinical isolates.
Pel and Psl utilization is variable among clinical and environmental isolates for biofilm development
The data presented in Figure 1 raise the question as to whether PAO1 or PA14 is generally representative of P. aeruginosa in terms of matrix polysaccharide dependence. To address this question, we examined a variety of clinical and environmental isolates for their dependency on Pel and Psl. The strain collection consisted of 20 isolates, including four environmental and sixteen isolates from diverse human infections (Table S1). The colony morphologies of these isolates, a phenotype that is linked to exopolysaccharide production (1, 8, 57, 67), was highly variable (Figure S1).
In-frame deletions of pelF and pslD were generated using standard allelic replacement strategies. These mutations have previously been shown to eliminate Pel and Psl production, respectively (7, 61). Due to some strains having intrinsic antibiotic resistance, mutagenesis intractability or other unknown factors, only 10 of the isolates were successfully mutated. These strains were tested for growth on laboratory medium and found to have comparable growth rates (Figure S2).
We first tested the ability of these strains to attach to plastic surfaces in a microtiter dish assay. In all the strains tested, a psl mutation impaired attachment (Figure 2A, B and C). Additionally, pel mutations did not have an attachment phenotype in any tested strain. Three strains, all of which were weakly adherent, still demonstrated reduced attachment in a psl mutant (Figure 2B). Two of the strains, CF127 and 19660, showed a slight effect of Pel on attachment, but only in the absence of Psl (Figure 2C). Collectively, these results emphasize the importance of Psl as a surface attachment determinant.
Figure 2. Relative attachment of the isolates to a microtiter plate.

The effect of pel and psl mutations in static microtiter dish assays for attachment was analyzed. Strains were incubated statically for 1 h, loosely adherent material was removed through washing and the remaining biomass was stained by crystal violet. Mutants were separated based on class categorization, “Psl-dominant strains” (A), “EPS redundant matrix users” (B) and “matrix over-producers” (C). The rationale is described in the text. Error bars represent standard deviation.
Overall, we found that the strains were variable in their ability to produce biofilms in microtiter dishes. One strain, CF127, was a hyper-biofilm forming strain, producing 3-4 fold more biofilm biomass than the other strains (Figure 3). For five isolates, a psl mutation severely impaired biofilm formation, in a manner very similar to PAO1. In these strains, a pel mutation did not have a phenotype (Figure 3A). For three isolates, single pel or psl mutations had little effect (Figure 3B). Two isolates, CF127 and 19660, showed small but consistent reduced biofilm biomass for single pel and psl mutations (Figure 3C). All pelpsl double mutant strains were completely deficient for biofilm formation (Figure 3).
Figure 3. Relative biofilm formation of the isolates to a microtiter plate.

The effect of pel and psl mutations in static microtiter dish assays for biofilm formation was analyzed. Strains were incubated statically for 24 h, loosely adherent material was removed through washing and the remaining biomass was stained by crystal violet. Mutants were separated based on class categorization, “Psl-dominant strains” (A), “EPS redundant matrix users” (B) and “matrix over-producers” (C). The rationale is described in the text. Error bars represent standard deviation.
We took a complementary approach using flow-cell bioreactors to evaluate biofilm formation for a few representative strains: E2, S54485, CF127, 19660 and MSH3 (Figure 4). E2 formed a thick rough biofilm devoid of any cell aggregate structures. The E2 pel mutant strain looked identical to wild-type, while the psl and pelpsl mutants contained only a few attached cells to the glass surface. These data correlated to our microtiter dish biofilm analysis (Figure 3A). S54485 is similar to E2. Wild-type and the pel mutant formed thick, uniform biofilms. The psl mutant formed small aggregates of cells that were not present in the double mutant. MSH3 is capable of forming large mature cell aggregate structures, similar to PAO1 (Figure 4). In contrast to PAO1 pel, MSH3 pel biofilms produced immature structures that are significantly reduced in size, suggesting that Pel production can contribute to biofilm structure for this strain under these culturing conditions. MSH3 psl and MSH3 pelpsl mutants strains both fail to form cellular aggregates and produce a monolayer of cells on the glass surface. Strain 19660 and 19660 pel produced biofilms characterized by densely packed cell aggregates. In stark contrast to the microtiter dish assay data, the 19660 psl mutant produced biofilms with more biomass and fewer cell aggregates than wild-type (Figure 4). We hypothesize this is partially due to an attachment defect in this strain (Figure S3A). The discrepancy between the 19660 psl strain microtiter dish assay and flow-cell data (Figure 3B verse Figure 4) can be explained by the fragile nature of the biofilms produced by this strain. The microtiter dish assay has a vigorous wash step, which removed what appeared to be adherent biomass. When a gentle wash is performed, the psl mutant has similar biomass to wild-type (Figure S3B). CF127 forms a thick structured biofilm with a high degree of surface roughness. Both pel and psl single mutants display similar rough, structured biofilms, slightly reduced in height (Figure 4). Although impaired, the CF127 pelpsl strain is not completely deficient for biofilm formation. Though, as expected, the biofilm biomass is significantly reduced from the parent and single mutant strains.
Figure 4. Flow cell analysis of select isolates.

Flow cell images of PA14, PAO1, E2, S54485, MSH3, CF127, 19660 and their corresponding mutants were acquired after 5 d of growth. Representative top down and side view CLSM images are shown using 20× objective. Scale bars represent 50 μm.
Determining the effects of pel and psl mutations on colony morphology
Strains were grown on solid medium for 5 d at 25°C. Nearly all pel, psl single mutants and pelpsl double mutants displayed identical colony morphology to the wild-type strain (Figure 5). An exception to this was seen for two strains, 19660 and CF127. Both strains display a wrinkly colony morphology that is converted to a smooth colony in a pelpsl double mutant strain. It should be noted that the colony texture appearance between CF127 and 19660 is strikingly different (Figure 5 and S1). CF127 and 19660 colony morphologies are similar to the previously described rugose small colony variants (RSCVs) (16, 34, 57). We were surprised to see very little change in Congo red binding between CF127 and mutant strains. In particular, we were surprised that CF127 did not hyperbind the dye as previously reported for other RSCVs (57).
Figure 5. Colony morphology of pel and psl mutants.

The colony morphology of 5 μl spots was compared for the parent strain, pel and psl single mutants and pel/psl double mutant. Images were acquired after 5 d of growth at 25°C.
Strain classification based upon Pel and Psl-dependent phenotypes
Our colony morphology and biofilm phenotypes suggest that the strains can be classified into four different classes. The first class, or Class I, is a “Pel-dominant matrix” (Figure 6). Our only current representative of this class is PA14. Class II is a “Psl-dominant matrix”. “Psl-dominant matrix” strains, like PAO1, relied primarily on Psl for biofilm formation. Representatives of this class includes SS4485, X13273, E2, 62, and X24509. Class III we have termed “EPS redundant matrix users”. These are poor attaching strains, similar to PA14. Here mutations in both pel and psl are necessary to eliminate the ability of these strains to produce a biofilm in the microtiter dish assay; single pel and psl mutations do not affect biofilm formation. MSH3, MSH10, and T56593 are class III strains. Finally we propose class IV, which we term “matrix over-producers”. Class IV strains include CF127 and 19660. For “matrix over-producers” Pel and Psl are both important for attachment. Similarly, both single pel and psl mutants are partially impaired for mature biofilm formation. In CF127, pel and psl mutant strains are equally impaired for biofilm formation but are still capable of producing significant amounts of adhered biomass. While in strain 19660, a psl mutant is much more compromised than a pel mutant, but is not as impaired as the double mutant. This suggests both polysaccharides contribute additively to biofilm formation. Additionally, matrix overproducers are the only class where pel or psl mutations impact colony morphology (Figure 5). It should be noted that not all isolates fall cleanly into a single class based upon their phenotypes.
Figure 6. Representative phenotypes for class categorization.

One strain from each class is chosen as a representative class isolate. The effect of pel, psl and pelpsl mutations in static microtiter dish assays and colony morphology are shown. The top panel is relative attachment, middle panel is relative biofilm formation in a microtiter assay and bottom panel shows colony morphology for wild-type and pelpsl mutant.
PelC protein and Psl polysaccharide expression levels correlate with biofilm phenotypes and strain class designations
We reasoned that the observed attachment and biofilm phenotypes (Figures 2 and 3) are related to Pel and Psl expression levels. To explore this possibility, we measured the isolates relative PelC protein and Psl expression levels. Psl levels were measured semi-quantitatively using Psl-specific antiserum (7). Since reagents are not available for evaluating Pel directly, we used antiserum against one of the proteins necessary for its synthesis, PelC. We have generally found that elevated PelC protein levels track well with Pel-dependent phenotypes (Data not shown and (12)). To confirm the specificity of the Psl antibody, we evaluated strains with expected reactivity results. All psl mutant strains showed reduced reactivity (Figure S4).
The first condition we tested approximated the initial planktonic attachment conditions for the microtiter dish assay data presented in Figure 2. In PA14, as expected, PelC is expressed but Psl polysaccharide is not detected. PAO1 expressed Psl to a high degree while PelC protein expression is reduced compared to PA14 (Figure 7A). Both of these strains have expression profiles that correspond to their reliance on the different polysaccharides for biofilm production. In general “Psl-dominant” (Class II) strains produce an intermediate level of Psl and low PelC protein expression. The class III “EPS redundant matrix users” expresses both PelC and Psl at low levels. “Matrix over-producers” (Class IV), 19660 and CF127, both show elevated PelC protein and Psl polysaccharide levels. These data also suggest that Psl expression correlates to initial attachment. Strains that produce little Psl: PA14, X24509, MSH3, MSH10 and T56593 show reduced initial attachment (Figure 1 and Figure 2).
Figure 7. PelC protein, Psl polysaccharide and pelA and pslA transcript level analysis.

Psl polysaccharide dot blot (top panel), PelC protein (middle panel) and RNA polymerase protein loading control (bottom panel) were analyzed for the different isolates. Polysaccharide and protein profiles were assessed for microtiter dish attachment conditions (A) or from plate grown cultures at 25 °C for 3 d (B). qRT-PCR on pelA, pslA and rpsL transcripts were performed from the same culture conditions as analyzed for protein and polysaccharide expression level in part B (C). pelA and pslA transcripts are normalized to rpsL and then to PAO1 for relative transcript level. Error bars indicate standard deviation from three independent experiments.
Expression profiles were also analyzed from strains grown to closer approximate microtiter dish biofilm culturing conditions (Figure 7B). As expected, PA14 produced PelC at a high level, while PAO1 produced high levels of Psl. “Psl-dominant” strains (Class II) produced Psl at an intermediate to high level and PelC at an intermediate level. Class III strains had slightly elevated PelC protein expression but low levels of Psl. Class IV “Matrix over-producers” still displayed elevated expression levels of PelC and Psl. We also analyzed PelC and Psl levels for all of our original strains grown in these conditions (Figure S5A). Of the 10 strains for which we had no mutational data (designated “not classified” in Figure S5A), all appeared to produce Pel and Psl to some degree.
pelA and pslA transcript levels do not correlate to PelC and Psl expression levels
We hypothesized that variations in polysaccharide expression levels could be due to transcriptional differences. Therefore, we measured pelA and pslA mRNA levels using qRT-PCR (Figure 7C and Figure S5B). In almost all strains, the relative transcript level was similar to PAO1. One exception was CF127, which exhibited pelA transcript levels 40-fold higher than PAO1 (Figure 7C). Differences in pelA and pslA transcript levels did not always translate to similar changes in PelC or Psl expression (Figure 7 and Figure S5). For example, E2's pslA transcript was 3-fold higher compared to PAO1, but Psl polysaccharide levels appeared to be lower (Figure 7).
Despite the relatively small differences detected in pelA and pslA transcription between strains, we investigated the possibility that variations in polysaccharide expression levels could be explained by DNA sequence differences in regulatory control regions upstream of the pel and psl operons. We sequenced the upstream intergenic regions of pel and psl for each strain (Figure S6 and Figure S7). PA14 has an intergenic region of 562 bp between the ATG of pelA and the translational stop of the upstream ORF, gdhB (Figure S8). In contrast, PAO1 has a three-gene operon (PA3065-PA3067) inserted 484 bp upstream of the pelA translational start site (Figure S8). This operon is missing in PA14. Members from each of the other three polysaccharide classes were found to have this insertion. The first 200 bp upstream of the pelA translational start site was highly conserved (Figure S6). Similarly, the intergenic region upstream of pslA (525 bp) was strongly conserved (Figure S7). Only one nucleotide change was seen for all 20 isolates, strain 62, within 200 bp of the translational start site, including the RsmA binding sequences.
C-di-GMP levels track with PelC expression
C-di-GMP levels control pel and psl transcription and allosterically regulate Pel biosynthesis (24, 31, 60). We hypothesized that our protein and polysaccharide expression results (Figure 7B) could be explained by strain-to-strain differences in intracellular c-di-GMP concentrations. The intracellular concentration of c-di-GMP was measured from a select number of strains grown 3 d on agar media at 25°C (Figure 8). Intracellular c-di-GMP levels appeared to track well with PelC protein expression and less so with Psl polysaccharide expression. As expected, the RSCV, CF127, had elevated c-di-GMP levels. Interestingly, both PAO1 and 19660 displayed high Psl expression with relatively low c-di-GMP levels. Overall, c-di-GMP proved to be a poor indicator of Psl.
Figure 8. Intracellular c-di-GMP concentrations are quantified for the isolates.
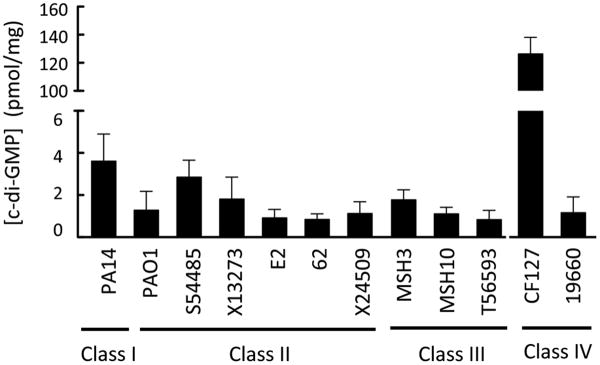
Total intracellular c-di-GMP was extracted and measured by LC/MS/MS from plate grown cultures at 25 °C for 3 d. c-di-GMP concentrations were quantified from three individual experiments. C-di-GMP concentrations are normalized to mg of total protein. Error bars represent standard deviation.
Pel and Psl redundancy can rescue biofilm formation in mutant strains
We hypothesized that one advantage for strains to maintain two distinct EPS biosynthetic loci such as pel and psl would be for redundancy. This would minimize the impact of a mutation on a critical function such as biofilm formation. In the case of PAO1, Psl is the primary biofilm polysaccharide. Since PAO1 can produce Pel (12, 34, 66), we reasoned that during biofilm growth, a PAO1 psl mutant strain may acquire mutations that up-regulate Pel production to compensate for the loss of Psl.
To test this, we compared PAO1 and PAO1 psl for PelC expression before and after extended biofilm growth. As expected, the mutant strain was initially impaired for biofilm growth. After extended culturing, a biofilm was visible and upon harvesting the adherent biofilm biomass, we observed an increase in PelC protein levels in both PAO1 and PAO1 psl compared to the starting planktonic inoculum (Figure 9A). This supports previous data showing that biofilm cells exhibit elevated pelA transcription and PelF protein levels compared to planktonic populations (12). Interestingly, the PAO1 psl biofilm displayed PelC protein levels 3-fold higher than PAO1 (Figure 9B). When we plated the biofilm biomass onto solid medium, we noticed a high frequency of the RSCV phenotype in the biomass harvested from PAO1 psl biofilm (Figure 9C). The RSCVs are approximated half of the total population for PAO1 psl after 3 d of biofilm growth, while they account for only five percent of the total PAO1 population (Figure 9D).
Figure 9. PelC expression is up-regulated in PAO1Δpsl during biofilm growth.

PAO1 and PAO1Δpsl were compared for PelC expression level in planktonic and biofilm grown cells. Protein levels were isolated from the log phase cultures used for the initial inoculum and adhered biomass after 3 d of continuous flow within a tube bioreactor (A). Relative expression levels were quantified using densitometry analysis (B). Representative images of colony morphology of the initial inoculum and post biofilm growth are shown (C). Arrows are pointing toward RSCV morphotypes. The number of RSCVs in each population was quantified from three separate experiments (D). RNAP is a loading control. Error bars represent standard deviation.
RSCVs have elevated c-di-GMP levels and Pel and Psl expression levels (16, 31, 34). In a PAO1 psl mutant, elevated c-di-GMP still results in the RSCV phenotype. Individual smooth and RSCV colonies isolated from the biofilm were then tested for PelC expression. As expected, strains displaying the RSCV phenotype had elevated levels of PelC protein expression compared to the parental inoculum and elevated intracellular levels of c-di-GMP (Figure 10). Interestingly, the representative smooth isolate from PAO1 psl biofilm also displayed elevated levels of c-di-GMP compared to the parent strain (Figure 10B). Laboratory derived RSCVs commonly result from mutations in the wspF gene (57). To determine if the RSCVs isolated were wspF mutants, we attempted complementation with pWspF (Figure S9A). The PAO1 RSCV was partially complemented by WspF. The colony morphology was smooth but remained small in size. In contrast, each PAO1 psl RSCV was fully complemented by WspF (Figure S9A). We then sequenced the wspF gene for each isolate (Figure S9B). The PAO1 RSCV has a 201 bp gene deletion including 164 bp of the C-terminus of wspF and 36 bp in the intergenic region between wspF and wspR. In the PAO1 psl RSCVs, single base pair insertions were identified producing a frameshift in the ORF.
Figure 10. Biofilm-derived RSCVs over-express PelC and have increased c-di-GMP levels.

Representative smooth and RSCV isolates were selected after 3 d of continuous flow within a tube bioreactor for PAO1 and the psl mutant. Isolates were streaked onto LB agar and allowed to grow for 1 d at 37°C. Images of colony morphology were acquired and relative PelC expression levels measured (A). Total intracellular c-di-GMP was extracted and measured by LC/MS/MS from plate grown cultures at 37°C for 1 d. c-di-GMP concentrations were quantified from three individual experiments (B). C-di-GMP concentrations are normalized to mg of total protein. RNAP is a loading control. Error bars represent standard deviation.
We next tested if biofilm growth increased PelC expression in other clinical and environmental class II isolates bearing psl mutations. Similar to PAO1, each psl mutant displayed higher PelC expression compared to the corresponding wild-type strain (Figure S10C). To see if RSCVs are selected for in the psl mutant background, we plated out the biofilm biomass (Figure S10A). For one strain, S54485, RSCVs were detected and their presence was increased in the psl mutant compared to the wild-type (Figure S10B). RSCVs were not clearly identified in E2 or X13273 and thus not quantified. Regardless of whether RSCVs were isolated or not, PelC expression was elevated in the psl mutant biofilms. These data suggest that a strain relying primarily on Psl can utilize Pel to rescue biofilm growth if faced with a deleterious psl mutation.
Discussion
Extracellular polysaccharides are a key component of the biofilm matrix. The ability to produce multiple types of polysaccharides appears to have been maintained in P. aeruginosa. Yet the two common laboratory strains, PAO1 and PA14, use two different polysaccharides as the major biofilm matrix polysaccharide. We sought to determine the relative prominence of Psl and Pel as the major matrix polysaccharide. In this study we propose four classes of matrix users based upon Pel and Psl dependent phenotypes. Finally, we demonstrated that elevated Pel expression can rescue biofilm formation for a Psl-utilizing strain. These data suggest that an advantage of having both Pel and Psl is to reduce the impact of deleterious mutations on an important function such as biofilm formation.
Psl played an important role in surface attachment for all the isolates tested (Figure 2). This suggests that Psl universally plays a critical role in attachment for more P. aeruginosa isolates. This is also not surprising, as many polysaccharides are involved in the attachment of various bacterial species to abiotic surfaces (like plastic and glass), plant, and mammalian surfaces (10, 38, 63). However, Pel did not appear to be an important attachment determinant. Only in strains producing a large amount of Pel (class IV) was an attachment phenotype observed for a pel mutant strain (Figure 2C).
Unlike surface attachment, the isolates exhibited a spectrum of Pel and Psl dependencies for biofilm formation. We classified Pel polysaccharide utilizing strains class I matrix producers. PA14 was the only strain we found to use Pel as the dominant matrix polysaccharide. An extensive analysis of multiple isolates would have to be performed to determine how widespread class I strains are in the community. However, we would predict that isolates bearing psl mutations would probably be class I strains. Some strains, like PAO1, primarily relied on Psl for biofilm formation. Our expression data at least confirm that these strains are capable of transcribing and expressing some of the Pel biosynthetic genes/proteins. Therefore, like PAO1, their reliance on Psl is not due to the inability to express the Pel enzymes, although we cannot rule out that these strains are unable to make the Pel polysaccharide itself. We called these strains class II matrix producers.
Class III strains we called EPS redundant matrix users. These strains produced relatively low amounts of PelC and Psl. Single mutations in either pel or psl did not have a phenotype for biofilm formation in the microtiter dish assay (Figure 3B), suggesting that both Pel and Psl are individually capable of ensuring normal biofilm development in this class. The one class III strain we examined in a flow cell, MSH3, showed reduced biomass for both pel and psl single mutations relative to the wild-type. This is different from the microtiter dish biofilm assay data, where single mutations have no phenotype. One explanation is that several factors can impact biofilm structure in the flow cell besides EPS production (e.g. relative surface motility) (54). Perhaps the longer culturing time (5 d verse 1 d) or a flowing compared to a static environment influenced biofilm resulted in the observed differences seen in the two systems. However, this data is consistent with the idea that both Pel and Psl are produced and are important in class III strain biofilms.
Finally, Class IV strains were matrix overproducers. These strains, CF127 and 19660, produced a robust biofilm, where single pel or psl mutations only slightly reduced biofilm biomass compared to the wild-type strain. This does not clearly appear to be the case for 19660, where in microtiter dish biofilms a psl mutation appeared to have a significant impact on biofilm formation (Figure 3C). However, analysis of the same strain in a flow cell (Figure 4) showed that it was capable of producing a significant biofilm. We speculated that our vigorous wash step removed most of the biofilm biomass in the 19660 psl mutant. By changing our microtiter wash conditions, we confirmed that the 19660 psl mutant formed significant, albeit fragile, biofilms (Figure S3). PelC and Psl expression studies showed that CF127 and 19660 strains produced both at high levels. Elevated polysaccharide expression in CF127 can be explained by high levels of intracellular c-di-GMP (Figure 8). However, this is not the case for 19660, suggesting that the underlying molecular mechanisms responsible for elevated matrix production are different in these two strains.
One might predict that the source of isolates would be a key predictor of which matrix class they belong to. However, polysaccharide dependence and the isolate source do not appear to be correlated, but a much larger number of strains would need to be tested in order to make any definite conclusions. Interestingly, phylogenetic analysis of P. aeruginosa strains demonstrate that strains from similar environmental or clinical sources are in general no more related than those from different sources (64). In addition, the functional significance of being placed in a given matrix class is not clear. It is reasonable to presume that each class exhibits functional differences. Pel and Psl are chemically distinct polysaccharides with unique properties that could influence function (7, 14, 20). For example, Psl has been specifically found to be important in surface adherence and biofilm initiation on glass, polyvinyl chloride (PVC), mucin, epithelial cells and human alveolar epithelial cells (6, 21, 41, 43). Not surprisingly, PA14, a class I isolate, was the poorest at surface attachment of tested strains (Figure 6). Pel production has also been linked to aminoglycoside tolerance in biofilms (12). This suggests that biofilms produced by class II isolates might be more sensitive to this class of antibiotic.
Our evolution experiments suggest that a mutation in the primary matrix polysaccharide (Psl) will select for adaptations promoting expression of the compensatory matrix polysaccharide (Pel) during biofilm growth (Figure 9). The molecular nature of the PAO1 psl RSCV strains demonstrates elevated c-di-GMP levels similar to previously described RSCVs (31, 57). In addition, we identified the mutations responsible for the conversion to an RSCV in the PAO1 psl strains to the gene wspF. Mutations in the gene wspF activate the diguanylate cyclase WspR increasing c-di-GMP levels and result in an RSCV (15, 16, 31, 38, 57). We also demonstrated that biofilm growth of Class II psl mutants universally selects for increased PelC expression as demonstrated in Figure S11. For some of the isolates, RSCVs are produced and as seen in PAO1, they are produced at a greater frequency in the psl mutant. However, the molecular mechanism of increased PelC expression in X13273 and E2 (which did not produce RSCVs) is not clear
There are different hypotheses (not mutually exclusive) as to why a species might retain the capability of producing multiple biofilm matrix polysaccharides. One hypothesis is that depending upon the environment, different polysaccharides might be employed as the primary matrix scaffold. P. aeruginosa is not unique in its ability to produce multiple different extracellular polysaccharides. Other organisms such as, Escherichia coli, Pseudomonas putida, Vibrio spp, Salmonella spp. and Burkholderia spp. also produce multiple polysaccharides, each of which contribute to biofilm formation (35). For example, Salmonella enterica serovar Typhimurium produces three known extracellular polysaccharides, colanic acid, cellulose and an O-antigen capsule (15). Interestingly, each polysaccharide has a niche-specific role in biofilm formation. For example, O-antigen capsule is critical to form a biofilm on gallstone surfaces but is not involved in glass or plastic binding (15). Colanic acid is important in biofilm formation on HEp-2 cells and chicken intestinal tissue but does not play a role in plastic surface or gallstone biofilm development (38). Finally, cellulose does not contribute to gallstone biofilm formation but does on HEp-2 cells, chicken intestinal epithelium and plastic surfaces (15, 38). Thus, P. aeruginosa might utilize Psl, Pel and alginate in a similar niche-specific manner.
Pseudomonas putida is another example capable of producing four unique polysaccharides, Pea, Peb, alginate and a cellulose-like polymer (Bcs) (9, 42, 44, 45). Recent studies demonstrate that Pea and Peb play important roles in P. putida biofilm stability, while alginate and Bcs appear to be minor contributors in laboratory grown biofilms (9, 42, 44, 45). Similar to P. aeruginosa, strains of P. putida can differentially depend on individual polysaccharides for biofilm development (9, 42, 44, 45). These polysaccharides also display unique attachment patterns. The cellulose-like polymer, but not Pea contributes to maize root colonization and neither is important in glass attachment (44). This set of work highlights that polysaccharides in the P. putida biofilm matrix have unique niche-colonization but display some redundant cell-cell adhesion functions.
Another hypothesis is that biofilm formation is such an important survival mechanism that maintaining the capability of producing redundant matrix polysaccharides would be an advantage. This is demonstrated in our biofilm evolution experiments. Such redundancy might be important for adverse environments, such as the CF airways, where strains arise that exhibit elevated rates of mutation (48). Redundancy of matrix polysaccharides might help reconcile high mutations rates with the maintenance of a key survival mechanism such as biofilm formation.
Experimental Procedures
Bacterial strains and growth conditions
Bacterial strains and primers in this study are listed in Table S1 (4, 7, 12, 17, 32, 33, 36, 37, 41, 50, 64). For routine culture, P. aeruginosa strains were grown at 37°C in Luria-Bertani (LB) medium (Difco). Plasmids were selected with 100 μg/ml gentamycin for P. aeruginosa strains and 10 μg/ml gentamycin for E. coli. 25 μg/ml irgasan was used to counter select for E. coli. For all assays comparing isolates, Tryptic Soy Broth (TSB) 30g/L and supplemented with 15g/L of bacto agar for plates (Difco).
Strain construction
ΔpelF
Allelic replacement strains were constructed by using an unmarked, nonpolar deletion strategy. Flanking regions of pelF were amplified using primers pelF UP and pelF DN primer sets. The resultant PCR product was ligated into the suicide vector, pEX18Gm, via HindIII restriction site. The plasmid pEX18GmΔpelF was verified by sequencing analysis. Single recombination mutants were selected on VBMM containing 100 μg/ml gentamicin or LB containing 100 μg/ml gentamicin and 25 μg/ml irgasan. Double recombination mutants were selected on LB without NaCl plates containing 5% sucrose and confirmed by PCR.
ΔpslD
Construction of ΔpslD strains was performed as described before (7).
Colony morphology
Overnight cultures were diluted 1/100 in PBS. 5 μl of cells were spotted onto TSB plates supplemented with 40 μg/ml Congo red and 15 μg/ml brilliant blue R (Sigma-Aldrich) and incubated at 25°C for 5d.
Microtiter dish biofilm
96-well microtiter dish assay was preformed as described previously with the following modifications (47). 100 μl of mid-log cells (OD600 ∼ 0.5) grown in TSB was added to the wells of a 96-well polypropelene plate (Nunc) and incubated statically for 1 h (rapid attachment) or 24 h (biofilm development) at 25°C. Following incubation, non-attached cells were removed and the plate was rinsed thoroughly with water. Plates were stained with 150 μl 0.1% crystal violet for 10 min. The plate was rinsed and adhered crystal violet was solubilized in 200 μl 95% ethanol for 10 min, then 100 μl was transferred to a new 96-well plate to measure the absorbance at OD595.
Flow cell experiments
PA14 monocultures were tagged with GFP on the chromosome using the mini Tn7 system to allow fluorescent visualization of growing biofilms (11). PAO1, E2, CF127, 19660 and MSH3 monoclutures were tagged with the GFP expression vector, pMRP9-1 (17). S54485 biofilms were stained with 1 ml of 5 μM FM4-64 for 10 m. Flow resumed and images captured after 15 m of washing. Log phase cultures grown in full-strength TSB were diluted to a final OD600 of 0.05 for PA14 and 0.01 for PAO1, E2, S54485, CF127, 19660 and MSH3 in 1% TSB. Bacteria were inoculated into an inverted flow cell and allowed to attach for one hour. Upon initiation of media flow, fresh media of 1% TSB was pumped at a constant rate (10 ml/h). Biofilms were grown at room temperature for 5 d. Biofilms were visualized by fluorescence using a Zeiss LSM 510 scanning confocal laser microscope and image series were compiled using Velocity software (Improvision).
Tube biofilm
Tube biofilms were conducted as previously described with the following modifications (53). P. aeruginosa was grown to log phase in TSB at 37°C shaking, diluted to an OD600 0.05 and 3 ml injected into a 30 cm long × 6.35 mm inner-diameter tube and incubated for 1 h. Biofilms were grown at 25°C in full-strength TSB medium at 10 ml/h flow rate for 72 h. The external portion of the tube was sterilized with ethanol and from each tube three 2 cm slices were extracted and placed in 2 ml PBS. Biomass was scraped from the inside of the tube, vortexed and analyzed for protein expression as described in the immunoblot analysis section. Colony morphology was assessed on LB medium with a dissecting microscope (Olympus SZX-ILLK100).
PelC purification and antibody production
The coding sequence for the mature PelC protein (residues 20-172) was amplified from P. aeruginosa PAO1 genomic DNA using gene-specific primers and cloned into the pET28a expression vector (Novagen) and the sequence verified. The expression vector was then transformed into E. coli BL21 (DE3) cells (Agilent) and subsequently grown in 1 L Luria-Bertani (LB) broth containing 50 μg/ml kanamycin at 37°C. Once the cells reached an OD600 of 0.6, protein expression was induced by the addition of 1 mM isopropyl-β-D-1-thiogalactopyranoside (IPTG) followed by incubation at 25°C for 18 h. The cell cultures were then pelleted by centrifugation and flash frozen for subsequent purification. Frozen cell pellets were thawed in 40 ml of cell lysis buffer (50 mM Tris-HCl pH 8.0, 300 mM NaCl, 1 SIGMAFAST protease inhibitor EDTA-free cocktail tablet (Sigma)) and lysed by homogenization using an Emulsiflex-C3 (Avestin, Inc.) at a pressure of 10000-15000 psi (three passes total). Following centrifugation of the insoluble cell lysate, PelC was purified over Ni-NTA agarose (QIAGEN) using a linear imidazole gradient (20 mM Tris-HCl pH 8.0, 300 mM NaCl, 20-250 mM imidazole) followed by size-exclusion chromatography (20 mM Tris-HCl pH 8.0, 150 mM NaCl) using a HiLoad 16/60 Superdex 200 column (GE Healthcare). Purified PelC protein was sent to Open Biosystems for polyclonal antisera production.
RNA purification and analysis
P. aeruginosa strains were grown in TSB shaking at 37°C for 8 h or on TSB plates for 3 d at 25°C. Total RNA was stabilized for purification using RNAprotect Bacterial Reagent and extracted using the RNeasy Mini Purification kit (QIAGEN). Briefly, approximately 109 CFU in RNAprotect were lysed using 5 mg/ml lysozyme and tip-sonication. Genomic DNA was removed with an on-column RNase-free DNase I treatment (QIAGEN) and the RNA eluted in 30 μl RNase-free water. Remaining genomic DNA was removed by a second off-column DNase I treatment (Promega). Following purity confirmation by PCR using rplU primers, cDNA was synthesized using the iScript cDNA synthesis kit (Bio-Rad) and verified by PCR. 84 μl of water was added to the cDNA samples to prevent interference of real-time PCR by reagents from the reverse transcription reaction. Quantitative real-time PCR was performed using the CFX96 Real-Time PCR Dectetion System (Bio-Rad). With iQ SYBR Green Supermix used according to manufacturer's instructions (Bio-rad). Primers are listed in Table S1. pelA, pslA and algD transcript levels are normalized to rpsL transcript levels.
Immunoblot analysis
1 ml of P. aeruginosa liquid culture grown in TSB for for 2.5 h to an OD600 ∼ 0.5 followed by 1 h static incubation at 25°C were harvested and resuspended in 500 μl PBS. Alternatively, cells were collected from TSB agar surfaces grown for 3 d at 25°C and resuspended in PBS. Alternatively, biomass was collected from tube biofilms grown for 3 d at 25°C. Biomass was resuspended in PBS. 50 μl sample was mixed with 50 μl 2× laemli buffer and boiled for five m. Protein concentration was measured using the Pierce 660 nm Protein Assay and Ionic Detergent Compatibility Reagent as described by the manufacturer (Thermo Scientific). Equal total protein was loaded onto a pre-cast 12.5% Tris-HCl polyacrylamide gel and transferred to a PVDF membrane for immunoblotting (Bio-rad). The membrane was blocked in 5% non-fat milk in TBST for 1 h at room temperature. The membrane was cut in half and either probed for RNA polymerase (RNAP, Neoclone Biotechnologies) according to manufacturers instructions or with α-PelC antibodies at 1:5,000 dilution in 1% non-fat milk TBST for 1 h. Blots were developed with goat α-rabbit HRP-conjugated secondary antibody (Thermo-Scientific) and Pierce detection kit.
Psl immunoblots were performed as described previously with the following modifications(7). Cells from each growth condition described above were harvested and resuspended in 100 μl 0.5 M EDTA. Cells were boiled for 20 min with periodic vortexing and centrifuged. The supernatant fraction was treated with Proteinase K (final concentration 0.5mg/ml) for 60 min at 60°C, followed by Proteinase K inactivation for 30 min at 80°C. Samples were stored at 4°C for immunoblotting. Polysaccharide preparations were normalized to total protein in the PBS resuspension as determined by Pierce 660 nm Protein Assay supplemented with the ionic detergent compatibility reagent (Thermo Scientific). 5 μl sample was spotted onto a nitrocellulose membrane and probed as described previously (7).
Promoter alignments
The pel promoter was amplified with either pel-Prom F/pel-Prom R1 or pel-Prom F/pel-Prom R2 primer pairs. The psl promoter was amplified with pslProm F/pslProm R. Sequencing was performed by GENEWIZ. Sequences were aligned using the multiple DNA sequence alignment feature in MacVector.
Nucleotide extraction and c-di-GMP measurements
P. aeruginosa strains were grown on TSB plates for 3 d at 25°C or 1 d at 37°C. Colonies were harvested using a plastic loop and quickly deposited into 1.1ml VBMM. With minimal re-suspension step, 990ml was immediately aspirated and added into 70% perchloric acid (Sigma) to a final concentration of 0.6M. 10ml of 10mM 2-chloro-AMP (internal standard compound) was added to the mixture, vortexed, and placed on ice. Each individual sample was prepared one at a time to minimise the time spent between harvesting cells and acid extraction, as bacteria rapidly alter intracellular nucleotide pools in response to changes in their growth environment (5). All subsequent extraction steps and LC/MS/MS measurements were performed as described in a forthcoming article (Irie Y et al, manuscript in preparation).
Supplementary Material
Images of colony morphology of 5 μl spots were acquired after 5 d of growth at 25°C. Colonies are arranged according to their isolation site.
Representative images of colony morphology of the initial inoculum and after 3 d of continuous growth in a tube bioreactor (biofilm growth) are shown (A). Arrows point toward RSCV morphotypes. The number of RSCVs in each population was quantified (B). PelC expression was measured from the adhered biomass of wild-type and psl mutants for E2, S54485 and X13273. RNAP is a loading control. Error bars indicate standard deviation.
Relative growth rate was monitored by OD600 from wild-type and pelpsl mutants grown at 37°C in shaking conditions.
Attachment to glass slides was visualized in a flow cell after one h of attachment and one h of continuous flow. Representative CSLM images are shown using a 40× objective of 19660, pel, psl and pelpsl (A). 19660 strains were compared for relative biomass after 24 h growth at 25°C in a microtiter dish biofilm assay using two different wash conditions (B). Rough washing is the typical method of washing by submerging the microtiter dish under water and rigorously dumping the liquid out. Gentle washing removes non-adhered biomass by gently pipetting the water washes. Error bars indicate standard deviation.
Psl polysaccharide dot blots were compared from strains grown overnight at 37°C. Wild-type and the corresponding psl mutant for PAO1, E2, S54485, CF127 and 19660 were compared for Psl expression levels. In addition PA14 and the arabinose inducible Psl strain, WFPA801 were also tested.
Strains were assessed for Psl and PelC expression (A) and pelA and pslA transcript levels (B) from plate grown cultures at 25 °C for 3 d. (A) Psl polysaccharide dot blot (top panel), PelC protein (middle panel) and RNA polymerase protein loading control (bottom panel) are shown for all isolates. One representative experiment is shown. (B) RNA profiles were assessed by qRT-PCR on pelA, pslA and rpsL transcripts. pelA and pslA transcripts are normalized to rpsL and then to PAO1 for relative transcript level. Error bars indicate standard deviation from three independent experiments.
All strains, except CF27, which did not amplify under either primer sets, were sequenced for the pel promoter region. The sequence was aligned beginning with the first base pair into the intergenic region (bp #1) followed by 596bp. The blue box indicates the stop codon for gdhB and the green box outlines the stop codon for PA3065. The conserved sequence is listed below the individual strain sequences. Regions that are shaded grey highlight areas that share the conserved sequence.
All strains, except PA14, which is missing the psl promoter, were sequenced for the psl promoter region. The sequence was aligned beginning with the first base pair into the intergenic region (bp #1) followed by 476bp. The transcriptional start site, −10, −35 and RsmA binding site are noted within the figure. The conserved sequence is listed below the individual strain sequences. Regions that are shaded grey highlight areas that share the conserved sequence.
The two different gene organizations found up-stream of pelA is represented for PAO1 (A) and PA14 (B). PAO1 has a three-gene insertion between pelA and gdhB. These genes are colored grey. The length of the intergenic region is specified.
RSCVs were complemented by supplying wspF in trans (pWspF). Colony morphologies are shown for both the vector control (VC) and pWspF (A). Each isolate was sequenced to determine the nature of the wspF mutation and described in the figure (B).
Acknowledgments
This work is supported by a research grants from NIH: R01 AI077628-01A1 and NSF: MCB0822405 to MRP; NIH: R01 AI061396 to DJW; and the Canadian Institutes of Health Research to PLH (CIHR # MT 43998). PLH is the recipient of a Canada Research Chair. JCW has been supported by graduate scholarships from the Natural Sciences and Engineering Research Council of Canada, the Canadian Cystic Fibrosis Foundation, the Ontario Graduate Scholarship Program, the Ontario Student Opportunities Trust Fund and The Hospital for Sick Children Foundation Student Scholarship Program.
References
- 1.Anriany YA, Weiner RM, Johnson JA, De Rezende CE, Joseph SW. Salmonella enterica serovar Typhimurium DT104 displays a rugose phenotype. Appl Environ Microbiol. 2001;67:4048–56. doi: 10.1128/AEM.67.9.4048-4056.2001. [DOI] [PMC free article] [PubMed] [Google Scholar]
- 2.Bodey GP, Bolivar R, Fainstein V, Jadeja L. Infections caused by Pseudomonas aeruginosa. Rev Infect Dis. 1983;5:279–313. doi: 10.1093/clinids/5.2.279. [DOI] [PubMed] [Google Scholar]
- 3.Boles BR, Singh PK. Endogenous oxidative stress produces diversity and adaptability in biofilm communities. Proc Natl Acad Sci U S A. 2008;105:12503–8. doi: 10.1073/pnas.0801499105. [DOI] [PMC free article] [PubMed] [Google Scholar]
- 4.Borlee BR, Goldman AD, Murakami K, Samudrala R, Wozniak DJ, Parsek MR. Pseudomonas aeruginosa uses a cyclic-di-GMP-regulated adhesin to reinforce the biofilm extracellular matrix. Mol Microbiol. 2010;75:827–42. doi: 10.1111/j.1365-2958.2009.06991.x. [DOI] [PMC free article] [PubMed] [Google Scholar]
- 5.Buckstein MH, He J, Rubin H. Characterization of nucleotide pools as a function of physiological state in Escherichia coli. J Bacteriol. 2008;190:718–26. doi: 10.1128/JB.01020-07. [DOI] [PMC free article] [PubMed] [Google Scholar]
- 6.Byrd MS, Pang B, Mishra M, Swords WE, Wozniak DJ. The Pseudomonas aeruginosa Exopolysaccharide Psl Facilitates Surface Adherence and NF-kappaB Activation in A549 Cells. MBio. 2010;1 doi: 10.1128/mBio.00140-10. [DOI] [PMC free article] [PubMed] [Google Scholar]
- 7.Byrd MS, Sadovskaya I, Vinogradov E, Lu H, Sprinkle AB, Richardson SH, Ma L, Ralston B, Parsek MR, Anderson EM, Lam JS, Wozniak JD. Genetic and biochemical analyses of the Pseudomonas aeruginosa Psl exopolysaccharide reveal overlapping roles for polysaccharide synthesis enzymes in Psl and LPS production. Mol Microbiol. 2009;73:622–38. doi: 10.1111/j.1365-2958.2009.06795.x. [DOI] [PMC free article] [PubMed] [Google Scholar]
- 8.Chandler JR, Duerkop BA, Hinz A, West TE, Herman JP, Churchill ME, Skerrett SJ, Greenberg EP. Mutational analysis of Burkholderia thailandensis quorum sensing and self-aggregation. J Bacteriol. 2009;191:5901–9. doi: 10.1128/JB.00591-09. [DOI] [PMC free article] [PubMed] [Google Scholar]
- 9.Chang WS, van de Mortel M, Nielsen L, Nino de Guzman G, Li X, Halverson LJ. Alginate production by Pseudomonas putida creates a hydrated microenvironment and contributes to biofilm architecture and stress tolerance under water-limiting conditions. J Bacteriol. 2007;189:8290–9. doi: 10.1128/JB.00727-07. [DOI] [PMC free article] [PubMed] [Google Scholar]
- 10.Cheng HP, Walker GC. Succinoglycan is required for initiation and elongation of infection threads during nodulation of alfalfa by Rhizobium meliloti. J Bacteriol. 1998;180:5183–91. doi: 10.1128/jb.180.19.5183-5191.1998. [DOI] [PMC free article] [PubMed] [Google Scholar]
- 11.Choi KH, Schweizer HP. mini-Tn7 insertion in bacteria with single attTn7 sites: example Pseudomonas aeruginosa. Nat Protoc. 2006;1:153–61. doi: 10.1038/nprot.2006.24. [DOI] [PubMed] [Google Scholar]
- 12.Colvin KM, Gordon VD, Murakami K, Borlee BR, Wozniak DJ, Wong GC, Parsek MR. The pel polysaccharide can serve a structural and protective role in the biofilm matrix of Pseudomonas aeruginosa. PLoS Pathog. 2011;7:e1001264. doi: 10.1371/journal.ppat.1001264. [DOI] [PMC free article] [PubMed] [Google Scholar]
- 13.Costerton JW, Stewart PS, Greenberg EP. Bacterial biofilms: a common cause of persistent infections. Science. 1999;284:1318–22. doi: 10.1126/science.284.5418.1318. [DOI] [PubMed] [Google Scholar]
- 14.Coulon C, Vinogradov E, Filloux A, Sadovskaya I. Chemical analysis of cellular and extracellular carbohydrates of a biofilm-forming strain Pseudomonas aeruginosa PA14. PLoS One. 2010;5:e14220. doi: 10.1371/journal.pone.0014220. [DOI] [PMC free article] [PubMed] [Google Scholar]
- 15.Crawford RW, Gibson DL, Kay WW, Gunn JS. Identification of a bile-induced exopolysaccharide required for Salmonella biofilm formation on gallstone surfaces. Infect Immun. 2008;76:5341–9. doi: 10.1128/IAI.00786-08. [DOI] [PMC free article] [PubMed] [Google Scholar]
- 16.D'Argenio DA, Calfee MW, Rainey PB, Pesci EC. Autolysis and autoaggregation in Pseudomonas aeruginosa colony morphology mutants. J Bacteriol. 2002;184:6481–9. doi: 10.1128/JB.184.23.6481-6489.2002. [DOI] [PMC free article] [PubMed] [Google Scholar]
- 17.Davies DG, Parsek MR, Pearson JP, Iglewski BH, Costerton JW, Greenberg EP. The involvement of cell-to-cell signals in the development of a bacterial biofilm. Science. 1998;280:295–8. doi: 10.1126/science.280.5361.295. [DOI] [PubMed] [Google Scholar]
- 18.Drenkard E. Antimicrobial resistance of Pseudomonas aeruginosa biofilms. Microbes Infect. 2003;5:1213–9. doi: 10.1016/j.micinf.2003.08.009. [DOI] [PubMed] [Google Scholar]
- 19.Franklin MJ, Nivens DE, Weadge JT, Howell PL. Biosynthesis of the Pseudomonas aeruginosa Extracellular Polysaccharides, Alginate, Pel, and Psl. Front Microbiol. 2011;2:167. doi: 10.3389/fmicb.2011.00167. [DOI] [PMC free article] [PubMed] [Google Scholar]
- 20.Friedman L, Kolter R. Genes involved in matrix formation in Pseudomonas aeruginosa PA14 biofilms. Mol Microbiol. 2004;51:675–90. doi: 10.1046/j.1365-2958.2003.03877.x. [DOI] [PubMed] [Google Scholar]
- 21.Friedman L, Kolter R. Two genetic loci produce distinct carbohydrate-rich structural components of the Pseudomonas aeruginosa biofilm matrix. J Bacteriol. 2004;186:4457–65. doi: 10.1128/JB.186.14.4457-4465.2004. [DOI] [PMC free article] [PubMed] [Google Scholar]
- 22.Ghafoor A, Hay ID, Rehm BH. The role of exopolysaccharides in Pseudomonas aeruginosa biofilm formation and architecture. Appl Environ Microbiol. 2011 doi: 10.1128/AEM.00637-11. [DOI] [PMC free article] [PubMed] [Google Scholar]
- 23.Gilbert KB, Kim TH, Gupta R, Greenberg EP, Schuster M. Global position analysis of the Pseudomonas aeruginosa quorum-sensing transcription factor LasR. Mol Microbiol. 2009;73:1072–85. doi: 10.1111/j.1365-2958.2009.06832.x. [DOI] [PMC free article] [PubMed] [Google Scholar]
- 24.Goodman AL, Kulasekara B, Rietsch A, Boyd D, Smith RS, Lory S. A signaling network reciprocally regulates genes associated with acute infection and chronic persistence in Pseudomonas aeruginosa. Dev Cell. 2004;7:745–54. doi: 10.1016/j.devcel.2004.08.020. [DOI] [PubMed] [Google Scholar]
- 25.Govan JR, Deretic V. Microbial pathogenesis in cystic fibrosis: mucoid Pseudomonas aeruginosa and Burkholderia cepacia. Microbiol Rev. 1996;60:539–74. doi: 10.1128/mr.60.3.539-574.1996. [DOI] [PMC free article] [PubMed] [Google Scholar]
- 26.Hardalo C, Edberg SC. Pseudomonas aeruginosa: assessment of risk from drinking water. Crit Rev Microbiol. 1997;23:47–75. doi: 10.3109/10408419709115130. [DOI] [PubMed] [Google Scholar]
- 27.Harrison JJ, Ceri H, Stremick CA, Turner RJ. Biofilm susceptibility to metal toxicity. Environ Microbiol. 2004;6:1220–7. doi: 10.1111/j.1462-2920.2004.00656.x. [DOI] [PubMed] [Google Scholar]
- 28.Haussler S, Parsek MR. Biofilms 2009: new perspectives at the heart of surface-associated microbial communities. J Bacteriol. 2010;192:2941–9. doi: 10.1128/JB.00332-10. [DOI] [PMC free article] [PubMed] [Google Scholar]
- 29.Hentzer M, Teitzel GM, Balzer GJ, Heydorn A, Molin S, Givskov M, Parsek MR. Alginate overproduction affects Pseudomonas aeruginosa biofilm structure and function. J Bacteriol. 2001;183:5395–401. doi: 10.1128/JB.183.18.5395-5401.2001. [DOI] [PMC free article] [PubMed] [Google Scholar]
- 30.Hickman JW, Harwood CS. Identification of FleQ from Pseudomonas aeruginosa as a c-di-GMP-responsive transcription factor. Mol Microbiol. 2008;69:376–89. doi: 10.1111/j.1365-2958.2008.06281.x. [DOI] [PMC free article] [PubMed] [Google Scholar]
- 31.Hickman JW, Tifrea DF, Harwood CS. A chemosensory system that regulates biofilm formation through modulation of cyclic diguanylate levels. Proc Natl Acad Sci U S A. 2005;102:14422–7. doi: 10.1073/pnas.0507170102. [DOI] [PMC free article] [PubMed] [Google Scholar]
- 32.Hoang TT, Karkhoff-Schweizer RR, Kutchma AJ, Schweizer HP. A broad-host-range Flp-FRT recombination system for site-specific excision of chromosomally-located DNA sequences: application for isolation of unmarked Pseudomonas aeruginosa mutants. Gene. 1998;212:77–86. doi: 10.1016/s0378-1119(98)00130-9. [DOI] [PubMed] [Google Scholar]
- 33.Holloway BW. Genetic recombination in Pseudomonas aeruginosa. J Gen Microbiol. 1955;13:572–81. doi: 10.1099/00221287-13-3-572. [DOI] [PubMed] [Google Scholar]
- 34.Irie Y, Starkey M, Edwards AN, Wozniak DJ, Romeo T, Parsek MR. Pseudomonas aeruginosa biofilm matrix polysaccharide Psl is regulated transcriptionally by RpoS and post-transcriptionally by RsmA. Mol Microbiol. 2010;78:158–72. doi: 10.1111/j.1365-2958.2010.07320.x. [DOI] [PMC free article] [PubMed] [Google Scholar]
- 35.Karatan E, Watnick P. Signals, regulatory networks, and materials that build and break bacterial biofilms. Microbiol Mol Biol Rev. 2009;73:310–47. doi: 10.1128/MMBR.00041-08. [DOI] [PMC free article] [PubMed] [Google Scholar]
- 36.Kirisits MJ, Prost L, Starkey M, Parsek MR. Characterization of colony morphology variants isolated from Pseudomonas aeruginosa biofilms. Appl Environ Microbiol. 2005;71:4809–21. doi: 10.1128/AEM.71.8.4809-4821.2005. [DOI] [PMC free article] [PubMed] [Google Scholar]
- 37.Lambertsen L, Sternberg C, Molin S. Mini-Tn7 transposons for site-specific tagging of bacteria with fluorescent proteins. Environ Microbiol. 2004;6:726–32. doi: 10.1111/j.1462-2920.2004.00605.x. [DOI] [PubMed] [Google Scholar]
- 38.Ledeboer NA, Jones BD. Exopolysaccharide sugars contribute to biofilm formation by Salmonella enterica serovar typhimurium on HEp-2 cells and chicken intestinal epithelium. J Bacteriol. 2005;187:3214–26. doi: 10.1128/JB.187.9.3214-3226.2005. [DOI] [PMC free article] [PubMed] [Google Scholar]
- 39.Lee DG, Urbach JM, Wu G, Liberati NT, Feinbaum RL, Miyata S, Diggins LT, He J, Saucier M, Deziel E, Friedman L, Li L, Grills G, Montgomery K, Kucherlapati R, Rahme LG, Ausubel FM. Genomic analysis reveals that Pseudomonas aeruginosa virulence is combinatorial. Genome Biol. 2006;7:R90. doi: 10.1186/gb-2006-7-10-r90. [DOI] [PMC free article] [PubMed] [Google Scholar]
- 40.Lee VT, Matewish JM, Kessler JL, Hyodo M, Hayakawa Y, Lory S. A cyclic-di-GMP receptor required for bacterial exopolysaccharide production. Mol Microbiol. 2007;65:1474–84. doi: 10.1111/j.1365-2958.2007.05879.x. [DOI] [PMC free article] [PubMed] [Google Scholar]
- 41.Ma L, Jackson KD, Landry RM, Parsek MR, Wozniak DJ. Analysis of Pseudomonas aeruginosa conditional psl variants reveals roles for the psl polysaccharide in adhesion and maintaining biofilm structure postattachment. J Bacteriol. 2006;188:8213–21. doi: 10.1128/JB.01202-06. [DOI] [PMC free article] [PubMed] [Google Scholar]
- 42.Matilla MA, Travieso ML, Ramos JL, Ramos-Gonzalez MI. Cyclic diguanylate turnover mediated by the sole GGDEF/EAL response regulator in Pseudomonas putida: its role in the rhizosphere and an analysis of its target processes. Environ Microbiol. 2011;13:1745–66. doi: 10.1111/j.1462-2920.2011.02499.x. [DOI] [PubMed] [Google Scholar]
- 43.Matsukawa M, Greenberg EP. Putative exopolysaccharide synthesis genes influence Pseudomonas aeruginosa biofilm development. J Bacteriol. 2004;186:4449–56. doi: 10.1128/JB.186.14.4449-4456.2004. [DOI] [PMC free article] [PubMed] [Google Scholar]
- 44.Nielsen L, Li X, Halverson LJ. Cell-cell and cell-surface interactions mediated by cellulose and a novel exopolysaccharide contribute to Pseudomonas putida biofilm formation and fitness under water-limiting conditions. Environ Microbiol. 2011;13:1342–56. doi: 10.1111/j.1462-2920.2011.02432.x. [DOI] [PubMed] [Google Scholar]
- 45.Nilsson M, Chiang WC, Fazli M, Gjermansen M, Givskov M, Tolker-Nielsen T. Influence of putative exopolysaccharide genes on Pseudomonas putida KT2440 biofilm stability. Environ Microbiol. 2011;13:1357–69. doi: 10.1111/j.1462-2920.2011.02447.x. [DOI] [PubMed] [Google Scholar]
- 46.O'Toole GA. To build a biofilm. J Bacteriol. 2003;185:2687–9. doi: 10.1128/JB.185.9.2687-2689.2003. [DOI] [PMC free article] [PubMed] [Google Scholar]
- 47.O'Toole GA, Pratt LA, Watnick PI, Newman DK, Weaver VB, Kolter R. Genetic approaches to study of biofilms. Methods Enzymol. 1999;310:91–109. doi: 10.1016/s0076-6879(99)10008-9. [DOI] [PubMed] [Google Scholar]
- 48.Oliver A, Canton R, Campo P, Baquero F, Blazquez J. High frequency of hypermutable Pseudomonas aeruginosa in cystic fibrosis lung infection. Science. 2000;288:1251–4. doi: 10.1126/science.288.5469.1251. [DOI] [PubMed] [Google Scholar]
- 49.Parsek MR, Singh PK. Bacterial biofilms: an emerging link to disease pathogenesis. Annu Rev Microbiol. 2003;57:677–701. doi: 10.1146/annurev.micro.57.030502.090720. [DOI] [PubMed] [Google Scholar]
- 50.Rahme LG, Stevens EJ, Wolfort SF, Shao J, Tompkins RG, Ausubel FM. Common virulence factors for bacterial pathogenicity in plants and animals. Science. 1995;268:1899–902. doi: 10.1126/science.7604262. [DOI] [PubMed] [Google Scholar]
- 51.Ryder C, Byrd M, Wozniak DJ. Role of polysaccharides in Pseudomonas aeruginosa biofilm development. Curr Opin Microbiol. 2007;10:644–8. doi: 10.1016/j.mib.2007.09.010. [DOI] [PMC free article] [PubMed] [Google Scholar]
- 52.Sakuragi Y, Kolter R. Quorum-sensing regulation of the biofilm matrix genes (pel) of Pseudomonas aeruginosa. J Bacteriol. 2007;189:5383–6. doi: 10.1128/JB.00137-07. [DOI] [PMC free article] [PubMed] [Google Scholar]
- 53.Schaefer AL, Greenberg EP, Parsek MR. Acylated homoserine lactone detection in Pseudomonas aeruginosa biofilms by radiolabel assay. Methods Enzymol. 2001;336:41–7. doi: 10.1016/s0076-6879(01)36576-x. [DOI] [PubMed] [Google Scholar]
- 54.Shrout JD, Chopp DL, Just CL, Hentzer M, Givskov M, Parsek MR. The impact of quorum sensing and swarming motility on Pseudomonas aeruginosa biofilm formation is nutritionally conditional. Mol Microbiol. 2006;62:1264–77. doi: 10.1111/j.1365-2958.2006.05421.x. [DOI] [PubMed] [Google Scholar]
- 55.Singh PK, Schaefer AL, Parsek MR, Moninger TO, Welsh MJ, Greenberg EP. Quorum-sensing signals indicate that cystic fibrosis lungs are infected with bacterial biofilms. Nature. 2000;407:762–4. doi: 10.1038/35037627. [DOI] [PubMed] [Google Scholar]
- 56.Smith EE, Buckley DG, Wu Z, Saenphimmachak C, Hoffman LR, D'Argenio DA, Miller SI, Ramsey BW, Speert DP, Moskowitz SM, Burns JL, Kaul R, Olson MV. Genetic adaptation by Pseudomonas aeruginosa to the airways of cystic fibrosis patients. Proc Natl Acad Sci U S A. 2006;103:8487–92. doi: 10.1073/pnas.0602138103. [DOI] [PMC free article] [PubMed] [Google Scholar]
- 57.Starkey M, Hickman JH, Ma L, Zhang N, De Long S, Hinz A, Palacios S, Manoil C, Kirisits MJ, Starner TD, Wozniak DJ, Harwood CS, Parsek MR. Pseudomonas aeruginosa rugose small-colony variants have adaptations that likely promote persistence in the cystic fibrosis lung. J Bacteriol. 2009;191:3492–503. doi: 10.1128/JB.00119-09. [DOI] [PMC free article] [PubMed] [Google Scholar]
- 58.Stewart PS, Costerton JW. Antibiotic resistance of bacteria in biofilms. Lancet. 2001;358:135–8. doi: 10.1016/s0140-6736(01)05321-1. [DOI] [PubMed] [Google Scholar]
- 59.Stoodley P, Sauer K, Davies DG, Costerton JW. Biofilms as complex differentiated communities. Annu Rev Microbiol. 2002;56:187–209. doi: 10.1146/annurev.micro.56.012302.160705. [DOI] [PubMed] [Google Scholar]
- 60.Ueda A, Wood TK. Connecting quorum sensing, c-di-GMP, pel polysaccharide, and biofilm formation in Pseudomonas aeruginosa through tyrosine phosphatase TpbA (PA3885) PLoS Pathog. 2009;5:e1000483. doi: 10.1371/journal.ppat.1000483. [DOI] [PMC free article] [PubMed] [Google Scholar]
- 61.Vasseur P, Vallet-Gely I, Soscia C, Genin S, Filloux A. The pel genes of the Pseudomonas aeruginosa PAK strain are involved at early and late stages of biofilm formation. Microbiology. 2005;151:985–97. doi: 10.1099/mic.0.27410-0. [DOI] [PubMed] [Google Scholar]
- 62.Ventre I, Goodman AL, Vallet-Gely I, Vasseur P, Soscia C, Molin S, Bleves S, Lazdunski A, Lory S, Filloux A. Multiple sensors control reciprocal expression of Pseudomonas aeruginosa regulatory RNA and virulence genes. Proc Natl Acad Sci U S A. 2006;103:171–6. doi: 10.1073/pnas.0507407103. [DOI] [PMC free article] [PubMed] [Google Scholar]
- 63.Wang X, Preston JF, 3rd, Romeo T. The pgaABCD locus of Escherichia coli promotes the synthesis of a polysaccharide adhesin required for biofilm formation. J Bacteriol. 2004;186:2724–34. doi: 10.1128/JB.186.9.2724-2734.2004. [DOI] [PMC free article] [PubMed] [Google Scholar]
- 64.Wolfgang MC, Kulasekara BR, Liang X, Boyd D, Wu K, Yang Q, Miyada CG, Lory S. Conservation of genome content and virulence determinants among clinical and environmental isolates of Pseudomonas aeruginosa. Proc Natl Acad Sci U S A. 2003;100:8484–9. doi: 10.1073/pnas.0832438100. [DOI] [PMC free article] [PubMed] [Google Scholar]
- 65.Wozniak DJ, Wyckoff TJ, Starkey M, Keyser R, Azadi P, O'Toole GA, Parsek MR. Alginate is not a significant component of the extracellular polysaccharide matrix of PA14 and PAO1 Pseudomonas aeruginosa biofilms. Proc Natl Acad Sci U S A. 2003;100:7907–12. doi: 10.1073/pnas.1231792100. [DOI] [PMC free article] [PubMed] [Google Scholar]
- 66.Yang L, Hu Y, Liu Y, Zhang J, Ulstrup J, Molin S. Distinct roles of extracellular polymeric substances in Pseudomonas aeruginosa biofilm development. Environ Microbiol. 2011 doi: 10.1111/j.1462-2920.2011.02503.x. [DOI] [PubMed] [Google Scholar]
- 67.Yildiz FH, Schoolnik GK. Vibrio cholerae O1 El Tor: identification of a gene cluster required for the rugose colony type, exopolysaccharide production, chlorine resistance, and biofilm formation. Proc Natl Acad Sci U S A. 1999;96:4028–33. doi: 10.1073/pnas.96.7.4028. [DOI] [PMC free article] [PubMed] [Google Scholar]
Associated Data
This section collects any data citations, data availability statements, or supplementary materials included in this article.
Supplementary Materials
Images of colony morphology of 5 μl spots were acquired after 5 d of growth at 25°C. Colonies are arranged according to their isolation site.
Representative images of colony morphology of the initial inoculum and after 3 d of continuous growth in a tube bioreactor (biofilm growth) are shown (A). Arrows point toward RSCV morphotypes. The number of RSCVs in each population was quantified (B). PelC expression was measured from the adhered biomass of wild-type and psl mutants for E2, S54485 and X13273. RNAP is a loading control. Error bars indicate standard deviation.
Relative growth rate was monitored by OD600 from wild-type and pelpsl mutants grown at 37°C in shaking conditions.
Attachment to glass slides was visualized in a flow cell after one h of attachment and one h of continuous flow. Representative CSLM images are shown using a 40× objective of 19660, pel, psl and pelpsl (A). 19660 strains were compared for relative biomass after 24 h growth at 25°C in a microtiter dish biofilm assay using two different wash conditions (B). Rough washing is the typical method of washing by submerging the microtiter dish under water and rigorously dumping the liquid out. Gentle washing removes non-adhered biomass by gently pipetting the water washes. Error bars indicate standard deviation.
Psl polysaccharide dot blots were compared from strains grown overnight at 37°C. Wild-type and the corresponding psl mutant for PAO1, E2, S54485, CF127 and 19660 were compared for Psl expression levels. In addition PA14 and the arabinose inducible Psl strain, WFPA801 were also tested.
Strains were assessed for Psl and PelC expression (A) and pelA and pslA transcript levels (B) from plate grown cultures at 25 °C for 3 d. (A) Psl polysaccharide dot blot (top panel), PelC protein (middle panel) and RNA polymerase protein loading control (bottom panel) are shown for all isolates. One representative experiment is shown. (B) RNA profiles were assessed by qRT-PCR on pelA, pslA and rpsL transcripts. pelA and pslA transcripts are normalized to rpsL and then to PAO1 for relative transcript level. Error bars indicate standard deviation from three independent experiments.
All strains, except CF27, which did not amplify under either primer sets, were sequenced for the pel promoter region. The sequence was aligned beginning with the first base pair into the intergenic region (bp #1) followed by 596bp. The blue box indicates the stop codon for gdhB and the green box outlines the stop codon for PA3065. The conserved sequence is listed below the individual strain sequences. Regions that are shaded grey highlight areas that share the conserved sequence.
All strains, except PA14, which is missing the psl promoter, were sequenced for the psl promoter region. The sequence was aligned beginning with the first base pair into the intergenic region (bp #1) followed by 476bp. The transcriptional start site, −10, −35 and RsmA binding site are noted within the figure. The conserved sequence is listed below the individual strain sequences. Regions that are shaded grey highlight areas that share the conserved sequence.
The two different gene organizations found up-stream of pelA is represented for PAO1 (A) and PA14 (B). PAO1 has a three-gene insertion between pelA and gdhB. These genes are colored grey. The length of the intergenic region is specified.
RSCVs were complemented by supplying wspF in trans (pWspF). Colony morphologies are shown for both the vector control (VC) and pWspF (A). Each isolate was sequenced to determine the nature of the wspF mutation and described in the figure (B).