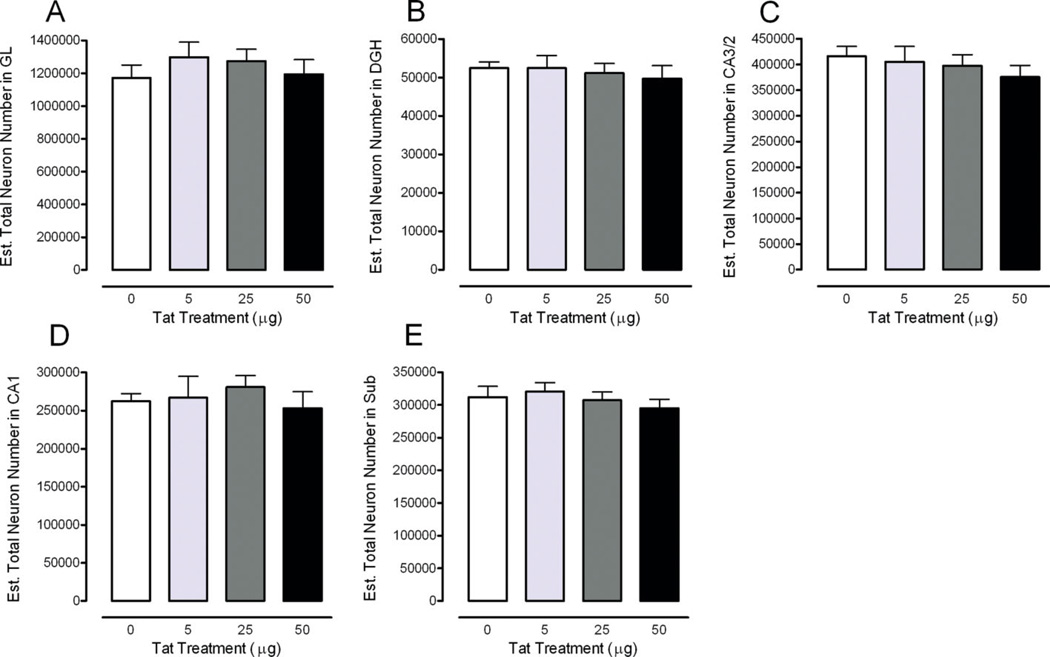
FIGURE 3.
Estimated total number of neurons across the five subregions of the rat hippocampus illustrated as a function of dose of Tat. Region specific illustration of the total neuron number is shown for the (A) granular layer (GL), (B) hilus of the dentate gyrus (DGH), (C) cornu ammonis fields (CA)2/3, (D) CA1, and (E) subiculum (SUB). No significant treatment effects were noted. [Color figure can be viewed in the online issue, which is available at www.interscience.wiley.com.]

