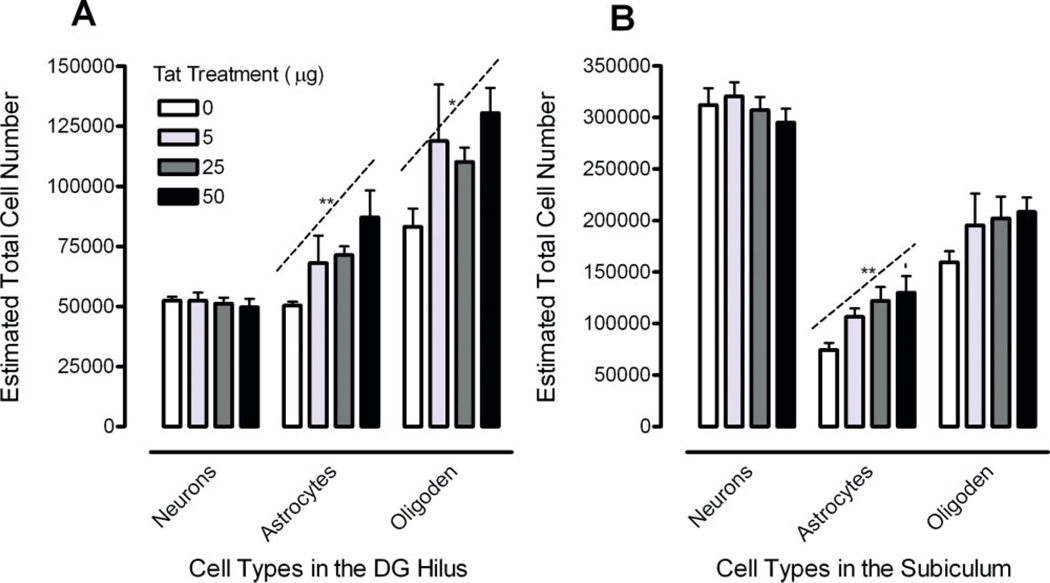
FIGURE 4.
Estimated total number of neurons, astrocytes, and oligodendrocytes illustrated as a function of dose of Tat in the (A) hilus of the dentate gyrus (DGH) with a significant linear Tat dose-response for astrocytes and oligodendrocytes and (B) subiculum (SUB) with a significant linear Tat dose-response for astrocytes, *P ≤ 0.05; **P ≤ 0.01. [Color figure can be viewed in the online issue, which is available at www.interscience.wiley.com.]

