

Abstract

Phosphorylation is an important post-transla-tional modification that rapidly mediates many cellular events. A key to understanding the dynamics of the phosphoproteome is localization of the modification site(s), primarily determined using LC-MS/MS. A major technical challenge to analysis is the formation of phosphopeptide–metal ion complexes during LC which hampers phosphopeptide detection. We have devised a strategy that enhances analysis of phosphopeptides, especially multiply phosphorylated peptides. It involves treatment of the LC system with EDTA and 2D-RP/RP-nanoUPLC-MS/MS (high pH/low pH) analysis. A standard triphosphorylated peptide that could not be detected with 1D-RP-nanoUPLC-MS/MS, even if the column was treated with EDTA-Na2 or if 25 mM EDTA-Na2 was added to the sample, was detectable at less than 100 fmol using EDTA-2D-RP/RP-nanoUPLC-MS/MS. Digests of α-casein and β-casein were analyzed by EDTA-1D-RP-nanoUPLC, 2D-RP/RP-nanoUPLC, and EDTA-2D-RP/RP-nanoUPLC to compare their performance in phosphopeptide analysis. With the first two approaches, no tri-and tetraphosphopeptides were identified in either α- or β-casein sample. With the EDTA-2D-RP/RP approach, 13 mono-, 6 di-, and 3 triphosphopeptides were identified in the α-casein sample, while 19 mono-, 8 di-, 4 tri-, and 3 tetraphosphopeptides were identified in the β-casein sample. Using EDTA-2D-RP/RP-nanoUPLC-MS/MS to examine 500 μg of a human foreskin fibroblast cell lysate a total of 1,944 unique phosphopeptides from 1,087 unique phosphoproteins were identified, and 2,164 unique phosphorylation sites were confidently localized (Ascore ≥20). Of these sites 79% were mono-, 20% di-, and ∼1% were tri- and tetraphosphopeptides, and 78 novel phosphorylation sites in human proteins were identified.
Reversible protein phosphorylation is a critical regulator of most cellular processes.1 It has been estimated that one-third of eukaryotic proteins can be phosphorylated with phosphorylation occurring on serine, threonine, or tyrosine residues and to a lesser extent histidine and aspartic acid residues.2,3 Phosphorylation on serine residues is the most common modification, followed by threonine and tyrosine. Localization of phosphorylation sites is crucial to understanding cellular events. Traditional standard methods for protein phosphorylation site identification were limited to 32P or 33P labeling followed by gel electrophoresis prior to phosphopep-tide mapping and Edman degradation.3 Liquid chromatography tandem mass spectrometry (LC-MS/MS) has been implemented successfully to identify protein phosphorylation in the past two decades because of its high sensitivity, accuracy and speed, and most importantly its applicability to phosphopro-teomic studies.4–17 However, protein phosphorylation studies remain very challenging because of the low stoichiometry of in vivo phosphorylated proteins as compared to their non-phosphorylated forms, and multiple phosphorylation sites that may occur in proteins can often not be localized confidently because of instrument limitations that may cause the phosphate group to be lost during the tandem mass spectrometry step.18–20
Multiply phosphorylated peptides and localization of these phosphorylation sites are crucial to understanding elegant and sophisticated phosphoproteome dynamics. Recently, the multiply phosphorylated unstructured domain of peptidylglycine α-amidating monooxygenase (PAM), a type I integral membrane protein that catalyzes one of the final steps in the biosynthesis of neuropeptides, was found to act as a signaling molecule that relays information from secretory granules to both the cytosol and nucleus.21 Another study showed that the Forkhead-associated (FHA) domain of human polynucleotide kinase 3′-phosphatase (PNK) specifically recognizes a multiply phos-phorylated motif (YAGpSpTDENTDSE) in the DNA repair scaffold XRCC1.22 If this peptide is nonphosphorylated or monophosphorylated at a specific serine residue there is no binding with PNK-FHA. Weak binding occurs when one of the two threonines is phosphorylated, while the strongest binding occurs for the triphosphorylated peptide YAGpSpT-DENpTDSE and the tetraphosphorylated peptide YAGpSpT-DENpTDpSE. Phosphorylation at multiple sites within one domain or motif assists in specific protein–protein interactions, contributes to increased local order, facilitates cooperatives, and drives specific intermolecular interactions in multistep phosphorylation cascades.21,23 A most recent study demonstrated that multisite phosphorylation of human liver cytochrome P450 3A4 enhances its gp78-and CHP-mediated ubiquitination.24
Use of fractionation methods has been integral to the vast improvements in phosphopeptide analyses over the past decade. One successful method utilizes phosphotyrosine antibodies for immunoaffinity purification of tyrosine phos-phoproteins or phosphopeptides;6,12,25,26 however, antibodies to other phosphorylated residues are not as effective. Immobilized metal ion affinity chromatography (IMAC) or TiO2 approaches or variations of these approaches selectively enrich for phosphopeptides, with some contamination of highly acidic peptides that are not phosphorylated.27 Thingholm et al. utilized a sequential elution strategy for IMAC and TiO2 for the rapid separation of monophosphorylated from multiply phosphorylated peptides.28 Wu et al. utilized nanoprobe-based immobilized metal affinity chromatography for sensitive and complementary enrichment of multiply phosphorylated peptides.29 Tao's group presented the polymer-based metal ion affinity capture (PolyMAC) approach, for the highly efficient isolation of phosphopeptides.30 The use of different chromato-graphic media for multidimensional liquid chromatography for phosphopeptide separations has increased the number of phosphopeptides that can be detected; e.g. strong cation exchange (SCX),31,32 strong anion exchange (SAE),33,34 and hydrophilic interaction chromatography (HILIC)35–37 have each demonstrated their unique selectivity for binding multiple phosphorylated peptides.
The formation of phosphopeptide–metal ion complexes during liquid chromatography is one of the most important factors that hinder phosphorylation analysis by LC-MS/MS, especially for multiply phosphorylated peptides. Liu et al. reported that the formation of the phosphopeptide–metal ion complex with either Fe(III) or Al(III) dramatically decreases or completely diminishes the signal intensity of protonated phosphopeptides.38 They found that the interaction between phosphopeptides and metal in the columns alters their chromatographic behavior, making it difficult for their elution and subsequent detection by LC-MS/MS. They reported that addition of 50 mM ethylenediaminetetraacetic acid (EDTA) to the phosphopeptide sample prior to LC-MS/MS diminishes the formation of phosphopeptide–metal ion complexes so that they were able to efficiently detect phosphopeptides. Yu et al. added EDTA to their samples prior to injection and were able to detect femtomole amounts of 3 standard monophosphopep-tides, and 1 diphosphorylated peptide, using nanoLC-MS.39 Winter et al. noted some disadvantages of this technique, such as that EDTA leads to rapid clogging and destruction of the nanospray needle and/or precipitation on the trap and analytical columns.40 To circumvent these problems the authors used citrate, another chelating agent, to bind to the metal ions in the LC column and showed that it enhanced the performance of phosphopeptide analysis by LC-MS/MS.40 However, because the stability constant of the Fe3+–EDTA complex (logKf = 25.7) is much larger than that of the Fe3+–citrate complex (logKf = 11.85),41 EDTA should be far more efficient than citrate to inactivate the free metal ions.
Ultraperformance liquid chromatography (UPLC) is increasingly being adopted successfully in proteomic research because it leads to dramatic increases in resolution, sensitivity, and speed of analysis.42 However, we found that phosphorylated peptides, especially the multiply phosphorylated peptides were more easily “missed” on reverse-phase UPLC columns than on traditional reverse-phase HPLC columns, which made analysis of phosphopeptides much more difficult. We describe below an effective nanoUPLC-MS/MS strategy to enhance the detection of multiply phosphorylated peptides. It involves combining a preflush EDTA-Na2 treatment of the LC system and implementation of online 2D RP/RP (high/low pH) nano-UPLC-MS/MS analysis. We demonstrate significant advantages of the EDTA-2D RP/RP nanoUPLC-MS/MS approach on multiphosphorylated peptides with standard phosphopeptides and phosphoproteins as well as with a complex biological phosphoproteome sample.
Experimental Section
Chemicals
Acetic acid, EDTA, iodoacetamide, dithiothrei-tol (DTT), ammonium hydroxide (28% NH3 in water, ≥99.99%), phosphoric acid, bovine α-casein (catalog No. C6780_250MG) and β-casein (catalog No. C6905_250MG), PHOS-Select Gallium Silica Spin Columns were purchased from SIGMA (St. Louis, MO, USA). Urea, HPLC-MS grade trifluoroacetic acid (TFA), and formic acid (99+%), HPLC-MS grade acetonitrile (ACN), and HPLC-MS grade water were purchased from Thermo Scientific (Waltham, MA). Titan-spherePhos-TiO kit, pyrrolidine solution were purchased from GL Sciences (Tokyo, Japan). Tris(hydroxymethyl)-aminomethane (Tris) was purchased from Amersham Bio-science (Fairfield, CT). Sequence grade trypsin was purchased from Promega (Madison, WI). Phosphopeptide standards, FQpSEEQQQTEDELQDK, DLDVPIPGRFDRRVpSVAAE, TRDIYETDpYYRK, and TRDIpYETDpYpYRK were purchased from AnaSpec (Fremont, CA).
Cell Culture and Lysis
Human foreskin fibroblast cells were grown in DMEM (Dulbecco's Modified Eagle Medium) to 80% cell confluence in 10-cm diameter dish. Cells were washed with cold PBS and lysed on ice with 8 M urea, 75 mM NaCl, 50 mM Tris, pH 8.2, 1 mM NaF, 1 mM glycerol phosphophate, 1 mM sodium orthovanadate, 10 mM sodium pyrophosphate, plus protease inhibitors. Lysates were sonicated, cleared of large debris by centrifugation at 2500g for 10 min at 4 °C, and stored at −80 °C. Protein concentration was measured by Bradford protein assay.
Phosphopeptide Sample Preparation
500 μg of α- or β-casein or human foreskin fibroblast cell lysis proteins were digested with trypsin in solution separately. After the digests were cleaned up with C18 spin columns and fractionated by strong cation exchange chromatography (SCX) (just for the cell lysis sample), the phosphopeptides were enriched with the Titansphere Phos-TiO Spin Tips (GL Sciences, Tokyo, Japan) (for α- and β-casein samples) or the PHOS-Select Gallium Silica Spin Columns (SIGMA, St. Louis, MO) (for the cell lysis sample). The procedures for in-solution trypsin digestion, sample cleanup, SCX fractionation, and phosphopeptide enrichment are presented as Supporting Information.
EDTA Treatment of C18 Columns
All the C18 columns for nano 2D RP/RP nanoUPLC were flushed for 24 h with 40 mM EDTA-Na2 salt in water followed by flushing with water for 12 h (see the Supporting Information Scheme S1). The columns were then equilibrated with 0.2% formic acid (the second dimension column) or 20 mM NH4HCO2 in water (the first dimension column) for 2 h. The flush flow rates were 2.0 μL/min and 300 nL/min for the first and second dimension columns, respectively.
NanoUPLC-MS/MS Analysis
1D or 2D RP/RP nano-UPLC-MS/MS was carried out on a linear ion trap Orbitrap mass spectrometer (LTQ-Orbitrap Velos, Thermo Scientific, Waltham, MA) coupled with a nanoAcquity two-dimensional UPLC system (Waters, Milford, MA). The procedures for 1D RP and 2D RP/RP nanoUPLC-MS/MS and MS parameters are presented as Supporting Information.
Data and Bioinformatics Analysis
Protein Database Search of MS/MS Spectra
MGF files were created from the raw LC-MS/MS data using Proteome Discoverer 1.1 (Thermo) and searched with Mascot (Version 2.3.2) against the NCBInr Mammalia protein database (obtained date 04/12/2011) for bovine α- and β-casein and the UniRef100 Homo sapiens database (obtained date 07/25/2011) for human foreskin fibroblast cell proteins. A false discovery rate for peptide identification was assessed by decoy database searching. The following parameters were used for all searches: trypsin; three missed cleavages; variable modifications of carbamidomethylation (Cys), oxidation (Met), deamination (Asn and Gln), and phosphorylation (Ser, Thr, Tyr); monoisotopic masses; peptide mass tolerance of 10 ppm, and product ion mass tolerance of 0.1 Da. Based on the search results, the accuracy of mass determination can be assessed and the systematic mass error can be refined. For the majority of our experiments, peptide mass error within 7 ppm and product ions within ±0.05 Da were achieved, in the rare case of LC-MS/MS runs, the accurate observed peptide mass can be determined by an adjustment with the systematic mass error obtained from the same data set.
Proteins Scaffold Analysis of Mascot Search Results
Mascot search results were further validated with ScaffoldPTM version 2.0.0 (Proteome Software, Inc., Portland, OR) and by manual inspection of the spectra. Ascore of phosphorylation site was obtained by ScaffoldPTM. False discovery rate was also obtained and set by Scaffold.
Results
Analysis of Phosphopeptide Standards
Phosphopep-tide standards, specifically, the monophosphorylated peptides FQpSEEQQQTEDELQDK, DLDVPIPGRFDRRVpSVAAE, and TRDIpYETDYYRK and a triphosphorylated peptide TRDIpYETDpYpYRK were used to investigate the effect of EDTA on phosphopeptide analysis by 1D RP nanoUPLC-MS/MS, 2D RP/RP nanoUPLC-MS/MS, and EDTA-2D RP/RP nanoUPLC-MS/MS. Although less than 50 fmol of the phosphopeptide FQpSEEQQQTEDELQDK could be detected by 1D nanoUPLC without the addition of EDTA, the extracted ion chromatogram (XIC) of the doubly charge ion 1031.42 m/z showed significant peak tailing, indicating that there were interactions with metal ions present. The peak tailing decreased with the addition of 25 mM EDTA in 20 mM NH4CHO2 to the sample. The triphosphorylated peptide TRDIpYETDpY-pYRK (1.5 pmol) could hardly be detected by 1D nanoUPLC-MS/MS analysis even with the addition of EDTA to the sample or EDTA treatment to the LC system. This peptide could not be detected either by 2D RP/RP nanoUPLC-MS/MS (without pre-EDTA treatment), indicating that multiply phosphorylated peptides have strong interactions with metal ions present on the columns and the nanoUPLC system.
Scheme S1 summarizes our simple novel strategy for the analysis of phosphopeptides. The first step is to flush the C18 columns with 40 mM EDTA-Na2 salt in water for 24 h at a flow rate of 2.0 and 0.300 μL/min for the first and the second dimension columns, respectively. This flush is intended to capture and remove any free Fe3+, Fe2+, and/or Al3+ in the UPLC system (including columns, pumps, switching valve, and tubings) and saturate and inactivate the sites of Fe3+, Al3+, and other metal ions by forming stable metal–EDTA complexes. The second step is to wash the UPLC system and columns with HPLC-MS grade water for 12 h. This wash step rinses away any residual EDTA in the UPLC system and columns and thus prevents EDTA precipitation (at low pH and/or high organic solvent) that leads to clogging of columns, tubings, and the nanospray needle. This water wash also reduces the high background of ions detected in the MS resulting from the EDTA wash.
The high pH reversed phase (pH 10.0)/low pH reversed phase (pH 2 to 3) two-dimensional liquid chromatography (2D RP/RP nanoUPLC) is also a key to enhancement of phosphopeptide analysis. The triphosphorylated peptide TRDIpYETDpYpYRK could not be detected by 1D nano-UPLC-MS/MS even with the flushing and washing steps. If the pretreatment of EDTA-Na2 was not implemented, this triphosphorylated peptide could not also be detected by 2D RP/RP nanoUPLC. However, when the combination of the EDTA-Na2 flush with 2D RP/RP nanoUPLC was utilized, less than 100 fmol of TRDIpYETDpYpY RK could be detected. Figure 1 shows the HCD MS/MS spectrum of the triply charged ion m/z 621.5643 (monoisotopic) of this triphospho-peptide (the theoretical monoisotopic triply charged ion is m/z 621.5648, the peptide mass error is −1.4 ppm). The b2 to b9 and y1 to y10 product ion series provide unambiguous localization of the three tyrosine phosphorylation sites. There were no neutral losses of 97.98 Da (H3PO4) observed since a neutral loss via β-elimination cannot occur on phosphotyrosine residues.
Figure 1.

MS/MS spectrum of a standard triphosphorylated peptide TRDIpYETDpYpYRK. Observed in fraction #1 of 2D RP/RP nanoUPLC is the peptide's triply charged ion m/z = 621.5643 (monoisotopic), theoretical peptide mass = 1861.6721 (monoisotopic). Peptide mass error is −1.4 ppm. Spectrum was obtained by EDTA-2D RP/RP nanoUPLC-MS/MS analysis.
Analysis of Phosphoprotein Standards: Phosphoryla-tion of α- and β-Casein
Phosphorylation analysis performance of EDTA-1D nanoUPLC was compared to 2D RP/RP nanoUPLC and EDTA-2D RP/RP nanoUPLC using two bovine phosphoproteins, α-casein and β-casein. Both were digested with trypsin separately, and the phosphopeptides were enriched with TiO2 spin columns according to the manufacturer's instruction. In all three analyses (EDTA-1D nanoUPLC, 2D RP/RP nanoUPLC, EDTA-2D RP/RP nanoUPLC), the same volume (5 μL) of the final phosphopeptide solution of a α-casein or β-casein sample (see Phosphopeptide Sample Preparation section in the Supporting Information) was loaded on a nanoAcquity UPLC by an autosampling system (Sample Manager, Waters). Tables S1–S6 summarize the identified phosphopeptides with at least one phosphorylation site at ≥95% localization probability based on the Ascore algorithm.43 Ascore measures the probability of correctly localizing the phosphorylation site based on the presence and intensity of site-determining product ions in the MS/MS spectra.43 With the EDTA-1D RP nanoUPLC analysis, only 7 monophosphorylated phosphopeptides (or 3 unique phosphorylation sites) were identified from the β-casein sample (see Table S1); 10 mono- and 1 diphosphorylated peptides (amounting to 7 unique phosphorylation sites) were identified from the α-casein sample (see Table S2). With 2D RP/RP nanoUPLC analysis but without EDTA pretreatment, 15 mono- and one diphosphopeptides were identified from the β-casein sample (see Table S3); 13 mono- and 6 diphosphory-lated peptides were identified from the α-casein sample (see Table S4). In contrast to the EDTA-1D nanoUPLC analysis and 2D RP/RP nanoUPLC analysis, 19 mono-, 8 di-, 4 tri-, and 3 tetraphosphopeptides (23 unique phosphorylation sites) were identified in the β-casein sample (Table S5); and 13 mono-, 6 di-, and 3 triphosphopetides (16 unique phosphorylation sites) were identified in the α-casein sample (Table S6) by EDTA-2D RP/RP nanoUPLC analysis. In the β-casein sample we also detected monophosphorylated peptide RELEELNVPGEI-VESLSSpSEESITR (with a Mascot score of 85) from the β-casein protein, tetraphosphorylated peptide KNTMEHVSpSpSEEpSIIpSQETYK (with a Mascot score of 61) and triphosphorylated peptide KNTMEHVSpSpSEEpSIISQETYK from the α-S2-casein protein (with a Mascot score of 69); however, the Ascores for their phosphorylation sites did not meet the requirement of localization probability ≥95% and were not included in Table S5. Several other multiphosphory-lated peptides that were detected in the α-casein sample were also not included in Table S6 for the same reason. Figure 2 summarizes the comparison results of phosphopeptide analysis for α- and β-casein samples among the three nanoUPLC conditions. Compared to EDTA-1D RP nanoUPLC analysis, the 2D RP/RP approach showed an improvement on phosphopeptide analysis by increasing the number of identified monophospho- or diphosphopeptides in the two samples. However, no tri- or tetraphosphopeptides were identified either in the α- or β-casein sample. The EDTA-2D RP/RP nanoUPLC approach demonstrated clearly the superiority over the 2D RP/RP nanoUPLC approach by identifying more mono- and diphosphopeptides (in the β-casein sample case), and especially by having the ability to detect the tri- and/or tetraphosphopep-tides (in both α- and β-casein sample cases). Figure 3A shows the HCD MS/MS spectrum of the tetraphosphorylated peptide RELEELNVPGEIVEpSLpSpSpSEESITR of β-casein. The HCD MS/MS of this peptide is very similar to that obtained with the CID MS/MS obtained with a Q-Tof tandem mass spectrometer.38 The b and y ion series confirm the localization of the four phosphorylation sites. The Ascores of these four phosphorylation sites were ≥23 or 100% localization confidence. Not only were the multiply phosphorylated peptides of β-casein detected by EDTA-2D RP/RP nano-UPLC-MS/MS, in many cases, different isoforms with phosphorylation occurring at different residues were also detected. One example is the detection of the di- or tri- or tetraphosphorylated form of the same peptide, RELEELNVP-GEIVESLSpSpSEESITR (although one phosphorylation site cannot be accurately localized at S19) and RELEELNVPGEI-VEpSLpSpSSEESITR and RELEELNVPGEIVEpSLpSpS-pSEESITR (see Table S5). Similar to the β-casein sample, the triphosphopeptides from α-casein could only be identified using the EDTA-2D RP/RP nanoUPLC-MS/MS approach. As with the α-casein sample, many peptides having the same sequence were detected with phosphorylation sites occurring at different residues. This finding emphasizes the advantage of the EDTA-2D RP/RP nanoUPLC over that of the 1D nanoUPLC or 2D RP/RP UPLC for phosphorylation analysis. The MS/MS spectrum of a triphosphorylated peptide VENLpSKDIGpSEpSTEDQAMEDIK of α-casein is shown in Figure 3B. All three phosphorylation sites were localized at a probability ≥96% (see Table S6). The above comparison clearly demonstrates that EDTA-2D RP/RP nanoUPLC-MS/MS provides significant advantages for phosphorylation analysis by increasing the number of identified phosphopeptides and the number of multiphosphorylated peptides as well. We have also found that the purity of commercial α- or β-casein standard proteins is not 100%. The α-casein sample contains α-casein S1, S2 and β-casein; and the β-casein sample contained β-casein, its variant, and α-casein. Interestingly, phosphopeptides from component PP3 protein were also identified in β-casein but not with the α-casein sample (see Tables S1–S6). Component PP3 is a phosphorylated glycoprotein in bovine milk. The MS/MS spectrum of a tetraphosphorylated peptide NLQIpSNEDLpSKEPpSIpSR of component PP3 is shown in Figure 3C. All four phosphorylation sites were observed with consecutive y ion series and their neutral losses of 1 to 4 H3PO4 group(s). Phosphorylation localization probabilities for the four potential phosphorylation sites are all 100%. A mono-, di-, and triphosphorylated form of the peptide NLQISNEDLSKEPSISR were also observed with the EDTA-2D RP/RP nanoUPLC-MS/MS approach (see Table S5).
Figure 2.

Bar chart summarizing the comparison of phosphopeptide analysis for α-casein or β-casein samples among EDTA-1D RP nanoUPLC, 2D RP/RP nanoUPLC, and EDTA-2D RP/RP nanoUPLC approaches. (EDTA+1D), one-dimensional reversed phase nanoUPLC with EDTA pretreatment; (2D RP/RP), 2-dimensional reversed phase (pH 10.0)/reversed phase (pH 2 to 3) nanoUPLC without EDTA pretreatment; (EDTA +2D RP/RP), two-dimensional reversed phase (pH 10.0)/reversed phase (pH 2 to 3) nanoUPLC with EDTA pretreatment; Mono-phospho, monophosphopeptides; Di-phospho, diphosphopeptides; Tri-phospho, triphosphopeptides; Tetra-phospho, tetraphosphopeptides.
Figure 3.

MS/MS spectra of the tetra- and triphosphorylated peptides identified in α-casein or β-casein samples by EDTA-2D RP/RP nanoUPLC-MS/MS analysis. A, RELEELNVPGEIVEpSLpSpSpSEESITR, a tryptic peptide of β-casein found in fraction #1 of EDTA-2D RP/RP nanoUPLC. Observed triply charged peptide ion m/z = 1041.4299 (monoisotopic), theoretical peptide mass = 3121.2583 (monoisotopic). B, VENLpSKDIGpSEpSTEDQAMEDIK, a tryptic peptide of α-casein found in fraction #1 of EDTA-2D RP/RP nanoUPLC. Observed triply charged peptide ion m/z = 893.3498 (monoistopic), theoretical peptide mass = 2677.0156 (monoisotopic). C, NLQIpSNEDLpSKEPpSIpSR, a tryptic peptide of component PP3 from the β-casein sample found in fraction #2 of EDTA-2D RP/RP nanoUPLC. Observed doubly charged peptide ion m/z = 1125.4321 (monoisotopic), theoretical peptide mass = 2248.8456 (monoisotopic). 98 = mass of one H3PO4; 196 = mass of two H3PO4; 294 = mass of three H3PO4; 392 = mass of four H3PO4. 17 = mass of NH3; 18 = mass of H2O.
Analysis of a Phosphoproteome: Phosphopeptides in Human Foreskin Fibroblast Cytosol
The EDTA-2D RP/RP nanoUPLC-MS/MS approach was next employed for the phosphoproteome analysis of the cytosolic fraction of human foreskin fibroblast cells. Approximately 500 μg of cytosolic proteins were in-solution digested with trypsin. After desalting, the tryptic peptides were fractionated with strong cation exchange chromatography following the protocol from the Gygi group,31 and 15 SCX fractions were collected. Each SCX fraction was desalted, and the phosphopeptides were enriched with a PHOS-Select Gallium Silica Spin Column, followed by C18 ZipTip cleanup prior to EDTA-2D RP/RP nanoUPLC-MS/MS analysis using 7 elution steps of increasing acetonitrile concentrations. Following Mascot searches against the Uniref100 human protein database, the results were validated with Scaffold PTM and Ascores obtained. 57,071 phosphory-lated peptides were identified with peptide probabilities ≥95% and Mascot scores ≥27 and 0.1% false discovery rates (see Table S7). Nonredundant phosphopeptides with Mascot ion scores of ≥30 and having at least one phosphorylation site with Ascore of ≥20 (meaning the probability of phosphorylation site localization ≥99%)43 were considered and resulted in a reduction to 2,156 phosphopeptides identified (see Table S8). Removing phosphopeptides with the same sequence and phosphosites but having other modifications (e.g., oxidation on methionine residue, deamidation on glutamine or asparagine residue) resulted in 1,944 unique phosphopeptides from 1,087 unique phosphoproteins (see Table S9). From these 1,944 phosphopeptides, 2,164 unique (nonredundant) phosphoryla-tion sites were confidently localized. Of these 1,944 phosphopeptides, 1,532 (79%) were monophosphorylated, 390 (20%) were diphosphorylated, 22 (1%) were triphosphory-lated, and 1 (<1%) was tetraphosphorylated. In many cases (see Table S8 and S9), peptides with the same amino acid sequence but different phosphorylation states were identified with a 100% probability of phosphorylation site localization for each modification site. For examples, AApSPpSPQSVR and AApSPpSPQpSVR from serine/arginine repetitive matrix protein 1; EKpTPpSPKEEDEEPESPPEK and EKpTPpSPKEEDEEPEpSPPEK from nuclear ubiquitous casein and cyclin-dependent kinase substrate 1; GPPDFpSpSDEEREPTPVLGSGAAAAGR and GPPDFpSpSDEEREPpTPVLGSGAAAAGR from lamina-associated polypeptide 2; IQEQEpSpSGEEDSDLSPEER and IQEQEpSpSGEEDpSDLSPEER from protein phosphatase inhibitor 2, etc. In comparison with previously identified human phosphorylation sites (as reported on Uniprot.org and Phosphosites.org on the 5th of March, 2013) this approach identified 78 unique novel phosphor-ylation sites from 78 phosphopeptides of 78 phosphoproteins (shown in Table S10). One example is the diphosphorylated peptide pYGLQDpSDEEEEEHPSK and its monophosphory-lated form YGLQDpSDEEEEEHPSK which were identified from the nuclear pore complex protein Nup98-Nup96. The protein's two chains Nup98 and Nup96 play a role in the bidirectional transport across the nucleoporin complex (NPC). Figure 4A is the tandem mass spectrum of the doubly charged ion at m/z 986.3812 (monoisotopic) of the monophosphory-lated peptide YGLQDpSDEEEEEHPSK. Phosphorylation at the sixth amino acid serine residue was already identified previously by other research groups. However, tyrosine phosphorylation of this peptide was not previously observed. Figure 4B is the MS/MS spectrum of the doubly charged ion at m/z 1026.3610 of the diphosphorylated peptide pYGLQDpSDEEEEEHPSK. Although a neutral loss of 97.96 Da (H3PO4) does not happen on a phosphotyrosine residue, a neutral loss of 79.97 Da (HPO3) can be observed on a phosphotyrosine residue. For instance, all of the b2 to b5 ions showed the loss of a HPO3 group on this phosphotyrosine residue. As shown in the figure, the MS/MS of tyrosine-phosphorylated peptide is very similar to that of its nontyrosine-phosphorylated analogue. This phenomenon has been reported previously.44 Another example is that of the three different phosphorylated states observed for peptide GKGFSVVADTPELQR (derived from LIM and SH3 domain protein 1), two monophosphorylated forms, GKGFpSVVADTPELQR and GKGFSVVADpTP-ELQR, and the diphosphorylated form GKFGpSVVAD-pTPELQR (see Figure 5A–C). Phosphorylation on the serine residue of this peptide has not previously been reported. A deamidated and monophosphorylated form, GKFGpSVVAD-TPELQ(deamidated)R, was identified as well (Figure 5D). Upon comparison to its nondeamidated analogue (Figure 5A), all the y ions from y2 to y13 show a 0.98 Da increment but not for y1 (see Figure 5D), indicating clearly that the location of deamidation is at the Q residue.
Figure 4.

MS/MS spectra of a mono- and diphosphorylated peptide from the nuclear pore complex protein Nup98-Nup96 identified in human foreskin fibroblast cytosol. A, monophosphorylated peptide, YGLQDpSDEEEEEHPSK. Observed peptide ion m/z = 986.3812 (monoisotopic), z = 2, theoretical peptide mass =1970.7421(monoisotopic); B, Diphosphorylated peptide pYGLQDpSDEEEEEHPSK. Phosphorylation on this tyrosine residue is a novel phosphorylation site. Observed peptide m/z = 1026.3610 (monoisotopic), z = 2, theoretical peptide mass = 2050.7084 (monoisotopic). Spectra obtained by EDTA-2D RP/RP nanoUPLC-MS/MS analysis. 98 = mass of one H3PO4; 80 = mass of HPO3; 18 = mass of H2O; 17 = mass of NH3. Inserts of the precursor ions were obtained from the high resolution (60,000 at m/z 400) MS1 survey scan showing their carbon isotopic distribution and charge state.
Figure 5.
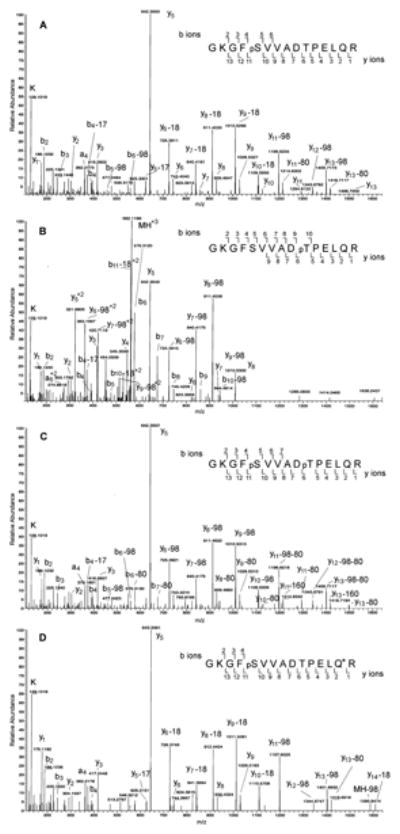
MS/MS spectra of a LIM and SH3 domain protein 1-derived tryptic peptide. A, GKGFpSVVADTPELQR, phosphorylated at the serine residue. Observed doubly charged peptide ion m/z = 842.4097 (monoisotopic), theoretical peptide mass = 1682.8031 (monoisotopic); B, GKGFSVVADpTPELQR, phosphorylated at the threonine residue. Observed triply charged peptide ion m/z = 561.9418 (monoisoptic), theoretical peptide mass = 1682.8031(monoisoptic); C, GKGFpSVVADpTPELQR, phosphorylated at both serine and threonine residues. Observed doubly charged peptide ion m/z = 882.3895 (monoisoptic), theoretical peptide mass = 1762.7694 (monoisoptic); D, GKGFpSVVADTPELQ(deami-dated)R, phosphorylated at serine residue and deamidated at the glutamine residue. Observed doubly charged peptide ion m/z = 842.9011 (monoisoptic), theoretical peptide mass = 1683.7871 (monoisoptic). Spectra obtained by EDTA-2D RP/RP nanoUPLC-MS/MS analysis. 98 = mass of one H3PO4; 160 = mass of two HPO3; 80 = mass of HPO3; 18 = mass of H2O; 17 = mass of NH3; Q* = deamidated Q.
Discussion
Our experience in phosphoproteomic analysis utilizing 1D nanoUPLC-MS/MS is similar to the reported literature, that is mainly monophosphorylated peptides were identified even with phosphopeptide enrichment. Based on suggestions in the literature,38,39 to improve phosphopeptide analysis, EDTA was added to the sample. A standard triphosphorylated peptide, TRDIpYETDpYpYRK, was prepared in 50 mM (NH4)2HPO4 buffer, pH 9.0, containing 25 mM EDTA and analyzed with 1D nanoUPLC-MS/MS. A very weak ion was observed (based on XIC) demonstrating a slight improvement in signal as compared to no addition of EDTA. This was also true for tryptic phosphopeptides obtained from human monocyte membrane proteins (manuscript in preparation).
In 2005, Liu et al. clearly demonstrated that the interaction of phosphopeptides, especially multiply phosphorylated peptides, with metal ions such as Fe3+ and Al3+ present in C18 reversed-phase columns caused phosphopeptides to be strongly retained.38 Other sources of metal ions can be from the sample itself, the stainless steel present in the HPLC system, the solvents used, and sample containers.38 The amount of metal impurities in each of our nanoUPLC columns was found to be at several ppm levels for Fe and Al and variable from batch to batch (determined from each column's certificate of analysis). Off-line 2D RP/RP was also reported to be advantageous for phosphorylation analysis.45 Online 2D RP/RP was recently employed in phosphoproteomic analysis.46 However, the clear benefits and impact of the combination of EDTA flush with online 2D RP/RP nanoUPLC for the analysis of phosphopep-tides, especially multiply phosphorylated peptides, have not been demonstrated or recognized.
To improve phosphoprotein analysis our approach was to combine the addition of EDTA to the sample and to flush the 2D RP/RP nanoUPLC system with EDTA prior to phosphopeptide analysis. Addition of EDTA to the sample alone was insufficient to eliminate the interaction of metal ions with phospho- and/or multiply-phosphorylated peptides. 1.5 pmol of a standard triphosphorylated peptide, TRDIpYETDpYpYRK, on a 1D nanoUPLC system that had been washed with 40 mM Na2-EDTA for 24 h was not detected. This triphosphorylated peptide was not detected by 2D RP/RP nanoUPLC analysis either. However, the combination of a 24 h 40 mM EDTA-Na2 flush with 2D RP/RP nanoUPLC analysis allowed 200 fmol of the triphsophorylated peptide, TRDIpYETDpYpYRK, to be easily detected. Our experience demonstrated that once the 2D RP/RP nanoUPLC system had been flushed with the 40 mM EDTA-Na2 solution for 24 h, it could be used for at least 3 months without addition of EDTA to the sample and without an additional EDTA flush to the nanoUPLC system. We monitored the efficacy of this treatment using the standard triphosphorylated peptide TRDIpYETDpYpYRK. If this peptide cannot be detected, then the 2D RP/RP nanoUPLC system requires another 40 mM EDTA-Na2 flush prior to phosphopeptide analysis. Benefits of the 12 h water flush and rinse are that 1) any residual EDTA-Na2 present in the 2D RP/RP nanoUPLC system is significantly decreased thus preventing clogging and 2) the amount of background ions detected by MS is decreased. Using a high purity grade of EDTA-Na2 was also found to be essential in reducing background signal.
The addition of EDTA to samples has been found by us and other researchers to lead to clogging of columns and nanospray needles,40 due to precipitation of EDTA after analyzing several samples. EDTA is nonvolatile and negatively charged which destroys the stability of nanospray ionization. A prewash of the columns and nanoUPLC system with 40 mM EDTA for 24 h followed by rinsing with water provides a stable spray and prevents this type of clogging. Another important fact worth mentioning is that after the analysis of many samples that contain residual metal ions (for an example, in-gel digestion samples when the silver destain reagent containing Fe3+ is used) multiphosphorylated peptides will not be detected. In this case a system flush and rinse will not improve phosphopeptide analysis. Rather the capability of detecting multiphosphorylated peptides can only be restored after replacing the columns and tubing followed by EDTA flush and rinse as described above.
The reasons why it is more difficult to detect multi-phosphorylated peptides on a nanoUPLC system as compared to a conventional HPLC are not clear. There are two factors that might explain this. One is the particle size of the C18 resin. On the nanoUPLC column it is 1.7 μm, one to two times smaller than that of conventional nanoHPLC columns (3 or 5 μm). Thus, theoretically two to four times particle surface is available for phosphopeptides to interact with metal ions. Also, nanoUPLC is operated under 6,000 to 7,000 psi (when a 25 cm BEH C18 column is used at a flow rate of 0.3 μL/min) which is 3 to 4 times higher than that of conventional nanoHPLC (1,500 to 2,000 psi). The distance of a positively charged metal ion on the column and the negatively charged phospho group of a phosphopeptide should be shorter in the nanoUPLC system as compared to conventional nanoHPLC, resulting in a stronger electrostatic force (Coulomb's) and, therefore, making it more difficult for phosphopeptides to be eluted from the column.
Our experiments demonstrated that either EDTA-1D nanoUPLC (low pH, 2–3) or 2D RP/RP nanoUPLC could not detect tri- or tetraphosphorylated peptides. However, after EDTA treatment, 2D RP/RP nanoUPLC (high pH, 10.0/low pH, 2–3) easily detected tri- or tetraphosphorylated peptides, probably due to the low pH (2 to 3 for 1D nanoUPLC), the conditional stability constant for the Fe3+/Fe2+–EDTA complex being close to or smaller than that of the Fe3+/Fe2+–(PO3−)n–peptide complex (n ≥ 2), and the ability to trap multiphosphorylated peptides efficiently. At pH 10.0 (during the first dimension of 2D RP/RP nanoUPLC), the conditional stability constant for the Fe3+/Fe2+–EDTA complex is larger than that of the Fe3+/Fe2+–(PO3−)n–peptide complex (note: the conditional stability constant is pH dependent). Since at pH 10.0 EDTA forms efficiently a complex with Fe3+/Fe2+, the freed multiphosphorylated peptides are able to elute from the first dimension and precolumn into the second dimension column. This is similar to IMAC or TiO2 enrichment approach for phosphopeptides: binding phosphopeptides at acid pH and eluting phosphopeptides at basic pH condition. An excellent article has reported the measurement of the stoichiometric equilibrium constant for interaction of Fe3+ and phosphor-ylserine residues of phosvitin and casein 33 years ago.47 A stability constant (logKf) was calculated for the mononuclear monodentate chelate Fe3+(pS), mononuclear bidentate Fe3+(pS•pS), and binuclear monodentate Fe3+(pS)2 complexes, and it was 16.3, 18.0, and 21.2, respectively.47 Another possible factor is that in the 2D RP/RP nanoUPLC method, 1 min after the phosphopeptide sample is loaded on the first dimension column, the first elution step of 8.5% ACN is employed. Extremely hydrophilic peptides, e.g., multiphosphorylated peptides, flow through the first dimension column without retention, directly into the precolumn and the second dimension C18 column (analytical column). In fact most tri-and tetraphosphorylated peptides were detected in the first fraction. Interestingly, it was also found that when the ACN concentration used in the first elution step was reduced to ≤4.0% the chance to detect tri- and tetraphosphorylated peptides also decreased.
To what extent metal ion–phosphopeptide complexes impact the analysis of phosphopeptides depends on the number of free metal coordination sites. The metal impurities found in C18 resins are variable among the different batches. Another factor is that the metal ion–phosphopeptide complex formation shows relatively less impact on a large scale for phosphoproteomic analysis rather than on a small scale. In large scale analysis there are enough phosphopeptides to saturate the free metal coordination sites, thus, enabling the detection of the remaining unbound phosphopeptides. However, the amount of sample is usually limited in biological research.
Phosphopeptide analysis is still a challenge. Difficulties include low stoichiometry of phosphorylation modification in vivo; losses at each experimental step, starting from cell or tissue harvesting to the mass spectrometer; dephosphorylation by phosphatases; losses of phosphoproteins or phosphopeptides from formation of complexes with metal ions existing in the sample solution prior to IMAC or TiO2 enrichment; losses of phosphopeptides during HPLC separation as discussed above and by other researchers; and loss of phosphopeptide ionization efficiency due to ion suppression from the presence of nonphosphorylated peptides coeluting during chromatog-raphy. To improve phosphorylation analysis, attention to detail at every step from sample preparation to mass spectrometric detection must be considered. Avoiding the losses of phosphoproteins or phosphopeptides via the formation of metal ion complexes on the nanoUPLC system and during sample preparation is essential for successful phosphoproteo-mic analysis. Although discussion here mainly focuses on reversed phase chromatography, in general, the concept and method described above to eliminate the adverse impact of metal ions on the analysis of multiply phosphorylated peptides can be also adapted to other chromatography methods such as strong cation exchange chromatography.
Mann's group and Gygi's group have independently evaluated the impact of HCD or CID-type fragmentation on phosphoproteomic analysis.48,49 Some advantages of HCD fragmentation over CID with orbitrap detection include no low-mass cutoff and higher quality MS/MS spectra for confident phosphorylation site localization due to a wider range of fragmentation pathways of phosphopeptides. A disadvantage of HCD is that spectral acquisition times are currently longer than CID (MS/MS data collected on the ion trap), which results in a lower number of phosphopeptides detected. Multiple dimensional liquid chromatography separation and/or prefractionation can reduce the sample complexity and therefore benefits LC-MS/MS analysis with HCD fragmentation by increasing the number of phosphopeptides detected.
Conclusions
The major finding of this work is that ultilizing the combination of EDTA pretreatment with 2D RP/RP nanoUPLC can circumvent the adverse impact of metal ions (present in a nanoUPLC system) on phosphopeptide analysis. The EDTA-2D RP/RP nanoUPLC approach is superior to either the EDTA-1D nanoUPLC or the 2D RP/RP nanoUPLC approach for improving phosphopeptides analysis, especially for multiply phosphorylated peptides. EDTA-2D RP/RP nanoUPLC-MS/MS has been shown to be a reliable and robust approach for the analysis of phosphopeptides and phosphoproteomic analysis. It also benefits the detection and identification of phosphopeptide isomers and different phosphorylation status which are crucial to understanding cell signaling and transduction regulated by complex, dynamic phosphorylation. This novel method has been successfully applied in the quantitative phosphoproteomic analysis of the human monocyte membrane and tyrosine receptor tyrosine-phosphoproteome projects (manuscripts in preparation) and has become our standard phosphorylation analysis method.
Supplementary Material
Acknowledgments
This work was supported by the National Institutes of Health (P20-DA-026149, RHA) and (AI082423, LDS). The LTQ Orbitrap Velos was purchased through a Shared Instrumentation Grant (1S10RR029398).
Footnotes
Supporting Information: Experimental Section, Tables S1–S10, Scheme S1, and Figure S1. This material is available free of charge via the Internet at http://pubs.acs.org.
Notes: The authors declare no competing financial interest.
References
- 1.Hunter T. Cell. 2000;100:113–127. doi: 10.1016/s0092-8674(00)81688-8. [DOI] [PubMed] [Google Scholar]
- 2.Cohen P. Nat Cell Biol. 2002;4:E127–E130. doi: 10.1038/ncb0502-e127. [DOI] [PubMed] [Google Scholar]
- 3.Sickmann A, Meyer HE. Proteomics. 2001;1:200–206. doi: 10.1002/1615-9861(200102)1:2<200::AID-PROT200>3.0.CO;2-V. [DOI] [PubMed] [Google Scholar]
- 4.Hou J, Mckeehan K, Kan M, Carr SA, Huddleston MJ, Crabb JW, Mckeehan WL. Protein Sci. 1993;2:86–92. doi: 10.1002/pro.5560020109. [DOI] [PMC free article] [PubMed] [Google Scholar]
- 5.Carr SA, Huddleston MJ, Annan RS. Anal Biochem. 1996;239:180–192. doi: 10.1006/abio.1996.0313. [DOI] [PubMed] [Google Scholar]
- 6.Blagoev B, Ong S, Kratchmarova I, Mann M. Nat Biotechnol. 2004;22:1139–1145. doi: 10.1038/nbt1005. [DOI] [PubMed] [Google Scholar]
- 7.Yu LR, Zhu Z, Chan KC, Issaq H, Dimitrov DS, Veenstra TD. J Proteome Res. 2007;6:4150–4162. doi: 10.1021/pr070152u. [DOI] [PubMed] [Google Scholar]
- 8.Glavy JS, Krutchinsky AN, Cristea IM, Berke IC, Boehmer T, Blobel G, Chait BT. Proc Natl Acad Sci USA. 2007;104:3811–3816. doi: 10.1073/pnas.0700058104. [DOI] [PMC free article] [PubMed] [Google Scholar]
- 9.Woo EM, Fenyo D, Kwok BH, Funabiki H, Chait BT. Anal Chem. 2008;80:2419–2425. doi: 10.1021/ac702059p. [DOI] [PubMed] [Google Scholar]
- 10.Ding SJ, Wang Y, Jacobs JM, Qian WJ, Yang F, Tolmachev AV, Du X, Wang W, Moore RJ, Monroe ME, Purvine SO, Waters K, Heibeck TH, Adkins JN, Camp DG, II, Klemke RL, Smith RD. J Proteome Res. 2008;7:4215–4224. doi: 10.1021/pr7007785. [DOI] [PMC free article] [PubMed] [Google Scholar]
- 11.Heibeck TH, Ding SJ, Opresko LK, Zhao R, Schepmoes AA, Yang F, Tolmachev AV, Monroe ME, Camp DG, II, Smith RD, Wiley HS, Qian WJ. J Proteome Res. 2009;8:3852–3861. doi: 10.1021/pr900044c. [DOI] [PMC free article] [PubMed] [Google Scholar]
- 12.Du J, Bernasconi P, Clauser KR, Mani DR, Finn SP, Beroukhim R, Burns M, Julian B, Peng XP, Hieronymus H, Maglathlin RL, Lewis TA, Liau LM, Nghiemphu P, Mellinghoff IK, Louis DN, Loda M, Carr SA, Kung AL, Golub TR. Nat Biotechnol. 2008;27:77–92. doi: 10.1038/nbt.1513. [DOI] [PMC free article] [PubMed] [Google Scholar]
- 13.Dephoure N, Zhou C, Villen J, Beausoleil SA, Bakalarski CE, Elledge SJ, Gygi SP. Proc Natl Acad Sci USA. 2008;105:10762–10767. doi: 10.1073/pnas.0805139105. [DOI] [PMC free article] [PubMed] [Google Scholar]
- 14.Bodenmiller B, Wanka S, Kraft C, Urban J, Campbell D, Pedrioli PG, Gerrits B, Picotti P, Lam H, Vitek O, Brusniak MY, Roschitzki B, Zhang C, Shokat KM, Schlapbach R, Colman-Lerbner A, Nolan GP, Nesvizhskii AI, Peter M, Loewith R, Mering Cv, Aebersold R. Sci Signaling. 2010;3(153):rs4. doi: 10.1126/scisignal.2001182. [DOI] [PMC free article] [PubMed] [Google Scholar]
- 15.Lau EK, Trester-Zedlitz M, Trinidad JC, Kotowski SJ, Krutchinsky AN, Burlingame AL, Zastrow Mv. Sci Signaling. 2011;4(185):ra52. doi: 10.1126/scisignal.2001748. [DOI] [PMC free article] [PubMed] [Google Scholar]
- 16.Rigbolt KTG, Prokhorova TA, Akimov V, Henningsen J, Johansen PT, Kratchmarova I, Kassem M, Mann M, Olesn JV, Blagoev B. Sci Signaling. 2011;4(164):rs3. doi: 10.1126/scisignal.2001570. [DOI] [PubMed] [Google Scholar]
- 17.Beltrao P, Albanese V, Kenner LR, Swaney DL, Burlingame A, Villen J, Lim WA, Fraser JS, Frydman J, Krogan NJ. Cell. 2012;150:413–425. doi: 10.1016/j.cell.2012.05.036. [DOI] [PMC free article] [PubMed] [Google Scholar]
- 18.Boersema PJ, Mohammed S, Heck AJR. J Mass Spectrom. 2009;44:861–878. doi: 10.1002/jms.1599. [DOI] [PubMed] [Google Scholar]
- 19.Huzarska M, Ugalde I, Kaplan DA, Hartmer R, Easterling ML, Polfer NC. Anal Chem. 2010;82:2873–2878. doi: 10.1021/ac9028592. [DOI] [PubMed] [Google Scholar]
- 20.Palumbo A, Reid GE. Anal Chem. 2008;80:9735–9747. doi: 10.1021/ac801768s. [DOI] [PubMed] [Google Scholar]
- 21.Rajagopal C, Stone KL, Francone VP, Mains RE, Eipper BA. J Biol Chem. 2009;18:25723–25734. doi: 10.1074/jbc.M109.035782. [DOI] [PMC free article] [PubMed] [Google Scholar]
- 22.Ali AAE, Jukes RM, Pearl LH, Oliver AW. Nucleic Acids Res. 2009;37:1701–1712. doi: 10.1093/nar/gkn1086. [DOI] [PMC free article] [PubMed] [Google Scholar]
- 23.Lenz P, Swain PS. Curr Biol. 2006;16:2150–2155. doi: 10.1016/j.cub.2006.09.013. [DOI] [PubMed] [Google Scholar]
- 24.Wang Y, Guan S, Acharya P, Liu Y, Thirumaran RK, Brandman R, Schuetz EG, Burlingame AL, Correia MA. Mol Cell Proteomics. 2012;11(2) doi: 10.1074/mcp.M111.010132. doi:M111.010132. [DOI] [PMC free article] [PubMed] [Google Scholar]
- 25.Yeung Y, Stanley ER. Mol Cell Proteomics. 2003;2.11:1143–1155. doi: 10.1074/mcp.R300009-MCP200. [DOI] [PubMed] [Google Scholar]
- 26.Lind SB, Artemenko K, Elfineh L, Mayrhofer C, Zubarev R, Bergquist J, Pettersson U. Cell Signaling. 2011;23:1387–1395. doi: 10.1016/j.cellsig.2011.03.021. [DOI] [PubMed] [Google Scholar]
- 27.Tichy A, Salovska B, Rehulka P, Klimentova J, Vavrova J, Stulik J, Hernychova L. J Proteomics. 2011;74:2786–2797. doi: 10.1016/j.jprot.2011.07.018. [DOI] [PubMed] [Google Scholar]
- 28.Thingholm TE, Jensen ON, Robinson PJ, Larsen MR. Mol Cell Protoemics. 2008:661–671. doi: 10.1074/mcp.M700362-MCP200. [DOI] [PubMed] [Google Scholar]
- 29.Wu H, Hsu C, Tsai C, Lin P, Lin C, Chen Y. Proteomics. 2011;11:2639–2653. doi: 10.1002/pmic.201000768. [DOI] [PubMed] [Google Scholar]
- 30.Iliuk AB, Martin VA, Alicie BM, Geahlen RL, Tao WA. Mol Cell Protoemics. 2010;9.10:2162–2172. doi: 10.1074/mcp.M110.000091. [DOI] [PMC free article] [PubMed] [Google Scholar]
- 31.Villen J, Gygi SP. Nat Protoc. 2008;3:1630–1638. doi: 10.1038/nprot.2008.150. [DOI] [PMC free article] [PubMed] [Google Scholar]
- 32.Dephoure N, Gygi SP. Methods. 2011;54:379–386. doi: 10.1016/j.ymeth.2011.03.008. [DOI] [PMC free article] [PubMed] [Google Scholar]
- 33.Dai J, Wang LS, Wu YB, Sheng QH, Wu JR, Shieh CH, Zeng R. J Proteome Res. 2009;8:133–141. doi: 10.1021/pr800381w. [DOI] [PubMed] [Google Scholar]
- 34.Wu YB, Dai J, Yang XL, Li SJ, Zhao SL, Sheng QH, Tang JS, Zheng GY, Li YX, Wu JR, Zeng R. Mol Cell Proteomics. 2009;8:2809–2826. doi: 10.1074/mcp.M900293-MCP200. [DOI] [PMC free article] [PubMed] [Google Scholar]
- 35.McNulty DE, Annan RS. Mol Cell Proteomics. 2008:971–980. doi: 10.1074/mcp.M700543-MCP200. [DOI] [PubMed] [Google Scholar]
- 36.Singer D, Kuhlmann J, Muschket M, Hoffmann R. Anal Chem. 2010;82:6409–6414. doi: 10.1021/ac100473k. [DOI] [PubMed] [Google Scholar]
- 37.Wu C, Chen Y, Tai J, Chen S. J Proteome Res. 2011;10:1088–1097. doi: 10.1021/pr100864b. [DOI] [PubMed] [Google Scholar]
- 38.Liu S, Zhang C, Campbell JL, Hang H, Yeung KK, Han VKM, Lajoie GA. Rapid Commun Mass Spectrom. 2005;19:2747–2756. doi: 10.1002/rcm.2105. [DOI] [PubMed] [Google Scholar]
- 39.Yu YQ, Campuzano I, Gilar M. Waters Application Note. 2006 720001458EN. [Google Scholar]
- 40.Winter D, Seidler J, Ziv Y, Shiloh Y, Lehmann WD. J Proteome Res. 2009;8:418–424. doi: 10.1021/pr800304n. [DOI] [PubMed] [Google Scholar]
- 41.Furia TE. CRC Handbook of Food Additives. 2. CRC Press; 1972. Sequestrants in Foods. [Google Scholar]
- 42.Swartz ME. J Liq Chromatogr Relat Technol. 2005;28:1253–1263. [Google Scholar]
- 43.Beausoleil SA, Villen J, Gerber SA, Rush J, Gygi SP. Nat Biotechnol. 2006;10:1285–1292. doi: 10.1038/nbt1240. [DOI] [PubMed] [Google Scholar]
- 44.Salek M, Alonso A, Pipkorn R, Lehmann WD. Anal Chem. 2003;75:2724–2729. doi: 10.1021/ac020657y. [DOI] [PubMed] [Google Scholar]
- 45.Song C, Ye M, Han G, Jiang X, Wang F, Yu Z, Chen R, Zou H. Anal Chem. 2010;82:53–56. doi: 10.1021/ac9023044. [DOI] [PubMed] [Google Scholar]
- 46.Ficarro SB, Zhang Y, Carrasco-Alfonso MJ, Garg B, Adelmant G, Webber JT, Luckey CJ, Marto JA. Mol Cell Proteomics. 2011 doi: 10.1074/mcp.O111.011064. doi:10:10.1074. [DOI] [PMC free article] [PubMed] [Google Scholar]
- 47.Hegenauer J, Saltman P, Nace G. Biochemistry. 1979:3865–3879. doi: 10.1021/bi00585a006. [DOI] [PubMed] [Google Scholar]
- 48.Nagaraj N, D'Souza RCJ, Cox J, Olsen JV, Mann M. J Proteome Res. 2010;9:6786–6794. doi: 10.1021/pr100637q. [DOI] [PubMed] [Google Scholar]
- 49.Jedrychowski MP, Huttlin EL, Haas W, Sowa ME, Rad R, Gygi SP. Mol Cell Proteomics. 2011 doi: 10.1074/mcp.M111.009910. doi:10:M111.009910. [DOI] [PMC free article] [PubMed] [Google Scholar]
Associated Data
This section collects any data citations, data availability statements, or supplementary materials included in this article.