

Abstract
Background
In the absence of an effective vaccine against HIV-1, the scientific community is presented with the challenge of developing alternative methods to curb its spread. Due to the complexity of the disease, however, our ability to predict the impact of various prevention and treatment strategies is limited. While ART has been widely accepted as the gold standard of modern care, its timing is debated.
Objectives
To evaluate the impact of medical interventions at the level of individuals on the spread of infection across the whole population. Specifically, we investigate the impact of ART initiation timing on HIV-1 spread in an MSM (Men who have Sex with Men) population.
Design and Methods
A stochastic multi-scale model of HIV-1 transmission that integrates within a single framework the in-host cellular dynamics and their outcomes, patient health states, and sexual contact networks. The model captures disease state and progression within individuals, and allows for simulation of therapeutic strategies.
Results
Early ART initiation may substantially affect disease spread through a population.
Conclusions
Our model provides a multi-scale, systems-based approach to evaluate the broader implications of therapeutic strategies.
Introduction
A complicating aspect of the HIV-1 epidemic is that the virus spread within human populations and the course of disease within individuals are intertwined, and governed by multiple factors that cannot be easily isolated. The disease on both levels progresses through complex interactions among many components, which is typical of chronic diseases [1]. Additionally, treatment of HIV-1-infected persons affects not only their personal health, but also the degree of exposure and transmission risk to their sexual partners, and consequently the epidemic dynamics of the entire population. Therefore, a quantitative analysis of how phenomena on higher scales emerge from processes on lower scales is crucial to understanding disease dynamics. Addressing these issues requires integrated models capable of examining not only isolated factors, but also their interrelationships across relevant scales.
Traditional epidemiological modeling is based on two premises: (1) individuals within a population at any given time can be either susceptible to disease, infected, or not susceptible; and (2) the population is fully mixed. It is known that neither assumption is inadequate for modeling the HIV-1 epidemic; the first one does not account for complexity of chronic diseases with multiple stages, and the second is a poor representation of sexual contact patterns [2-26]. Here a framework combining network-type contact models with more sophisticated disease models is needed [8,10,27-32].
We introduce a new model of HIV-1 transmission that allows for assessment of processes on multiple scales of disease, incorporating an actual sexual contact network, and a detailed model of disease progression driven by variable within-host processes, their outcomes, and medical intervention. The model is based on an MSM (Men who have Sex with Men) sexual network documented in Colorado Springs, USA [33], chosen for several reasons. First, the Colorado Springs sexual network has been well documented and the network structure is known. Second, its main core remained largely unchanged for about 5 years, hence a static network can be assumed. Third, the HIV status of approximately 70 % of the main core is known, which allows for model validation under no-treatment scenario. While simulations in this study have been performed for an MSM group, the model can be modified for general populations given that the sexual contact network is known.
Using this model, we investigate the impact of ART initiation timing on HIV-1 spread in a population. While ART has been widely accepted as the gold standard of modern care, its timing is debated [34-39]. The current recommendation by the Department of Health and Human Services Office of AIDS Research Advisory Council [40] calls for ART initiation during the asymptomatic phase, as the number of the CD4+ cells of the immune system drops below 200 cells/µl. However, several recent studies provided evidence that initiating therapy earlier may offer a number of benefits such as decreased severity of symptoms during the acute infection phase; preservation of the immune system; reduction of virus diversity, and boosting the initial host response to viral replication [14,39,41-44]; reduction of seeding in latent virus reservoirs [44]; lower levels of latently infected cells [14,45,46]; reduced AIDS and death rates [47]. The downsides of early treatment initiation are the expense, long-term metabolic effects, treatment fatigue, patients not being emotionally ready to be adherent. The issue of ART timing is thus an important example of difficulties associated with decision-making in complex chronic diseases.
Our overall aim is to evaluate the impact of medical interventions at the level of individuals, on the spread of infection across the whole population. Specifically, we investigate the impact of ART initiation timing on HIV-1 spread in an MSM population. We demonstrate that our multi-scale, systems-based approach can be successfully used to evaluate the broader implications of therapeutic strategies.
Methods
Overall structure of the model
The model describes processes evolving on three scales: (1) within-host, (2) patient disease progression and state of health, and (3) disease transmission in a MSM population (Figure 1). The within-host scale describes dynamics and interactions between the immune system and the virus for each individual (Figure 1A). The number of CD4+ cells and the viral load are computed at a monthly time step, the details of computation are provided in the section “Within-host models for each health state”. If the CD4+ count and the viral load satisfy certain criteria, described in the section “Within-host models for each health state”, the patient transitions to a new health state. There is a total of eight health states for each individual, and the transitions between states take place at the second scale of the model (Figure 1B). Each individual is placed on a sexual contact network, which is the third scale of the model (Figure 1C). At each time step, the CD4+ count and the viral load is assessed for each individual, and his HIV-1 transmissibility is computed. Based on the transmissibility, his susceptible partners can become infected and enter the Acute Infection phase. Their disease histories then progress according to Figure 1B.
Figure 1. A multi-scale model of HIV-1 transmission.

Within-host models (A) specific to each stage of disease (B) produce estimates of viral load and CD4+ cell count in every individual. These are key parameters that determine the course of disease, and dictate when regimens need to be changed. Graphs in (A) are a sample simulation of viral load within one patient, they demonstrate the differences in viral load in response to changing the timing of ART initiation . Viremia is tempered with ART initiated during the acute infection phase. Each individual is placed on a sexual network (C) with a distinct structure. The transmissibility is a function of the CD4+ count that determines the overall health of an individual and therefore the level of sexual activity; and of viral load which determines the probability of infection in each sexual encounter.
There are several assumptions made in the model. The sexual contact network is assumed to not change over the course of simulations. As detailed below, this assumption is based on a well-documented study by [33] that indicated that this particular connected component of a larger network remained unchanged for several years during their study. Model parameter values have been obtained from several literature sources, documented in Table 1. Further, percent of individuals to receive ART was determined a priori. We conducted three sets of simulations, in which the probability of any individual to receive ART was set at 0, 0.3 and 1. Zero probability of receiving ART corresponds to the early period when ART was not available; probability of 1 is an extreme, ideal case of everyone receiving ART; and probability of 0.3 represents a more realistic scenario that reflects CDC’s overall epidemiologic estimate that in the USA about a third of people with HIV are taking ART regularly [48].
Table 1. Model Parameters.
| Parameter definition | Symbol | Value | Reference |
|---|---|---|---|
| General Mortality Rate | GenMortalityRate | 0.0012 | [86] |
| Treatment Failure Rate | TreatmentFailureRate | 0.0025 | [54] |
| Infected CD4+ count at time zero | InitialInfCD4 | 0 | |
| Viral Load at time zero | InitialViralLoad | 10-3 viral particles mm-3 | [57] |
| Uninfected CD4+ count at time zero | InitialUninfCD4 | N (700, 100) cells mm-3 | [87] |
| Death rate of free virus | c | 2.4 viral particles day-1 | [57] |
| Rate of CD4+ supply from precursors | sT | 10 cells day-1 mm-3 | [57] |
| Rate of CD4+ proliferation | pT | 3 10-2 cells day-1 | [57] |
| Death rate of productively infected CD4+ | δ | 2.4 10-1 cells day-1 | [57] |
| Number of free virus produced by lysing a CD4+ cell | N | 1200 viral particles | [57] |
| Death rate of uninfected CD4+ | dT | 2.4 10-1 cells day-1 | [57] |
| Rate constant of CD4+ infection by free virus | k | 2.4 10-5 cells mm-3 day-1 | [57] |
| Set Point | Mp | LogN (9.22, 1.8) viral particles mm-3 | [53] |
| Probability of improvement on Regimens 1 and 2 | p_EventImpr | 0.47 | [61] |
| Probability of CD4+ increase under viral suppression | p_EventCD4 | 0.87 | [64] |
| Probability of improvement on salvage regimen | p_EventImprAfterFailure | 0.38 | [62] |
| Rate of viral load increase if therapy unsuccessful | AddRateVLIncrease | 1.6 10-3 viral particles month-1 mm-3 | [65] |
| Rate of CD4+ increase if therapy successful | RateCD4Increase | 13.33 cells month-1 mm-3 | [61] |
| Rate of viral load decrease if therapy successful | Baseline to undetectable in 2 months | [88] | |
| Rate of viral load increase with AIDS | RateVLIncreaseAfterFailure | 3.4 10-4 viral particles month-1 mm-3 | [66] |
| Rate of CD4+ decrease with AIDS | RateCD4DecreaseAfterFailure | 5 cells month-1 mm-3 | [66] |
| Rate of CD4+ decline in asymptomatic phase | RateCD4DecreaseAsymptom_1, 2, 3, 4, 5 | 3.02 if Vsp ≤ 0.25 | [53] |
| 3.73 if 0.25 < Vsp ≤ 1.5 | |||
| 4.6 if 1.5 < Vsp ≤ 5 | |||
| 5.4 if 5 < Vsp ≤ 15 | |||
| 6.37 if Vsp > 15 | |||
| Mortality rate on ART | MortalityRateOnART_1, 2, 3, 4, 5, 6 | 0.0016 if CD4+ < 25 | [67] |
| 0.0013 if 25 ≤ CD4+ < 50 | |||
| 0.003 if 50 ≤ CD4+ < 100 | |||
| 0.0041 if 100 ≤ CD4+ < 200 | |||
| 0.0032 if 200 ≤ CD4+ < 350 | |||
| 0.0031 if CD4+ ≥ 350 | |||
| Number of unprotected insertive anal intercourse (UIAI) acts per month | NumberUIAI_1, 2, 3, 4, 5, 6, Acute | 0.081 if CD4+ ≤ 50 | [69] |
| 1.45 if 50 < CD4+ ≤ 100 | |||
| 0.55 if 100 < CD4+ ≤ 200 | |||
| 2.69 if 200 < CD4+ ≤ 300 | |||
| 1.11 if 300 < CD4+ ≤ 500 | |||
| 1.25 if CD4+ > 500 | |||
| 1.87 if in Acute Infection phase | |||
| Transmission probability per act of UIAI (transmissibility) | TrPr_1, 2, 3, 4, 5, Acute | 0.0008 if Viral Load ≤ 0.25 | [69] |
| 0.0088 if 0.25 < Viral Load ≤ 1.5 | |||
| 0.0096 if 1.5 < Viral Load ≤ 5 | |||
| 0.011 if 5 < Viral Load ≤ 15 | |||
| 0.065 if Viral Load > 15 | |||
| 0.065 if in Acute Infection phase |
Below we present the model in more detail, starting with scale 2, namely the patient disease progression and state of health. This section is followed by description of scale 1, the within-host processes associated with each health state. These processes drive transitions between health states. The disease transmission model in an actual MSM population is then presented (scale 3). Finally, we discuss the uncertainty and sensitivity analysis of model outcomes.
Disease progression and health states
States of the disease progression model correspond to clinically defined disease stages (Figure 1B). Acute infection is marked by lack of immune responses and uncontrolled viral replication with high viral loads and relatively large amounts of genital shedding of HIV-1 [49,50]. Viremia rises rapidly to a peak, then declines as the immune system starts to exert partial control [51]. In the chronic asymptomatic phase of infection the viral load reaches a quasi-steady state called the set point, which varies between persons and which determines a relatively constant rate of CD4+ T cell decline. If left untreated, the onset of clinical AIDS characterized by opportunistic infections and/or CD4+ T cell count less than 200 cells per µl of blood, takes place 4-10 years after the infection [52], but the standard of care is the institution of ART before this point.
Medical treatment significantly extends the duration of the asymptomatic phase [53]. However, under ART pressure the virus mutates and eventually becomes resistant to applied therapy. As a result, the virus load begins to steadily increase, and the treatment must be modified [54]. ART can be initiated at any time from acute infection through the asymptomatic phase in this model. Treatment affects both the viral load and CD4+ T cell count, therefore altering the transmission probability [50].
Four consecutive regimens are modeled and assigned typical rates of response with disease stabilization (reconstitution of CD4+ T cells and reduction of viral load to undetectable levels), and failure over time leading to the next treatment.
The model allows for simulation of treatment scenarios. If treatment is initiated in the acute infection phase, patients move directly to Regimen 1, skipping the asymptomatic phase. Otherwise patients enter the asymptomatic phase before Regimen 1 is initiated. The model is easy to modify as more regimens become available, or as their efficacy changes.
As individuals die of various causes, they enter the Removed state. Probabilities of transitions to the Removed state correspond to mortality rates, which vary depending on the state of health [55,56].
Within-host models for each health state
For each individual we trace two key parameters: the viral load and the CD4+ cell count. The coupled dynamics of virus and CD4+ populations drive the transitions between disease stages (Figure 1B). Figure 1A demonstrates a simulation sample of viral load evolution during different stages of disease progression, under two treatment initiation scenarios. The viral load is typically lower in the case of early ART initiation. Below we describe the within-host models of viral and CD4+ population dynamics used in generating Figure 1A.
Acute infection
Healthy individuals are at risk of acquiring HIV-1 if their sexual partners are infected. Once infected, an individual enters the acute infection phase. The acute infection phase is modeled after Perelson and Nelson [57]. Three cell populations are considered: uninfected CD4+ cells T, productively infected CD4+ cells T* and free virus V:
| (1) |
The definitions and values of parameters are in Table 1. Equations (1) are solved numerically in MatLab over 10 weeks after the infection event, which is a typical duration of the acute infection phase. At 10 weeks the simulation for the acute infection stage is terminated and the patient enters the asymptomatic stage.
Asymptomatic phase
The asymptomatic phase is treated as the period where the CD4+ count decays linearly in untreated patients, with slope m determined by the log-normally distributed set point logN (9.22, 1.8) [53]. The viral load remains constant at the set point level, as there is a quasi-steady state during the chronic asymptomatic phase of infection [58,59,60]. Transition to Regimen 1 takes place when the CD4+ count falls below a predetermined threshold.
Treatment regimens
Clinicians treating patients have choices between many treatment regimens. Generally, all commonly utilized treatment regimens include a combination of three drugs: two nucleoside reverse transcriptase inhibitors (NRTIs) and a non-nucleoside reverse transcriptase inhibitor (NNRTI), or two NRTIs and a protease inhibitor (PI) [40]. These are considered "first line therapies" with equal efficacy. Given the number of medications available, it is usually possible to have two first line therapies plus a maintenance regimen that do not overlap in drug resistance patterns, and patients can use these therapies sequentially without loss of efficacy if they have failed their first treatment regimen due to factors such as poor adherence and development of drug resistance [61]. Following regimens are considered "second line" and necessarily include re-use of dual NRTIs for which some resistance mutations have occurred during the first and second regimens, and therefore have lesser efficacy. These are often described as "salvage" or "rescue" regimens [62].
Regimens 1 and 2 of our model correspond to the first line therapies. For either regimen, each patient is assumed to have 0.47 probability of suppressing the virus, i.e. improving on a given regimen [61,63], about 87% of these patients experience restoration of CD4+ counts [64]. The monthly rate of CD4+ increase is about 13.33 cells/mm3 [61].
In patients not responding well to ART, the inability of drugs to suppress the viral load leads to its steady increase at a monthly rate of about 0.0016 virions/mm3 [65]. Once the viral load exceeds 0.2 viral particles/mm3, the regimen has failed, and the next regimen is initiated.
The salvage regimen is less efficacious than the first two: viral load suppression probability is 0.38 [62]. Changes in the CD4+ count and viral load are calculated as before. Failure of the salvage regimen leads to increased incidence of opportunistic infections and placement of patients on a “maintenance” regimen [66,67,68]. While on maintenance therapy, the viral load increases at a steady rate of 3.4 10-4 viral particles/mm3/month, while the CD4+ count decreases at 5 cells/mm3/month [66]. Mortality rates of patients on ART, i.e. probabilities of transitioning to state Removed, are documented in [55] (Table 1).
Scenarios of interventions tested
HIV-1 spread was simulated over a period of 3 years, with a monthly time step, i.e. all parameters and transitions from one health state to another were updated once a month. This time frame was chosen to satisfy the static network assumption [33], while allowing sufficient time to study the temporal spread of disease.
Three scenarios were simulated, testing the effects of initiating ART at different stages of disease (Figure 1B). The first scenario corresponds to starting ART when CD4+ T cell count drops below 200 cells/mm3; this is the only treatment strategy that has been shown to definitively improve survival in clinical studies to date. The second scenario corresponds to current treatment guidelines of starting ART when CD4+ T cells drop below 350 cells/mm3 and/or the viral load exceeds 50 viral particles/mm3 during the chronic asymptomatic phase, which is based on consensus expert opinion [40]. The third scenario is the debated strategy of initiating ART during acute infection [35]. The impact of these medical strategies on HIV-1 spread is analyzed.
Percent of individuals to receive ART was determined a priori. We conducted three sets of simulations, in which the probability of any individual in the acute infection stage to receive ART was set at 0, 0.3 and 1. In case a patient was chosen to receive ART, he would go through all regimens from regimen 1 to maintenance (Figure 1B), with ART initiated according to the scenario being simulated.
Transmission model
Transmission characteristics
At the level of individuals, we utilize two key clinical parameters to determine if transmission takes place: CD4+ T cell count is the key predictor of health status [40] and therefore of likelihood to engage in sexual activity [69]; and viral load is an indicator of HIV-1 shedding and risk of transmission during sexual contact [14,69]. In each contact, transmission occurs with probability equal to the product of sexual intercourse frequency and risk of transmission, which are tabulated as functions of CD4+ count and viral load, respectively (Table 1). Intercourse frequency is expressed as the number of unprotected insertive anal intercourse (UIAI) acts per month, which leads to the highest exposure to HIV-1 [69].
Network of sexual contacts
The model was validated with the sexual network originally described by Potterat et al, based on the analysis of community-wide contact tracing records [33]. The dataset contained 1933 partners, out of which 250 belonged to the largest connected component during the first five years of the study. We use this component for our simulations, as it remained virtually unchanged during that time and we could safely assume that the network was static in the sense that the edges representing sexual contacts remained the same. From the 250 subjects, we retained 231 homosexual and bisexual males and excluded 19 females and heterosexual males. These 19 individuals were on the periphery of the network, and their removal did not break the component. The network structure and information was obtained from Figure 2A of [33], and re-drawn in Figure 1C with Pajek software [70]. The distribution of the number of sexual partners in this community was uneven: most individuals had less than 5 sexual partners, while two had 20 partners each. At the time of data collection, about 41% were positively diagnosed for HIV, 34% were negative and the HIV status of 25% was not known[33,70].
Uncertainty and sensitivity analysis
Special numerical methods are needed to analyze the behavior of complex mathematical models such as ours, as well as the effect of model parameters on its output. Uncertainty analysis assesses the variability of model outcomes due to uncertainty in estimation of input parameters, while sensitivity analysis extends the uncertainty analysis by evaluating the importance of input parameters [71]. Both are powerful tools designed to investigate the behavior of complex models with uncertain input parameters [72].
We used the Latin Hypercube Sampling (LHS) scheme, one of the most computationally efficient methods for uncertainty analysis [72,73,74]. In this method, input parameters are treated as random variables, each with its own probability distribution function. Parameter values are chosen randomly from their respective stratified distribution functions; input vectors are thus created containing parameter values for model simulations. The model is then run several times, each time with a new set of input parameter values, and its output is recorded. This completes the uncertainty analysis; next the sensitivity analysis is performed, here with factor prioritization by reduction of variance used to rank the importance of parameters to model outcomes. This method is applied when the relationship between the outcome and input parameters is highly nonlinear, which is the case here [75]. Sensitivity indices produced for each input parameter are interpreted as the proportion of total output variance attributable to the given parameter [72]. We implemented the analysis with MatLab-based SaSAT software [75].
Results
Epidemiology
The temporal propagation of disease for varying probability of receiving ART, pART = 0, 0.3, 1 is shown in Figure 2. The case of pART = 0 refers to years before introduction of ART; pART = 0.3 represents an assumption that currently about 30% of infected individuals receive ART; pART = 1 represents an ideal situation where ART is received by all infected individuals.
Figure 2. Temporal propagation of disease within 3 years for three scenarios of ART initiation timing.

In all simulations a patient with 20 sexual partners is infected at time zero. Three scenarios of ART initiation are simulated: at the CD4+ cutoff below 200 cells/mm3, 350 cells/mm3 and in acute infection phase. (A) No one receives ART; (B) about 30% of infected individuals receive ART; (C) all infected individuals receive ART.
In each case, all three scenarios of ART initiation timing are tested, with 100 simulations performed for each scenario. At time zero, one of the two individuals with the highest number of sexual contacts (twenty) is infected, while the rest of the population is healthy and therefore susceptible to disease. When no ART is available to anyone (Figure 2A), all three scenarios converge into the same curve, as expected. At the end of the 3-year simulation, about 8% of the population is infected. With pART=0.3 and ART initiation in the acute infection phase, at 3 years less than 7% of population are infected (Figure 2B); with pART=1, about 3% are infected (Figure 2C). The reduction of 0.01 in fraction infected at the end of the simulation (Figure 2B, p_ART=0.3) translates into a maximum of about 7.5 patient-years over 3 years. This number would then translate into a respective reduction in ART medication for the whole population. Collectively, these results indicate that significant reduction in the fraction of infected individuals could be achieved by initiating ART as early as possible, and by administering it to as many individuals as possible.
The results also indicate that initiating ART at CD4+ T cell counts of 200 versus 350 cells/mm3 demonstrates minimal difference in the spread of HIV-1. For pART=1 (Figure 2C), the difference is about 8.4 versus 8.1% at 3 years, while ART initiation during acute infection markedly decreases the fraction of infected persons (to about 3.5% at 3 years). A similar picture arises in pART=0.3 (Figure 2B). Therefore, modifying ART initiation threshold during chronic infection (first two scenarios) had a small effect at the population level.
The number of patients infected at time zero is an important factor in the dynamics of disease spread. We ran a simulation with a larger initial number (about 10% of entire population) of infected individuals (Figure 3). In this case a much higher fraction of individuals are infected at 3 years in all scenarios, as expected. Similarly to the case of only one highly connected individual infected at time zero (Figure 2C), ART initiation during acute infection blunts the spread of the virus compared to later ART initiation (10.8% for early ART versus 13.5% and 13.7% for ART starting at CD4+ T cell counts of 200 and 350). Notably, for both initial conditions, there is an early phase of rapid HIV-1 spread that is particularly suppressed by early ART, likely due to aggressive early spread of disease by contagious persons with acute infection (high viral loads). Thus, ART initiation during the acute infection phase significantly alters the course of the epidemic, and results in much lower fractions of infection in the long term.
Figure 3. A cluster containing 10% of the population is infected at time zero, all infected individuals receive ART.

ART initiation scenarios are as in Figure 2. The simulation is performed to test the response of the model to an increase of the number of patients infected at time zero.
To test the model predictions we simulated a situation with no ART available to anyone, and with both highly connected individuals infected at time zero (Figure 4). This situation is likely to have arisen in Colorado Springs in the mid 80s, when no ART was available. Simulations indicate that at 5 years the fraction of infected individuals averaged to about 40%, which is in excellent agreement with data from Colorado Springs where 41% are HIV positive [33].
Figure 4. The two individuals with the highest number of sexual partners (20) are infected at time zero.
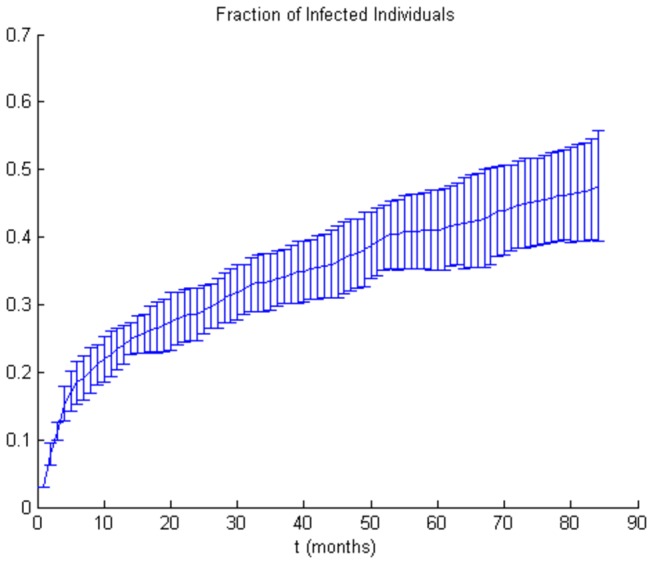
No one receives ART. The simulation is performed to test the response of the model to the impact of highly connected individuals.
Our results also agree with the conclusions of a recent study by Granich and co-workers [36] who looked at possible outcomes of universal HIV testing with immediate initiation of ART. Their model was based on general population data from South Africa. Similarly to our results (Figure 4), the authors predicted a 6% increase in new infection cases in the course of a year in a scenario without ART. They also modeled a scenario in which individuals would be tested on a yearly basis and, if tested positive, would immediately be offered ART. In this scenario not all newly diagnosed individuals would still be in the acute infection phase and many would have progressed into the asymptomatic phase, however the results generally agree with our conclusions. Our model predicts a 56% drop at 3 years in the fraction of infected individuals who are offered ART in the acute infection phase (Figure 2C) as opposed to those who are not offered ART (Figure 2A). Granich and co-workers calculated a 45% difference in HIV prevalence between no ART and immediate ART initiation upon positive HIV test scenario. This re-affirms that starting ART in the acute infection phase is likely to be highly efficient in curbing the spread of disease.
Uncertainty and sensitivity analysis
Uncertainty and sensitivity analysis were conducted for all three scenarios of ART timing initiation; for each scenario 200 simulations were performed. The model output is the fraction of infected individuals; parameter values are sampled from respective probability distributions (Table 2). The results are shown in Table 3. In both scenarios of late ART initiation, the parameter responsible for most of disease spread variability is Mp, the viral set point; it accounts for 94% and 86.6% of model output variability in cases of ART initiation below CD4+ count of 200 cells/m3 and 350 cells/m3 respectively. The contribution of the rest of model parameters is negligible (less than 2% each in either scenario).
Table 2. Parameter distributions for uncertainty and sensitivity analysis.
| ParameterName | Distribution1 | Argument 12 | Argument 2 |
|---|---|---|---|
| GeneralMortalityRate | U | 5.75 ⋅ 10-5 | 1.73 ⋅ 10-4 |
| TreatmentFailureRate | U | 0 | 5 ⋅ 10-3 |
| CD4AsymptomPhaseCutoff | D | 2 ⋅ 102 | |
| InitialUninfCD4 | N | 7 ⋅ 102 | 102 |
| InitialInfCD4 | D | 0.00 | |
| InitialViralLoad | U | 5 ⋅ 10-1 | 5 ⋅ 106 |
| TrPr_Acute | U | 4.4 ⋅ 10-2 | 8.6 ⋅ 10-2 |
| TrPr_1 | U | 5.4 ⋅ 10-4 | 10-3 |
| TrPr_2 | U | 5.9 ⋅ 10-3 | 1.2 ⋅ 10-2 |
| TrPr_3 | U | 6.4 ⋅ 10-3 | 1.3 ⋅ 10-2 |
| TrPr_4 | U | 7.4 ⋅ 10-3 | 1.5 ⋅ 10-2 |
| TrPr_5 | U | 1.2 ⋅ 10-2 | 2.4 ⋅ 10-2 |
| NumberUIAI_1 | G | 7.1 ⋅ 10-1 | 2.65 |
| NumberUIAI_2 | G | 7.1 ⋅ 10-1 | 1.15 |
| NumberUIAI_3 | G | 7.1 ⋅ 10-1 | 2.05 |
| NumberUIAI_4 | G | 7.1 ⋅ 10-1 | 7.8 ⋅ 10-1 |
| NumberUIAI_5 | G | 7.1 ⋅ 10-1 | 3.80 |
| NumberUIAI_6 | G | 7.1 ⋅ 10-1 | 1.57 |
| NumberUIAI_7 | G | 7.1 ⋅ 10-1 | 1.77 |
| MortalityRateOnTreatment_1 | U | 8 ⋅ 10-4 | 2.4 ⋅ 10-3 |
| MortalityRateOnTreatment_2 | U | 6.5 ⋅ 10-4 | 1.9 ⋅ 10-3 |
| MortalityRateOnTreatment_3 | U | 1.5 ⋅ 10-3 | 4.5 ⋅ 10-3 |
| MortalityRateOnTreatment_4 | U | 2.5 ⋅ 10-3 | 6.1 ⋅ 10-3 |
| MortalityRateOnTreatment_5 | U | 1.6 ⋅ 10-3 | 4.8 ⋅ 10-3 |
| MortalityRateOnTreatment_6 | U | 1.5 ⋅ 10-3 | 4.6 ⋅ 10-3 |
| p_eventImpr | U | 10-1 | 6 ⋅ 10-1 |
| p_eventCD4 | U | 5 ⋅ 10-1 | 1.00 |
| AddRateVLDecrease | U | 10-3 | 3 ⋅ 10-3 |
| RateCD4Increase | U | 6.67 | 20.0 |
| AddRateVLIncrease | U | 8 ⋅ 10-4 | 2.4 ⋅ 10-3 |
| c | U | 1.20 | 3.60 |
| sT | U | 1.5 ⋅ 102 | 4.5 ⋅ 102 |
| pT | U | 4.5 ⋅ 10-1 | 1.35 |
| Tmax | U | 7.5 ⋅ 102 | 2.25 ⋅ 102 |
| dT | U | 3 ⋅ 10-1 | 9 ⋅ 10-1 |
| k | U | 3.6 ⋅ 10-4 | 1.1 ⋅ 10-3 |
| delta | U | 3.60 | 1.08 ⋅ 101 |
| N | U | 6 ⋅ 102 | 1.8 ⋅ 103 |
| Mp | LN | 9.22 | 1.80 |
| p_eventImprAfterFailure | U | 0.00 | 5 ⋅ 10-1 |
| RateVLIncreaseAfterFailure | U | 1.7 ⋅ 10-4 | 5.1 ⋅ 10-4 |
| RateCD4DecreaseAfterFailure | U | 2.50 | 7.50 |
| RateCD4DecreaseAsymptom_1 | U | 1.51 | 4.53 |
| RateCD4DecreaseAsymptom_2 | U | 1.87 | 5.60 |
| RateCD4DecreaseAsymptom_3 | U | 2.30 | 6.90 |
| RateCD4DecreaseAsymptom_4 | U | 2.70 | 8.10 |
| RateCD4DecreaseAsymptom_5 | U | 3.19 | 9.56 |
| p_ART | N | 4 ⋅ 101 | 10 |
U(Uniform), N(Normal), G(Gamma), D(Deterministic)
For Uniform distribution, Argument1 is the minimum, Argument 2 is the maximum of the range
For Normal and LogNormal distributions, Argument1 is the mean, Argument 2 is the standard deviation
For Gamma distribution, Argument1 is the shape parameter, Argument 2 is the scale parameter
Table 3. Sensitivity indices (above 0.05 in bold) representing proportion of total variance attributable to the given parameter.
| Parameter | Scenario 1: Treatment start at CD4≤200 | Scenario 2: Treatment start at CD4≤350 | Scenario 3: Treatment start in Acute Infection |
|---|---|---|---|
| Mp | 0.94 | 0.86 | 0.19 |
| p_eventCD4 | 0.000066 | 0.0002 | 0.077 |
| NumberUIAI_5 | 0.002 | 0.006 | 0.069 |
| MortalityRateOnTreatment_3 | 0.005 | 0.002 | 0.065 |
| NumberUIAI_6 | 0.002 | 0.01 | 0.064 |
In the case of ART initiation in the acute infection phase, the viral set point remains the most influential parameter, albeit with a much lower sensitivity index at 19.1%. It appears that early ART initiation blunts the large effect of the viral set point. Its contribution to the output variability is balanced by four other parameters: p_eventCD4, the probability of CD4+ increase under viral suppression (7.7%); MortalityRateOnTreatment_3, the mortality rate while on ART, with CD4+ count between 50 and 100 cells/mm3 (6.5%); and the number of UIAI acts per month with the CD4+ count above 500 cells/mm3 (6.9%) and during the acute infection phase (6.4%). The contribution of each of the remaining parameters to the spread of disease is below 5%.
The viral set point is a major indicator of the course of disease following the end of the acute infection phase, and is highly correlated with the CD4+ count decay in the asymptomatic phase and with viral activity [53]. So, it is not surprising that in cases of late ART initiation when the disease develops according to its natural pace for an extended duration of time, the viral set point plays a major role. The CD4+ count is a general indicator of an individual’s health state and of sexual activity [69] (Table 1), hence the significance of p_eventCD4. The importance of UIAI acts per month, particularly during acute infection, is in accord with evidence that as high as 48% of transmission cases take place during the acute infection phase [76], and with our results demonstrating the difference that early ART initiation makes in disease propagation (Figure 2).
Discussion
Multi-scale modeling provides a possibility for studying relationships between processes on different scales within the same framework. The integration of models at microbiologic, individual host, and population scales offers a medium to examine how the effects of individual interventions scale across the entire framework. Our model takes this approach to capture how the dynamics of disease progression in individuals affect HIV-1 spread within an MSM population. This allows for simulation of medical interventions, such as varying treatment strategies, drug efficacies, and prevention strategies. For example, this modeling framework would be suited for evaluating the impact of interventions such as the effect of ART initiation upon detection of HIV during once-yearly testing and treatment, behavioral changes, implementation of a vaccine that reduces viral load without preventing infection, and modification of community-wide treatment recommendations.
We have tested the model in simulations of altering the ART initiation timing, a topic of current controversy [34,35,39]. The problem of treatment initiation timing is an excellent example of intricacies of decision-making in complex diseases that evolve on multiple scales. On the one hand, deferring ART would delay the development of drug resistance and preserve therapeutic options, reduce the accumulated effects of drug toxicity, and conserve potentially limited resources. On the other hand, the longer period off treatment could render infected persons more contagious and allow greater spread of virus. Our simulations, utilizing several biologically observed parameters, have addressed this latter factor by estimating how different interventions on the microbiologic scale affect population-wide spread of HIV-1. These simulations suggest that altering the timing of ART initiation during chronic infection has a minimal impact on community transmission (suggesting that patients can be saved the misery of the heavy ART medication, and society the costs of additional ART by not treating at 350 CD4+ cells/mm3), but that routinely starting ART during acute infection could have a major role in reducing spread.
These results are encouraging support for our model, in light of several clinical observations regarding the immunopathogenesis of HIV-1 infection. Potent ART regimens developed since the mid-1990s are successful at suppressing viral replication within infected persons, thereby halting or reversing disease progression and extending the asymptomatic phase of infection in association with reducing viral replication as measured by viral load [14,15]. Viral replication is also a key factor in host-host transmission of HIV-1; and viral load is a strong predictor of the risk of transmission per exposure. Acute infection is characterized by extremely high viral loads and virus shedding in genital secretions [49,50], and this probably explains the observation that acutely-infected individuals contribute disproportionately to HIV-1 spread, with an 8 to 20 fold increase in odds of transmission per coital act [14]. It is estimated that as high as 48% of all cases of HIV-1 transmission occur when the transmitting host is within the first five months of being infected [76]. Thus, our model yields results that are compatible with the biological principles of HIV-1 infection, suggesting that suppression of viral replication with ART in the early stage of infection mediates a disproportionate effect in preventing transmission compared to starting ART during chronic infection. This is consistent with a hypothesized benefit of early treatment in attenuating the spread of HIV-1 [14,26,49,50,76,77,78]. Several recent studies also concluded that universal and if possible early administration of ART is a powerful way to prevent the spread of the disease [36,37,79]
A major obstacle to early implementation of ART is the timely diagnosis of early HIV-1 infection, primarily due to absence of specific and recognizable symptoms. To aggravate the problem, routine HIV-1 antibody tests remain negative for several weeks past initial infection. More sensitive, virus-specific tests such as HIV p24 antigen ELISA and HIV nucleic acid amplification assays are available but they are expensive and prone to high (1%) false-positive rates.
Strategies however can be and are being developed to meet these challenges. The blood-banking industry routinely combines antibody and HIV RNA tests, such as initial screening of specimens using antibody testing followed by blood pooling prior to HIV RNA testing. These strategies are being extended to clinical testing in Swiss, US and Indian studies.
Interestingly, acute HIV-1 infection is not rare in clinical-testing groups [80,81,82], especially in hyperendemic regions such as India and Malawi [83,84]. Hence, a combination of accurate testing strategies and screening/tracing programs such as for instance “network notification” whereby partners of HIV-positive individuals are notified of their need for HIV testing [85] could potentially dramatically increase the level of acute infection detection.
A potential development of the model would be the use of dynamic network models from following MSM or mixed communities over time. Other macro-scale issues that could be incorporated include the cost of ART and limited distribution of drugs in resource-poor locales. At the individual scale, adherence to therapy and host-specific microbiologic factors could be included. At the microbiologic scale, designating viral loads as a single determining factor with stochastic variation in set-point is an oversimplification of complex processes. Further defining lower scales such as HIV-1 evolution and mutation, host immunity, metabolism and genetic background, may be important to provide more accurate predictions of ART and vaccine efficacy, and drug toxicity.
Ultimately, the goal is for medical decision-making to significantly benefit from utilization of multi-scale models. Such models are particularly needed for chronic infectious diseases such as HIV-1 infection, where individual medical interventions are likely to have effects on the pattern of the epidemic, and where public policy decisions are likely to affect individuals. Thus a systems-based approach is crucial to gauge and predict benefits and risks across all scales. Our proposed model has potential applications where such multi-scale considerations are important, as we have demonstrated by examining an ongoing unresolved clinical question regarding timing of ART initiation.
Acknowledgments
We thank Mark Newman (University of Michigan, Ann Arbor) and Filippo Menczer (Indiana University) for stimulating discussions; David Wilson and Alexander Hoare (University of New South Wales, Australia) for assistance with SaSAT.
Funding Statement
This work was partially supported by the Ruth Kirchstein National Service Award (NIH) and the NIAID grant AI043203. The funders had no role in study design, data collection and analysis, decision to publish, or preparation of the manuscript.
References
- 1. Ahn AC, Tewari M, Poon C-S, Phillips AN (2006) The clinical applications of a systems approach. PLoS Med 3: 0956-0960. PubMed: 16683861. [DOI] [PMC free article] [PubMed] [Google Scholar]
- 2. Bailey (1975) The mathematical theory of infectious diseases and its application. London: Griffin. [Google Scholar]
- 3. Kermack WO, McKendrick AG (1927) Contributions to the mathematical theory of epidemics. Part I. Proceedings of the Royal Society of London S A115 pp. 700-721. [Google Scholar]
- 4. Anderson RM, May RM (1991) Infectious diseases of humans. Oxford: Oxford University Press. [Google Scholar]
- 5. Eames KTD, Keeling MJ (2002) Modeling dynamic and network heterogeneities in the spread of sexually transmitted diseases. Proc Natl Acad Sci U S A 99: 13330-13335. doi: 10.1073/pnas.202244299. PubMed: 12271127. [DOI] [PMC free article] [PubMed] [Google Scholar]
- 6. Girvan M, Callaway DS, Newman MEJ, Strogatz SH (2002) Simple model of epidemics with pathogen mutation. Physical Review E 65: 031915 PubMed: 11909117. [DOI] [PubMed] [Google Scholar]
- 7. Longini IM (1980) A Chain Binomial Model of Endemicity. Mathematical Biosciences 50: 85-93. doi: 10.1016/0025-5564(80)90123-6. [DOI] [Google Scholar]
- 8. Tuckwell HC, Toubiana L (2007) Dynamical modeling of viral spread in spatially distributed populations: stochastic origins of oscillations and density dependence. Biosystems 90: 546-559. doi: 10.1016/j.biosystems.2006.12.006. PubMed: 17324498. [DOI] [PMC free article] [PubMed] [Google Scholar]
- 9. Pastor-Satorras R, Vespignani A (2001) Epidemic dynamics and endemic states in complex networks. Physical Review E 6306: 066117 PubMed: 11415183. [DOI] [PubMed] [Google Scholar]
- 10. Eubank S, Guclu H, Kumar VSA, Marathe MV, Srinivasan A et al. (2004) Modelling disease outbreaks in realistic urban social networks. Nature 429: 180-184. doi: 10.1038/nature02541. PubMed: 15141212. [DOI] [PubMed] [Google Scholar]
- 11. Meyers LA, Pourbohloul B, Newman MEJ, Skowronski DM, Brunham RC (2005) Network theory and SARS: predicting outbreak diversity. J Theor Biol 232: 71-81. doi: 10.1016/j.jtbi.2004.07.026. PubMed: 15498594. [DOI] [PMC free article] [PubMed] [Google Scholar]
- 12. Breban R, Vardavas R, Blower S (2005) Linking population-level models with growing networks: A class of epidemic models. Phys Rev E Stat Nonlin Soft Matter Phys 72: 046110 PubMed: 16383471. [DOI] [PubMed] [Google Scholar]
- 13. Alvarez FP, Crépey P, Barthélemy M, Valleron AJ (2007) sispread: A software to simulate infectious diseases spreading on contact networks. Methods Inf Med 46: 19-26. PubMed: 17224976. [PubMed] [Google Scholar]
- 14. Pilcher CD, Eron JJ, Galvin S, Gay C, Cohen MS (2004) Acute HIV revisited: new opportunities for treatment and prevention. J Clin Invest 113: 937-945. doi: 10.1172/JCI21540. PubMed: 15057296. [DOI] [PMC free article] [PubMed] [Google Scholar]
- 15. Freedberg KA, Losina E, Weinstein MC, Paltiel AD, Cohen CJ et al. (2001) The cost effectiveness of combination antiretroviral therapy for HIV disease. N Engl J Med 344: 824-831. doi: 10.1056/NEJM200103153441108. PubMed: 11248160. [DOI] [PubMed] [Google Scholar]
- 16. Newman MEJ (2002) Spread of epidemic disease on networks. Physical Review E 66: - [DOI] [PubMed] [Google Scholar]
- 17. Keeling MJ, Eames KTD (2005) Networks and epidemic models. Journal of the Royal Society Interface 2: 295-307. doi: 10.1098/rsif.2005.0051. PubMed: 16849187. [DOI] [PMC free article] [PubMed] [Google Scholar]
- 18. Handcock MS, Jones JH (2004) Likelihood-based inference for stochastic models of sexual network formation. Theor Popul Biol 65: 413-422. doi: 10.1016/j.tpb.2003.09.006. PubMed: 15136015. [DOI] [PubMed] [Google Scholar]
- 19. Handcock MS, Jones JH (2006) Interval estimates for epidemic thresholds in two-sex network models. Theor Popul Biol 70: 125-134. doi: 10.1016/j.tpb.2006.02.004. PubMed: 16714041. [DOI] [PubMed] [Google Scholar]
- 20. Youm Y, Laumann EO (2002) Social network effects on the transmission of sexually transmitted diseases. Sex Transm Dis 29: 689-697. doi: 10.1097/00007435-200211000-00012. PubMed: 12438906. [DOI] [PubMed] [Google Scholar]
- 21. Watts DJ, Muhamad R, Medina DC, Dodds PS (2005) Multiscale, resurgent epidemics in a hierarchical metapopulation model. Proc Natl Acad Sci U S A 102: 11157-11162. doi: 10.1073/pnas.0501226102. PubMed: 16055564. [DOI] [PMC free article] [PubMed] [Google Scholar]
- 22. Hethcote HW (2000) The mathematics of infectious diseases. Siam Review 42: 599-653. doi: 10.1137/S0036144500371907. [DOI] [Google Scholar]
- 23. Sattenspiel L, Dietz K (1995) A Structured Epidemic Model Incorporating Geographic-Mobility among Regions. Math Biosci 128: 71-91. doi: 10.1016/0025-5564(94)00068-B. PubMed: 7606146. [DOI] [PubMed] [Google Scholar]
- 24. Halloran ME, Longini IM, Nizam A, Yang Y (2002) Containing bioterrorist smallpox. Science 298: 1428-1432. doi: 10.1126/science.1074674. PubMed: 12434061. [DOI] [PubMed] [Google Scholar]
- 25. Hethcote HW, Yorke JA, Nold A (1982) Gonorrhea Modeling - a Comparison of Control. Methods - Mathematical Biosciences 58: 93-109. doi: 10.1016/0025-5564(82)90053-0. [DOI] [Google Scholar]
- 26. Koopman JS, Jacquez JA, Welch GW, Simon CP, Foxman B et al. (1997) The role of early HIV infection in the spread of HIV through populations. J Acquir Immune Defic Syndr Hum Retrovirol 14: 249-258. doi: 10.1097/00042560-199703010-00009. PubMed: 9117458. [DOI] [PubMed] [Google Scholar]
- 27. Tuckwell HC, Toubiana L, Vibert JF (2001) Epidemic spread and bifurcation effects in two-dimensional network models with viral dynamics. Physical Review E 6404: - [DOI] [PubMed] [Google Scholar]
- 28. Van der Ploeg CPB, Van Vliet C, De Vlas SJ, Ndinya-Achola JO, Fransen L et al. (1998) STDSIM: A microsimulation model for decision support in STD control. Interfaces 28: 84-100. doi: 10.1287/inte.28.3.84. [DOI] [Google Scholar]
- 29. Fraser C, Hollingsworth TD, Chapman R, de Wolf F, Hanage WP (2007) Variation in HIV-1 set-point viral load: Epidemiological analysis and an evolutionary hypothesis. Proc Natl Acad Sci U S A 104: 17441-17446. doi: 10.1073/pnas.0708559104. PubMed: 17954909. [DOI] [PMC free article] [PubMed] [Google Scholar]
- 30. Shirreff G, Pellis L, Laeyendecker O, Fraser C (2011) Transmission Selects for HIV-1 Strains of Intermediate Virulence: A Modelling. Approach - PLOS Computational Biology 7. [DOI] [PMC free article] [PubMed] [Google Scholar]
- 31. Anderson RM, May RM, Boily MC, Garnett GP, Rowley JT (1991) THE SPREAD OF HIV-1 IN AFRICA - SEXUAL CONTACT PATTERNS AND THE PREDICTED DEMOGRAPHIC-IMPACT OF AIDS. Nature 352: 581-589. doi: 10.1038/352581a0. PubMed: 1865922. [DOI] [PubMed] [Google Scholar]
- 32. Hendriks JCM, Satten GA, Longini IM, van Druten HAM, Schellekens PTA et al. (1996) Use of immunological markers and continuous-time Markov models to estimate progression of HIV infection in homosexual men. AIDS 10: 649-656. doi: 10.1097/00002030-199606000-00011. PubMed: 8780820. [DOI] [PubMed] [Google Scholar]
- 33. Potterat JJ, Phillips-Plummer L, Muth SQ, Rothenberg RB, Woodhouse DE et al. (2002) Risk network structure in the early epidemic phase of HIV transmission in Colorado Springs. Sex Transm Infect 78: I159-I163. doi: 10.1136/sti.78.suppl_1.i159. PubMed: 12083437. [DOI] [PMC free article] [PubMed] [Google Scholar]
- 34. Kaufmann DE, Lichterfeld M, Altfeld M, Addo MM, Johnston MN et al. (2004) Limited durability of viral control following treated acute HIV infection. PLoS Med 1: 137-148. PubMed: 15526059. [DOI] [PMC free article] [PubMed] [Google Scholar]
- 35. Smith DE, Walker BD, Cooper DA, Rosenberg ES, Kaldor JA (2004) Is antiretroviral treatment of primary HIV infection clinically justified on the basis of current evidence? AIDS 18: 709-718. doi: 10.1097/00002030-200403260-00001. PubMed: 15075505. [DOI] [PubMed] [Google Scholar]
- 36. Granich RM, Gilks CF, Dye C, De Cock KM, Williams BG (2009) Universal voluntary HIV testing with immediate antiretroviral therapy as a strategy for elimination of HIV transmission: a mathematical model. Lancet 373: 48-57. doi: 10.1016/S0140-6736(08)61697-9. PubMed: 19038438. [DOI] [PubMed] [Google Scholar]
- 37. De Cock KM, De Lay P (2008) HIV/AIDS estimates and the quest for universal access. Lancet 371: 2068-2070. doi: 10.1016/S0140-6736(08)60732-1. PubMed: 18571714. [DOI] [PubMed] [Google Scholar]
- 38. Holmberg SD, Palella FJ, Lichtenstein KA, Havlir DV (2004) The case for earlier treatment of HIV infection. Clin Infect Dis 39: 1699-1704. doi: 10.1086/425743. PubMed: 15578373. [DOI] [PubMed] [Google Scholar]
- 39. SPARTAC (2013) Short-Course Antiretroviral Therapy in Primary HIV Infection. - New England Journal of Medicine 368: 207-217. doi: 10.1056/NEJMoa1110039. [DOI] [PMC free article] [PubMed] [Google Scholar]
- 40. OARAC (2006) Guidelines for the use of antiretroviral agents in HIV-1-infected adults and adolescents. DHHS Panel on Antiretroviral Guidelinies for Adults and Adolescents - A Working Group of the Office of AIDS Research Advisory Council (OARAC).
- 41. Rosenberg ES, Altfeld M, Poon SH, Phillips MN, Wilkes BM et al. (2000) Immune control of HIV-1 after early treatment of acute infection. Nature 407: 523-526. doi: 10.1038/35035103. PubMed: 11029005. [DOI] [PubMed] [Google Scholar]
- 42. Oxenius A, Price DA, Easterbrook PJ, O'Callaghan CA, Kelleher AD et al. (2000) Early highly active antiretroviral therapy for acute HIV-1 infection preserves immune function of CD8(+) and CD4(+) T lymphocytes. Proc Natl Acad Sci U S A 97: 3382-3387. doi: 10.1073/pnas.97.7.3382. PubMed: 10737796. [DOI] [PMC free article] [PubMed] [Google Scholar]
- 43. Altfeld M, Rosenberg ES, Shankarappa R, Mukherjee JS, Hecht FM et al. (2001) Cellular immune responses and viral diversity in individuals treated during acute and early HIV-1 infection. J Exp Med 193: 169-180. doi: 10.1084/jem.193.2.169. PubMed: 11148221. [DOI] [PMC free article] [PubMed] [Google Scholar]
- 44. Strain MC, Little SJ, Daar ES, Havlir DV, Gunthard HF et al. (2005) Effect of treatment, during primary infection, on establishment and clearance of cellular reservoirs of HIV-1. J Infect Dis 191: 1410-1418. doi: 10.1086/428777. PubMed: 15809898. [DOI] [PubMed] [Google Scholar]
- 45. Lori F, Jessen H, Lieberman J, Finzi D, Rosenberg E et al. (1999) Treatment of human immunodeficiency virus infection with hydroxyurea, didanosine, and a protease inhibitor before seroconversion is associated with normalized immune parameters and limited viral reservoir. J Infect Dis 180: 1827-1832. doi: 10.1086/315113. PubMed: 10558937. [DOI] [PubMed] [Google Scholar]
- 46. Lafeuillade A, Poggi C, Hittinger G, Counillon E, Emilie D (2003) Predictors of plasma human immunodeficiency virus type 1 RNA control after discontinuation of highly active antiretroviral therapy initiated at acute infection combined with structured treatment interruptions and immune-based therapies. J Infect Dis 188: 1426-1432. doi: 10.1086/379251. PubMed: 14624367. [DOI] [PubMed] [Google Scholar]
- 47. Sterne JAC, May M, Costagliola D, de Wolf F, Phillips AN et al. (2009) Timing of initiation of antiretroviral therapy in AIDS-free HIV-1-infected patients: a collaborative analysis of 18 HIV cohort studies. Lancet 373: 1352-1363. doi: 10.1016/S0140-6736(09)60612-7. PubMed: 19361855. [DOI] [PMC free article] [PubMed] [Google Scholar]
- 48. CDC (2011) New Hope for Stopping HIV.
- 49. Kassutto S, Maghsoudi K, Johnston MN, Robbins GK, Burgett NC et al. (2006) Longitudinal analysis of clinical markers following antiretroviral therapy initiated during acute or early HIV type 1 infection. Clin Infect Dis 42: 1024-1031. doi: 10.1086/500410. PubMed: 16511771. [DOI] [PubMed] [Google Scholar]
- 50. Pilcher CD, Tien HC, Eron JJ, Vernazza PL, Leu SY et al. (2004) Brief but efficient: Acute HIV infection and the sexual transmission of HIV. J Infect Dis 189: 1785-1792. doi: 10.1086/386333. PubMed: 15122514. [DOI] [PubMed] [Google Scholar]
- 51. Louzoun Y, Ganusov VV (2012) Evolution of viral life-cycle in response to cytotoxic T lymphocyte-mediated immunity. J Theor Biol 310: 3-13. doi: 10.1016/j.jtbi.2012.06.020. PubMed: 22735670. [DOI] [PubMed] [Google Scholar]
- 52. Pantaleo G, Graziosi C, Fauci AS (1993) The Immunopathogenesis of Human-Immunodeficiency-Virus. Infection - New England Journal of Medicine 328: 327-335. doi: 10.1056/NEJM199302043280508. [DOI] [PubMed] [Google Scholar]
- 53. Mellors JW, Muñoz A, Giorgi JV, Margolick JB, Tassoni CJ et al. (1997) Plasma viral load and CD4(+) lymphocytes as prognostic markers of HIV-1 infection. Ann Intern Med 126: 946-954. doi: 10.7326/0003-4819-126-12-199706150-00003. PubMed: 9182471. [DOI] [PubMed] [Google Scholar]
- 54. Robbins GK, De Gruttola V, Shafer RW, Smeaton LM, Snyder SW et al. (2003) Comparison of sequential three-drug regimens as initial therapy for HIV-1 infection. N Engl J Med 349: 2293-2303. doi: 10.1056/NEJMoa030264. PubMed: 14668455. [DOI] [PMC free article] [PubMed] [Google Scholar]
- 55. Egger M, Coll ATC (2006) Rates of disease progression according to initial highly active antiretroviral therapy regimen: A collaborative analysis of 12 prospective cohort studies. J Infect Dis 194: 612-622. doi: 10.1086/506362. PubMed: 16897660. [DOI] [PubMed] [Google Scholar]
- 56. Sackoff JE, Hanna DB, Pfeiffer MR, Torian LV (2006) Causes of death among persons with AIDS in the era of highly active antiretroviral therapy: New York City. Ann Intern Med 145: 397-406. doi: 10.7326/0003-4819-145-6-200609190-00003. PubMed: 16983127. [DOI] [PubMed] [Google Scholar]
- 57. Perelson AS, Nelson PW (1999) Mathematical analysis of HIV-1 dynamics in vivo. Siam Review 41: 3-44. doi: 10.1137/S0036144598335107. [DOI] [Google Scholar]
- 58. Mellors JW, Rinaldo CR, Gupta P, White RM, Todd JA et al. (1996) Prognosis in HIV-1 infection predicted by the quantity of virus in plasma. Science 272: 1167-1170. doi: 10.1126/science.272.5265.1167. PubMed: 8638160. [DOI] [PubMed] [Google Scholar]
- 59. Riddler SA, Mellors JW (1997) HIV-1 viral load and clinical outcome: review of recent studies. AIDS 11: S141-S148. PubMed: 9451978. [PubMed] [Google Scholar]
- 60. Vergis EN, Mellors JW (2000) Natural history of HIV-1 infection. Infectious Disease Clinics of North America 14: 809-+ [DOI] [PubMed] [Google Scholar]
- 61. Bartlett JA, DeMasi R, Quinn J, Moxham C, Rousseau F (2001) Overview of the effectiveness of triple combination therapy in antiretroviral-naive HIV-1 infected adults. AIDS 15: 1369-1377. doi: 10.1097/00002030-200107270-00006. PubMed: 11504958. [DOI] [PubMed] [Google Scholar]
- 62. Losina E, Islam R, Pollock AC, Sax PE, Freedberg KA et al. (2004) Effectiveness of Antiretroviral therapy after protease inhibitor failure: An analytic overview. Clin Infect Dis 38: 1613-1622. doi: 10.1086/420930. PubMed: 15156451. [DOI] [PubMed] [Google Scholar]
- 63. Thompson MA, Mugavero MJ, Amico KR, Cargill VA, Chang LW et al. (2012) Guidelines for Improving Entry Into and Retention in Care and Antiretroviral Adherence for Persons With HIV: Evidence-Based Recommendations From an International Association of Physicians in AIDS Care Panel. Ann Intern Med 156: 817-833. doi: 10.7326/0003-4819-156-11-201206050-00419. PubMed: 22393036. [DOI] [PMC free article] [PubMed] [Google Scholar]
- 64. Gandhi RT, Spritzler J, Chan E, Asmuth DM, Rodriguez B et al. (2006) Effect of baseline- and treatment-related factors on immunologic recovery after initiation of antiretroviral therapy in HIV-1-positive subjects: Results from ACTG 384. J Acquir Immune Defic Syndr 42: 426-434. doi: 10.1097/01.qai.0000226789.51992.3f. PubMed: 16810109. [DOI] [PubMed] [Google Scholar]
- 65. Weinstein MC, Goldie SJ, Losina E, Cohen CJ, Baxter JD et al. (2001) Use of genotypic resistance testing to guide HIV therapy: Clinical impact and cost-effectiveness. Ann Intern Med 134: 440-450. doi: 10.7326/0003-4819-134-6-200103200-00008. PubMed: 11255519. [DOI] [PubMed] [Google Scholar]
- 66. Deeks SG, Wrin T, Liegler T, Hoh R, Hayden M et al. (2001) Virologic and immunologic consequences of discontinuing combination antiretroviral-drug therapy in HIV-infected patients with detectable viremia. N Engl J Med 344: 472-480. doi: 10.1056/NEJM200102153440702. PubMed: 11172188. [DOI] [PubMed] [Google Scholar]
- 67. Chêne G, Sterne JA, May M, Costagliola D, Ledergerber B et al. (2003) Prognostic importance of initial response in HIV-1 infected patients starting potent antiretroviral therapy: analysis of prospective studies. Lancet 362: 679-686. doi: 10.1016/S0140-6736(03)14229-8. PubMed: 12957089. [DOI] [PubMed] [Google Scholar]
- 68. Egger M, May M, Chêne G, Phillips AN, Ledergerber B et al. (2002) Prognosis of HIV-1-infected patients starting highly active antiretroviral therapy: a collaborative analysis of prospective studies. Lancet 360: 119-129. doi: 10.1016/S0140-6736(02)09411-4. PubMed: 12126821. [DOI] [PubMed] [Google Scholar]
- 69. McCormick AW, Walensky RP, Lipsitch M, Losina E, Hsu H et al. (2007) The effect of antiretroviral therapy on secondary transmission of HIV among men who have sex with men. Clin Infect Dis 44: 1115-1122. doi: 10.1086/512816. PubMed: 17366461. [DOI] [PMC free article] [PubMed] [Google Scholar]
- 70. Batagelj V, Mrvar A (2002) Pajek - Analysis and visualization of large networks. Graph Drawing 2265: 477-478. doi: 10.1007/3-540-45848-4_54. [DOI] [Google Scholar]
- 71. Iman RL, Helton JC (1988) An Investigation of Uncertainty and Sensitivity Analysis Techniques for Computer-Models. Risk Analysis 8: 71-90. doi: 10.1111/j.1539-6924.1988.tb01155.x. [DOI] [Google Scholar]
- 72. Blower SM, Dowlatabadi H (1994) Sensitivity and Uncertainty Analysis of Complex-Models of Disease Transmission - an Hiv Model, as an Example. International Statistical Review 62: 229-243. doi: 10.2307/1403510. [DOI] [Google Scholar]
- 73. Mckay MD, Beckman RJ, Conover WJ (1979) Comparison of 3 Methods for Selecting Values of Input Variables in the Analysis of Output from a Computer Code. Technometrics 21: 239-245. doi: 10.2307/1268522. [DOI] [Google Scholar]
- 74. Seaholm SK, Ackerman E, Wu SC (1988) Latin Hypercube Sampling and the Sensitivity Analysis of a Monte-Carlo Epidemic Model. Int J Biomed Comput 23: 97-112. doi: 10.1016/0020-7101(88)90067-0. PubMed: 3065249. [DOI] [PubMed] [Google Scholar]
- 75. Hoare A, Regan DG, Wilson DP (2008) Sampling and sensitivity analyses tools (SaSAT) for computational modelling. Theor Biol Med Model 5: 4-. PubMed: 18304361. [DOI] [PMC free article] [PubMed] [Google Scholar]
- 76. Wawer MJ, Gray RH, Sewankambo NK, Serwadda D, Li XB, et al. (2005) Rates of HIV-1 transmission per coital act, by stage of HIV-1 infection, in Rakai, Uganda. Journal of Infectious Diseases 191: 1403-1409 [DOI] [PubMed] [Google Scholar]
- 77. Pilcher CD, Eron JJ, Vemazza PL, Battegay M, Harr T et al. (2001) Sexual transmission during the incubation period of primary HIV infection. JAMA 286: 1713-1714. doi: 10.1001/jama.286.14.1713. PubMed: 11594895. [DOI] [PubMed] [Google Scholar]
- 78. Tattevin P, Camus C, Arvieux C, Ruffault A, Michelet C (2007) Multiple organ failure during primary HIV infection. Clinical Infectious Diseases 44: E28-E29. doi: 10.1086/510683. PubMed: 17205433. [DOI] [PubMed] [Google Scholar]
- 79. Johnston KM, Levy AR, Lima VD, Hogg RS, Tyndall MW et al. (2010) Expanding access to HAART: a cost-effective approach for treating and preventing HIV. AIDS 24: 1929-1935. doi: 10.1097/QAD.0b013e32833af85d. PubMed: 20588171. [DOI] [PubMed] [Google Scholar]
- 80. Rosenberg ES, Caliendo AM, Walker BD (1999) Acute HIV infection among patients tested for mononucleosis. N Engl J Med 340: 969-969. doi: 10.1056/NEJM199903253401218. PubMed: 10094651. [DOI] [PubMed] [Google Scholar]
- 81. Pincus JM, Crosby SS, Losina E, King ER, LaBelle C et al. (2003) Acute human immunodeficiency virus infection in patients presenting to an urban urgent care center. Clin Infect Dis 37: 1699-1704. doi: 10.1086/379772. PubMed: 14689354. [DOI] [PubMed] [Google Scholar]
- 82. Clark SJ, Kelen GD, Henrard DR, Daar ES, Craig S et al. (1994) Unsuspected Primary Human-Immunodeficiency-Virus Type-1 Infection in Seronegative Emergency Department Patients. J Infect Dis 170: 194-197. doi: 10.1093/infdis/170.1.194. PubMed: 8014497. [DOI] [PubMed] [Google Scholar]
- 83. Bollinger RC, Brookmeyer RS, Mehendale SM, Paranjape RS, Shepherd ME et al. (1997) Risk factors and clinical preservation of acute primary HIV infection in India. JAMA:_Journal of the American Medical Association 278: 2085-2089. doi: 10.1001/jama.1997.03550230061038. [DOI] [PubMed] [Google Scholar]
- 84. Pilcher CD, Price MA, Hoffman IF, Galvin S, Martinson FEA et al. (2004) Frequent detection of acute primary HIV infection in men in Malawi. AIDS 18: 517-524. doi: 10.1097/00002030-200402200-00019. PubMed: 15090805. [DOI] [PubMed] [Google Scholar]
- 85. Foust E, Leone P, Vanhoy T, Owen-O'Dowd J, Hilton M et al. (2001) Partner counseling and referral services to identify persons with undiagnosed HIV - North Carolina, 2001. Morbidity and Mortality Weekly Report 52: 1181-1184. [PubMed] [Google Scholar]
- 86. Arias E (2007). United States Life Tables, 2004. [PubMed] [Google Scholar]
- 87. Yang OO, Boscardin WJ, Matud J, Hausner MA, Hultin LE et al. (2002) Immunologic profile of highly exposed yet HIV type 1-seronegative men. AIDS Res Hum Retroviruses 18: 1051-1065. doi: 10.1089/08892220260235416. PubMed: 12396457. [DOI] [PubMed] [Google Scholar]
- 88. Ho DD, Neumann AU, Perelson AS, Chen W, Leonard JM et al. (1995) Rapid Turnover of Plasma Virions and Cd4 Lymphocytes in Hiv-1 Infection. Nature 373: 123-126. doi: 10.1038/373123a0. PubMed: 7816094. [DOI] [PubMed] [Google Scholar]